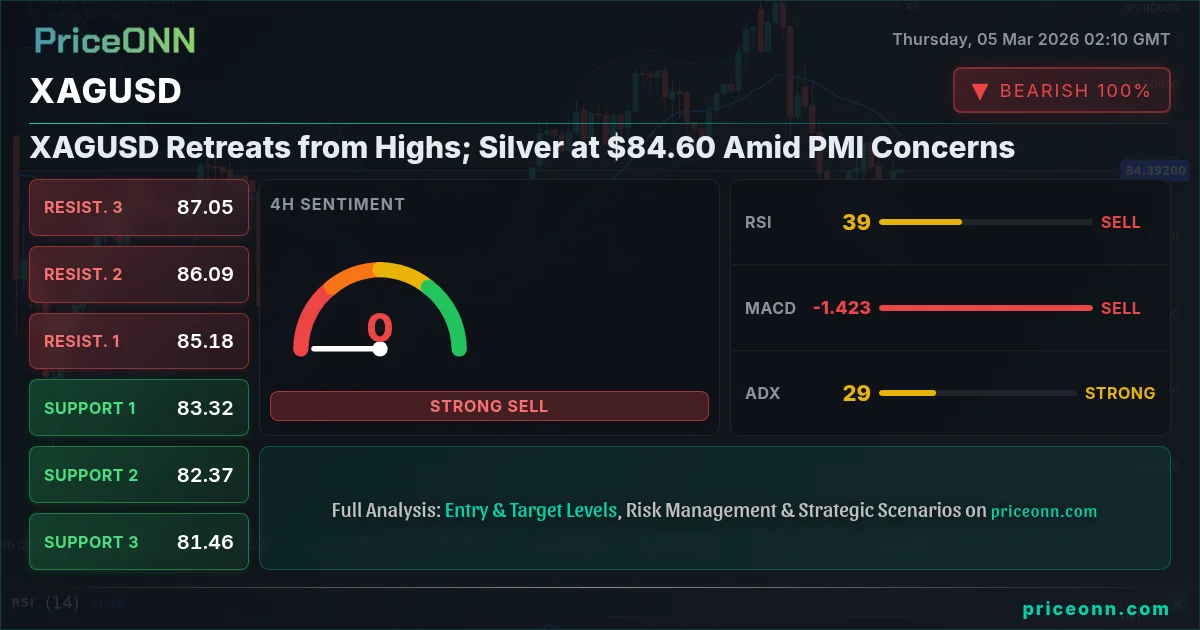
Silver's recent surge appears to be taking a breather, with XAGUSD currently trading at $84.60. The key question now is whether this is a temporary pause or the start of a deeper correction. I believe recent economic data, particularly concerning PMI figures, suggests that silver's path forward may be more challenging than previously anticipated.
- RSI at 51.96 on the 1-hour chart indicates neutral momentum.
- Key resistance level to watch is $84.30, a break above this level could signal renewed bullish momentum.
- ADX at 29.71 suggests a weakening downtrend, adding to short-term uncertainty.
- Weakening PMI data raises concerns about industrial demand for silver, impacting fundamental outlook.
Silver's Price Volatility: A Balancing Act
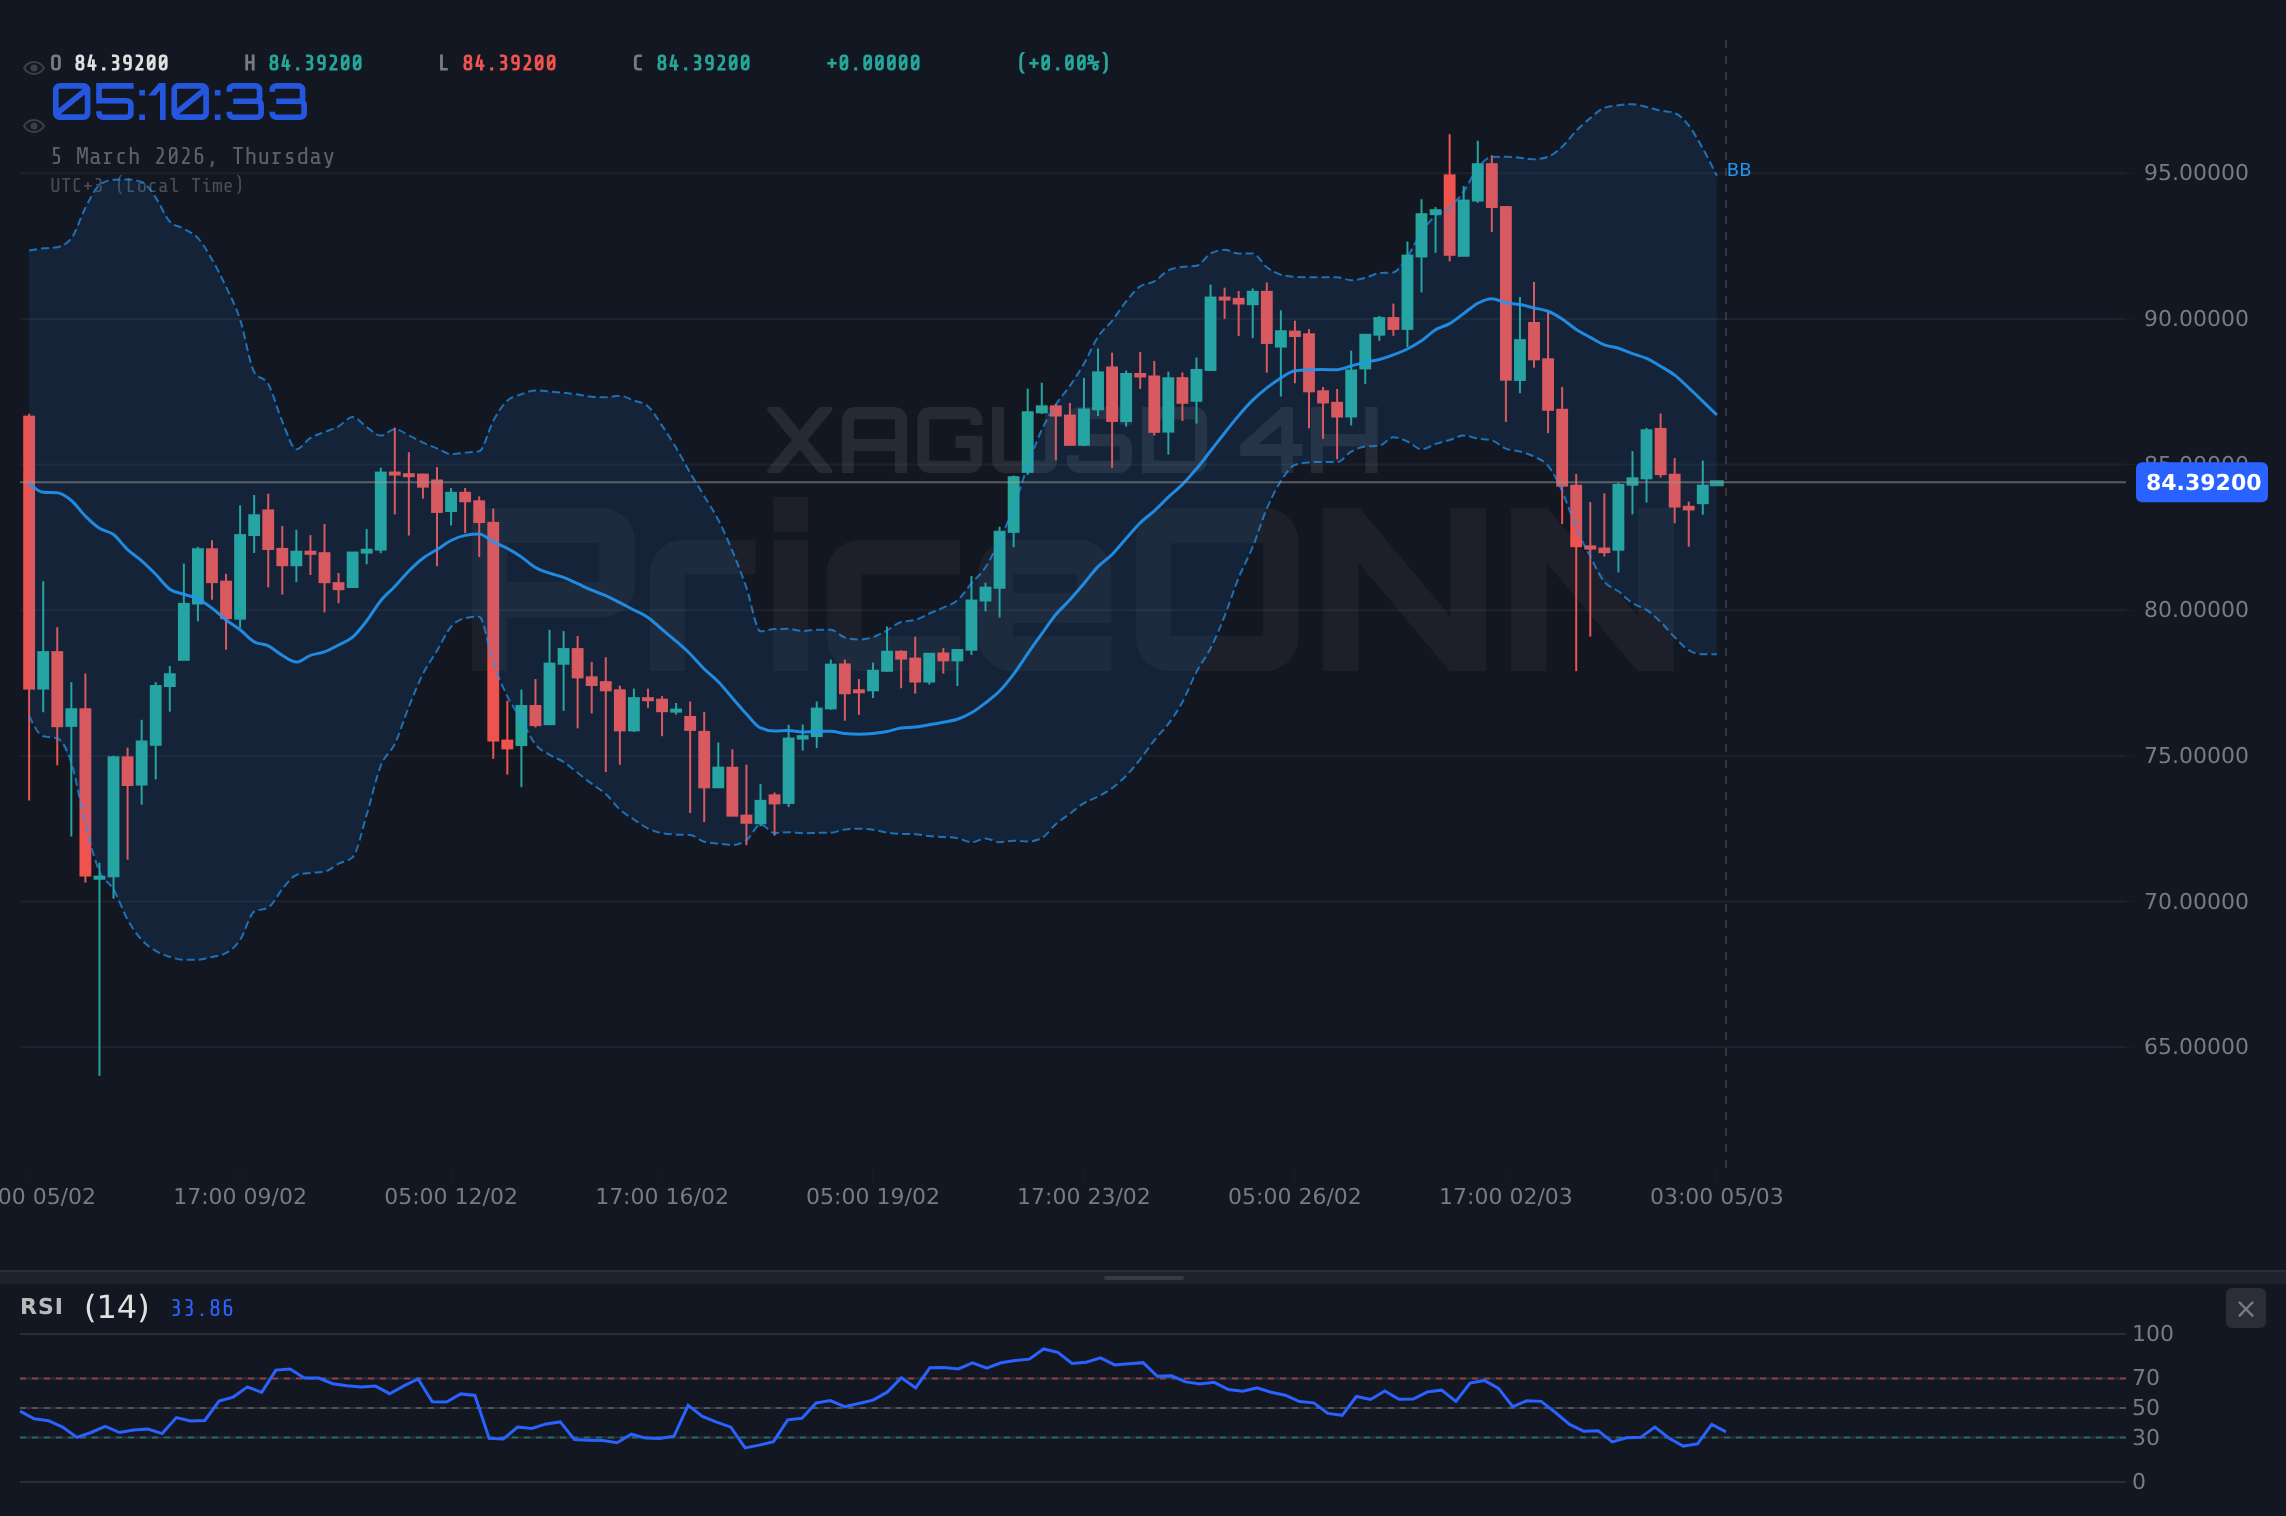
Silver's recent price action has been nothing short of volatile. The metal's surge above $86, driven by strong investment demand, was quickly met with profit-taking and renewed concerns about the global economic outlook. This has created a tug-of-war between bullish and bearish forces, leaving traders uncertain about silver's next move. The current price of $84.60 reflects this indecision, suggesting that the market is waiting for a clear catalyst to emerge.
Having tracked XAGUSD through multiple market cycles, it's clear that silver's price swings are often amplified by its dual nature as both a precious metal and an industrial commodity. This means that silver is not only influenced by safe-haven demand during times of economic uncertainty but also by industrial activity and global growth prospects. The recent weakness in PMI data highlights this dynamic, suggesting that industrial demand may be slowing, which could weigh on silver prices.
The PMI Puzzle: Industrial Demand in Focus
The latest PMI data, released earlier this week, painted a mixed picture of the global economy. While some regions showed signs of improvement, others reported weaker-than-expected activity. This has raised concerns about the strength of the global recovery and its potential impact on industrial demand for silver. According to Reuters, "concerns are arising regarding global economic outlook." Silver is a key component in many industrial applications, including electronics, solar panels, and automotive manufacturing. Therefore, any slowdown in these sectors could translate into lower demand for silver and, consequently, lower prices.
It's worth noting that the percentage of industrial demand for silver is significantly higher than that for gold. While gold is primarily used for investment and jewelry, silver has a much larger industrial footprint. This makes silver more sensitive to changes in economic growth and industrial activity. As highlighted in a recent PriceONN blog post, industrial demand plays a crucial role in silver's price dynamics, often misleading investors focused solely on gold correlations.
Technical Indicators: A Mixed Bag
A glance at the technical indicators reveals a mixed bag of signals. On the 1-hour chart, the RSI is hovering around 51.96, suggesting neutral momentum. However, the Stochastic oscillator shows a bullish signal, with %K at 73.35 above %D at 40.6. This divergence indicates that while short-term momentum may be picking up, the overall trend remains uncertain. The ADX, currently at 29.71, suggests that the downtrend is weakening, but not yet reversing. This further adds to the ambiguity surrounding silver's near-term outlook.
Looking at the 4-hour chart, the picture is even more complex. The RSI is at 44.62, indicating bearish momentum. The MACD histogram is negative, suggesting that selling pressure remains. However, the Stochastic oscillator is showing a bullish signal, with %K at 64.2 above %D at 54.08. This conflicting signal highlights the challenges traders face when trying to interpret silver's price action. The ADX on the 4-hour chart is at 29.32, reinforcing the view that the downtrend is losing steam, but not yet reversing.
The daily chart offers a slightly different perspective. The RSI is at 49.8, suggesting neutral momentum. The MACD histogram is positive, indicating that bullish momentum may be building. However, the Stochastic oscillator is showing a bearish signal, with %K at 45.56 below %D at 77.5. The ADX on the daily chart is at 20.48, indicating a moderate downtrend. This conflicting set of signals underscores the need for caution and patience when trading silver.
Key Levels to Watch
From a technical perspective, several key levels warrant close attention. Immediate resistance lies at $84.30, a break above which could signal renewed bullish momentum. Further resistance can be found at $84.50 and $84.73. On the downside, immediate support sits at $83.87, followed by $83.65 and $83.45. These levels will likely act as pivotal points in determining silver's next move. If silver can break above $84.30, it could trigger a rally towards $85. However, if it falls below $83.87, it could open the door for a deeper correction towards $83.65 or even $83.45.
Traders should also keep an eye on the DXY (Dollar Index), which currently stands at 98.52. A strengthening dollar could put downward pressure on silver prices, while a weakening dollar could provide a boost. Additionally, movements in the SP500 and Nasdaq should be monitored, as risk appetite can influence safe-haven demand for silver. As noted in recent market commentary, geopolitical tensions continue to add a layer of uncertainty, potentially boosting safe-haven demand.
Silver Trading Strategy: Patience is Key
Given the current market conditions, a patient approach to silver trading is warranted. It's crucial to avoid chasing price swings and instead focus on waiting for clear signals and confirmations. Traders should also be mindful of risk management and avoid over-leveraging their positions. One potential silver trading strategy involves waiting for a breakout above $84.30, followed by a retest of this level as support. This could provide a low-risk entry point for a long position, with a stop-loss placed below $83.87. Alternatively, traders could wait for a breakdown below $83.87, followed by a retest of this level as resistance. This could provide a low-risk entry point for a short position, with a stop-loss placed above $84.30.
The Fundamental Outlook: A Balancing Act
The fundamental outlook for silver remains a balancing act between strong investment demand and concerns about industrial activity. While geopolitical tensions and economic uncertainty could continue to support safe-haven demand, weaker-than-expected PMI data suggests that industrial demand may be slowing. This creates a challenging environment for silver traders, requiring a careful assessment of both technical and fundamental factors.
It's also important to consider the potential impact of central bank policies on silver prices. The Federal Reserve's monetary policy decisions, in particular, could have a significant impact on the dollar and, consequently, on silver. Traders should closely monitor upcoming economic data releases, such as the non-farm payrolls report, as these could provide clues about the Fed's future policy moves. According to Bloomberg, "central banks are expected to remain cautious in their approach to monetary policy," which could limit the upside for silver.
Actionable Insight: Watch $83.87
The key actionable insight for silver traders right now is to watch the $83.87 level. A sustained break below this level could signal a deeper correction, while a hold above this level could indicate renewed bullish momentum. Traders should also pay close attention to upcoming economic data releases and geopolitical developments, as these could provide catalysts for silver's next move. Manage your risk, wait for your setup- the market always gives a second chance.
Frequently Asked Questions: XAGUSD Analysis
Is XAGUSD a good buy right now?
Given the current price of $84.60 and mixed signals, it's not a straightforward buy. A bullish case could be made on a break above $84.30, but caution is advised until PMI data improves.
What is the XAGUSD price forecast for this week?
The price forecast for XAGUSD this week is highly uncertain. Key support is at $83.87; holding above this level could lead to a test of $85, but a break below could see further declines.
What are the key support and resistance levels for XAGUSD?
Key support for XAGUSD is at $83.87, $83.65, and $83.45. Key resistance levels are $84.30, $84.50, and $84.73, based on the current 1-hour timeframe.
Why is XAGUSD moving today?
XAGUSD's movement today is influenced by a combination of factors, including weaker-than-expected PMI data and general market risk sentiment. These factors are creating a tug-of-war between bullish and bearish forces.
Track markets in real-time
AI-powered analysis, technical indicators and real-time price data.
Join Our Telegram Channel
Breaking market news, AI analysis and trading signals instantly.
Join Channel