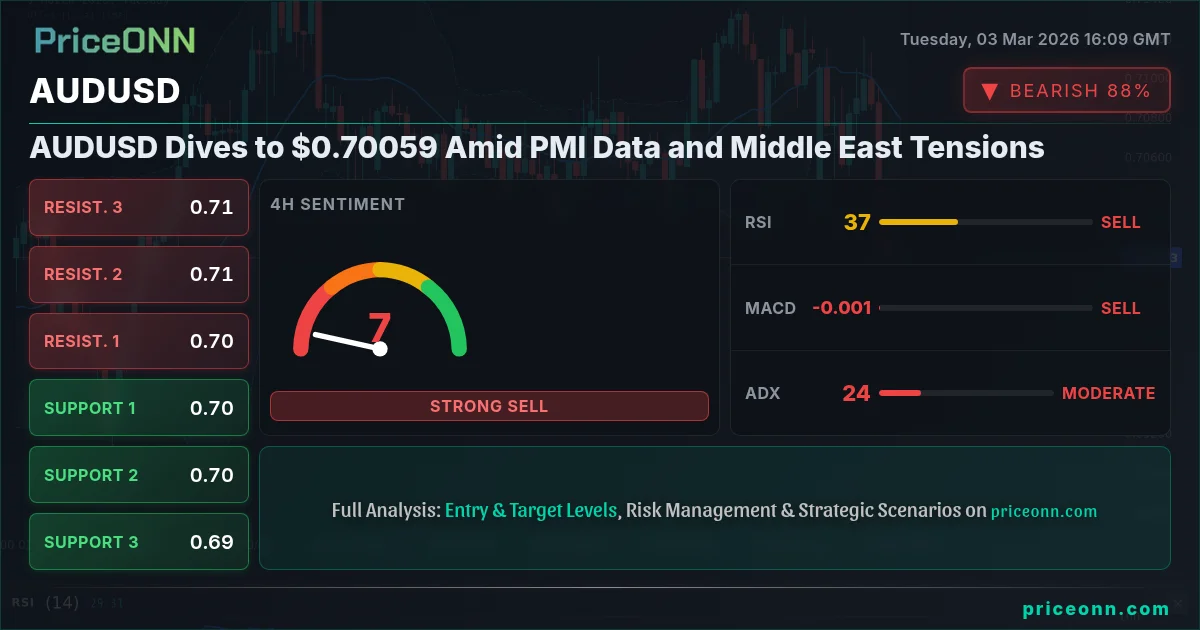
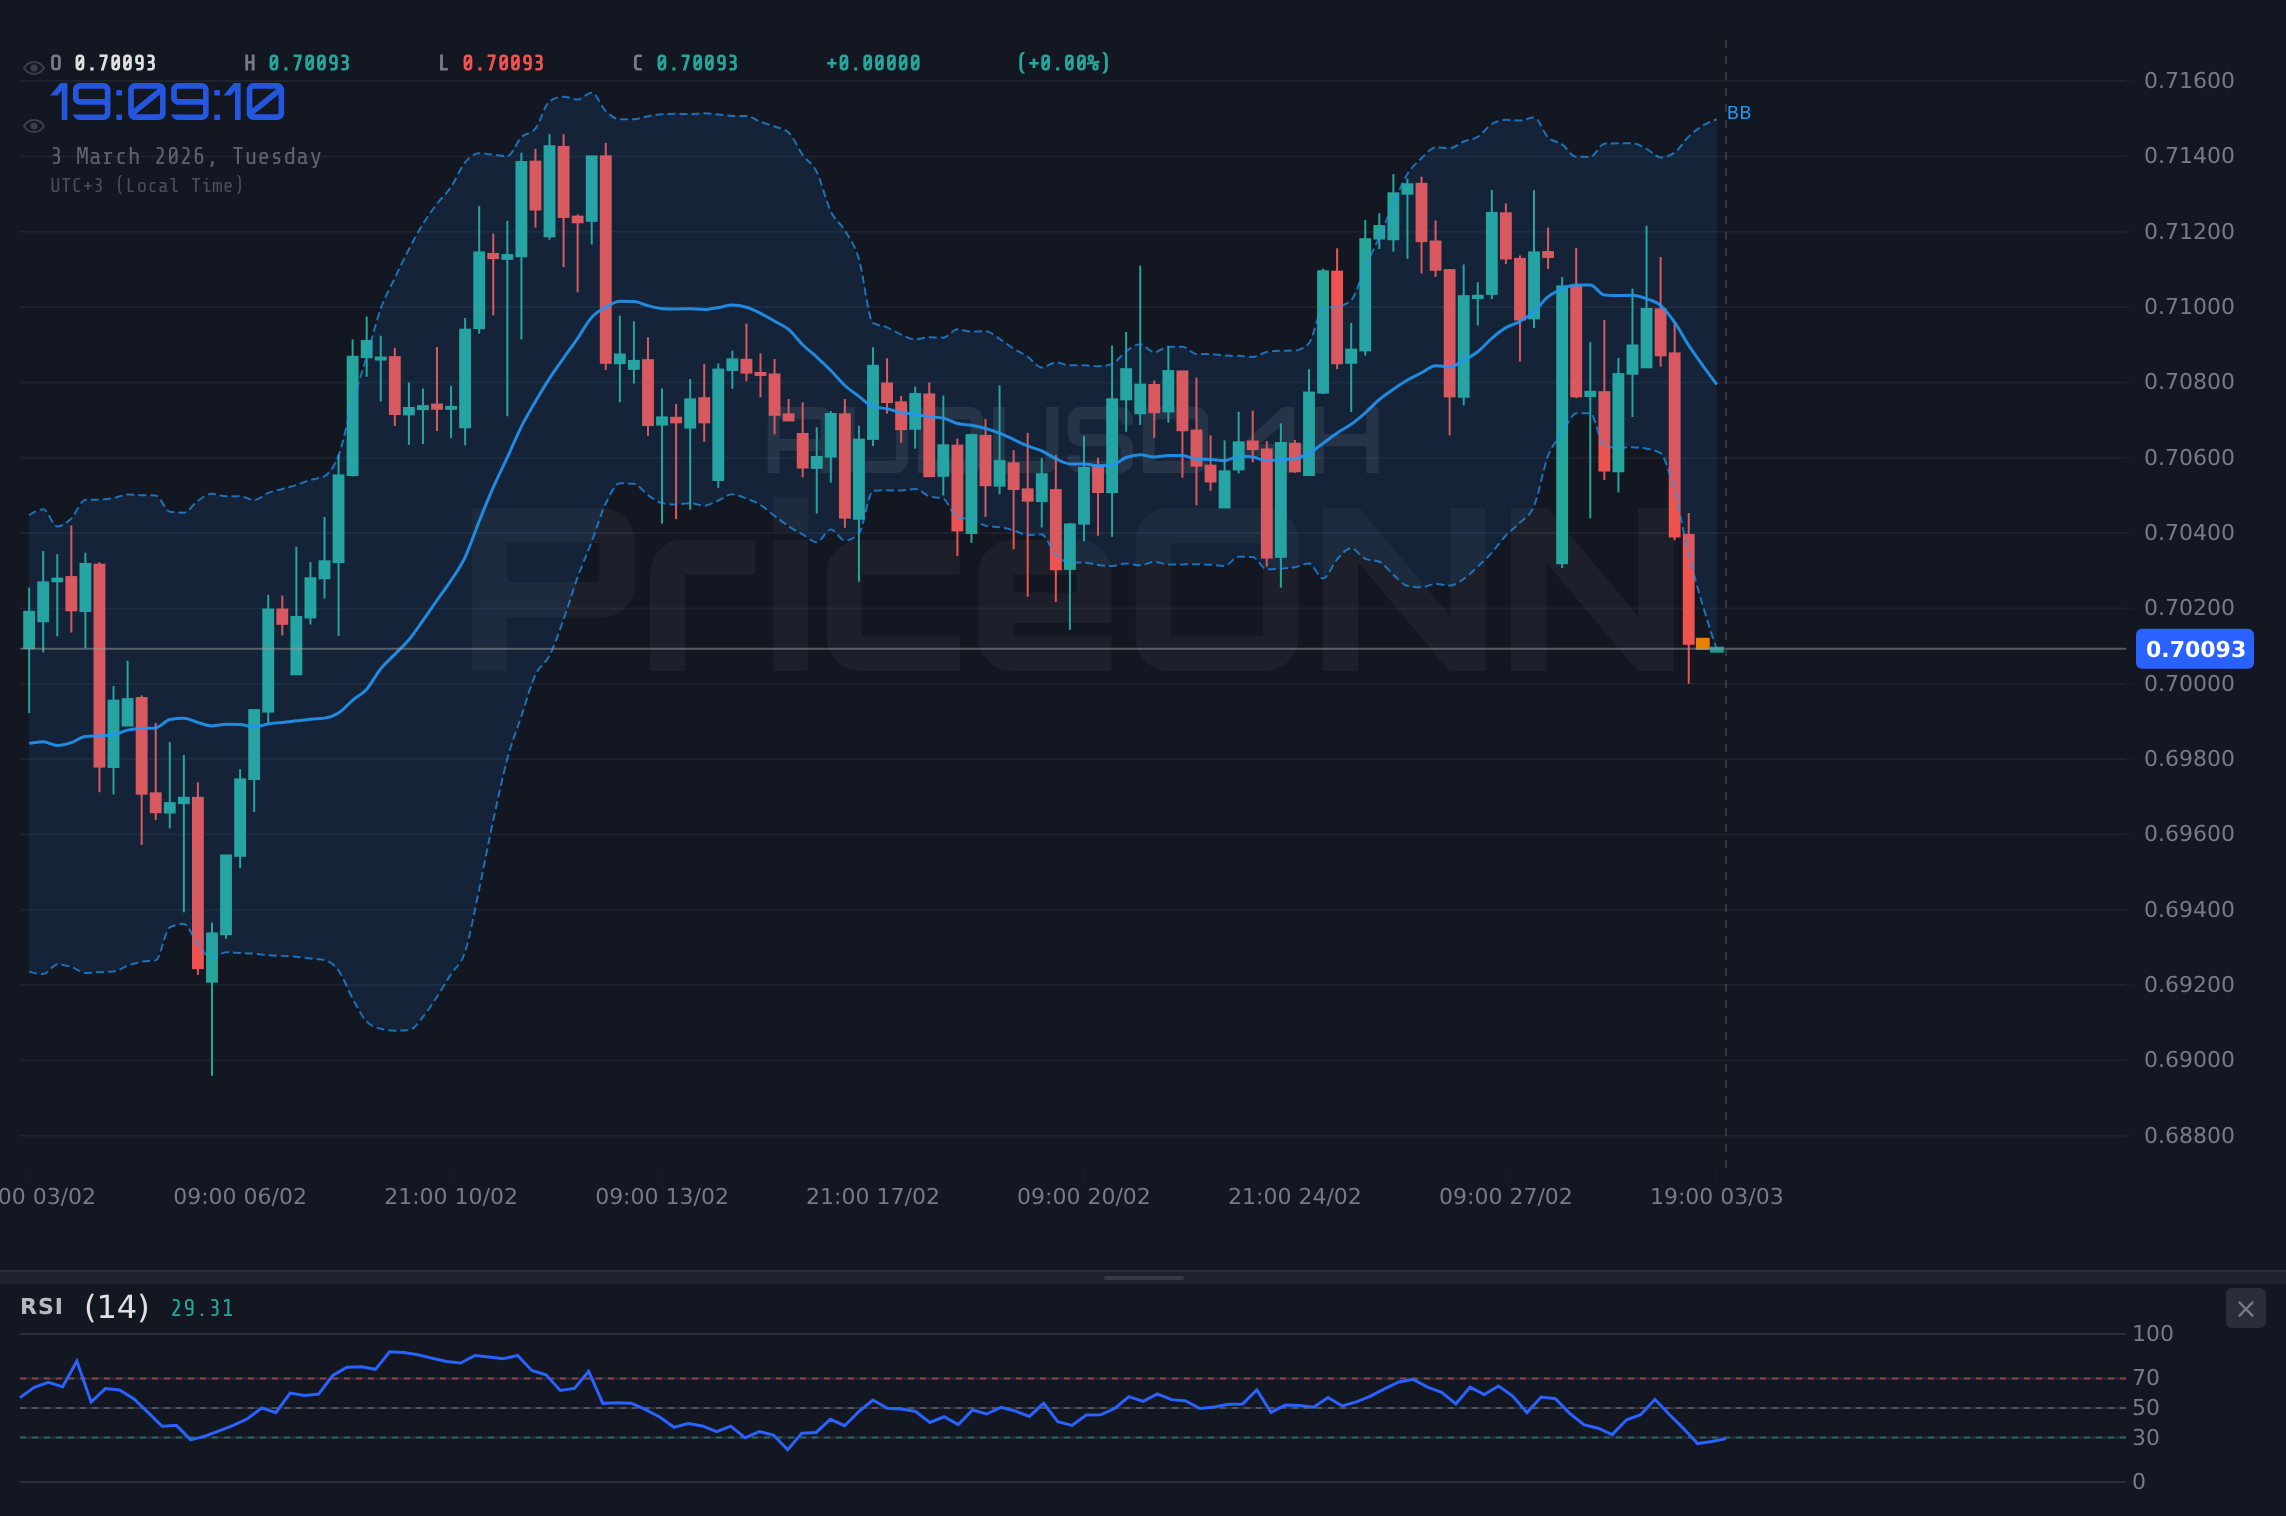
The Australian dollar finds itself under significant pressure, with AUDUSD currently trading at $0.70059. The currency pair is caught between disappointing economic data and escalating geopolitical tensions in the Middle East. The battle between bulls and bears is intensifying around this key level, leaving traders uncertain about the next move.
- AUDUSD fell to $0.70059 due to weak PMI data and rising geopolitical risks.
- Key support level to watch is 0.69593, with a break below potentially triggering further declines.
- The RSI at 31.52 suggests oversold conditions, but the strong downtrend may negate this signal.
- Middle East tensions are driving safe-haven demand, strengthening the US dollar and weighing on AUDUSD.
The Bull Case for AUDUSD: A Potential Rebound
Despite the current bearish sentiment, there are arguments to be made for a potential AUDUSD rebound. The Relative Strength Index (RSI) on the 1-hour chart is at 31.52, nearing oversold territory. This suggests that the selling pressure may be exhausted, and a bounce could be imminent. Furthermore, the Stochastic oscillator shows %K at 14.8 and %D at 11.8, both in oversold conditions, generating a potential buy signal.
From a fundamental perspective, if risk sentiment stabilizes and concerns over the Middle East ease, the Australian dollar could find some support. The Australian economy remains relatively robust, and any positive surprises in upcoming economic data could provide a boost. Moreover, a weaker US dollar would naturally benefit AUDUSD. Scalpers might look for quick long opportunities near the 0.69593 support level, anticipating a short-term bounce. Swing traders could wait for confirmation of a reversal pattern before entering a long position, while long-term investors may see this dip as an opportunity to accumulate AUDUSD at a discounted price.
The Bear Case for AUDUSD: Downtrend Remains Intact
The bearish outlook for AUDUSD is supported by several technical and fundamental factors. The pair is trading below its 1-hour and 4-hour moving averages, indicating a strong downtrend. The ADX on the 1-hour chart is at 22.94, confirming the strength of the current downtrend. The MACD histogram is negative, further reinforcing the bearish momentum. The overall technical signal based on the 1-hour timeframe is a strong 'Sell'.
Escalating tensions in the Middle East are driving investors towards safe-haven assets, boosting the US dollar and weighing on AUDUSD. According to recent reports, the surge in crude oil prices following retaliatory strikes by Iran has further fueled risk aversion. As risk appetite declines, safe-haven currencies like the US dollar tend to outperform riskier assets like the Australian dollar. Several economic data releases are scheduled for this week, including the U.S. ADP Nonfarm Employment Change on Wednesday and U.S. Retail Sales on Friday. A daily close below 0.69593 would likely open the door for a test of lower support levels, potentially targeting 0.69168.
Technical Analysis: A Battleground of Conflicting Signals
A multi-timeframe analysis reveals a mixed picture for AUDUSD. On the 1-hour chart, the ADX is at 22.94, indicating a moderate downtrend. However, the RSI is nearing oversold territory, suggesting a potential for a short-term bounce. On the 4-hour chart, the ADX is similar at 22.1, also indicating a moderate downtrend, while the RSI is at 34.13, still in neutral territory but trending downward. The daily chart shows a stronger downtrend with an ADX of 37, but the RSI at 48.29 suggests there is still room for further declines.
The MACD across all three timeframes is negative, further reinforcing the bearish sentiment. The Stochastic oscillator, however, presents conflicting signals. On the 1-hour chart, the Stochastic is oversold, suggesting a potential for a buy signal. On the 4-hour chart and daily chart, the Stochastic is trending downward, indicating further downside potential. This divergence in signals highlights the uncertainty surrounding the near-term outlook for AUDUSD. Scalpers might use the oversold Stochastic on the 1-hour chart for short-term long positions, while swing traders might wait for confirmation of a breakout below key support levels before entering short positions.
Correlation Analysis: DXY and Commodity Prices
AUDUSD's movements are closely correlated with the DXY (Dollar Index) and commodity prices. The DXY is currently at 98.99, up 0.77% on the day, indicating a strengthening US dollar. This puts significant pressure on AUDUSD, as a stronger dollar typically leads to a weaker Australian dollar. The SP500 is down 1.72%, reflecting declining risk appetite and further supporting the US dollar's safe-haven appeal. Crude oil prices are up 8.56%, driven by escalating tensions in the Middle East. While Australia is a major commodity exporter, the positive impact of higher oil prices is being overshadowed by the negative impact of a stronger US dollar and declining risk sentiment.
The correlation with bond yields is also worth noting. As Treasury yields rise, reflecting expectations of higher interest rates, the US dollar tends to strengthen, putting further pressure on AUDUSD. Investors should closely monitor these correlations to gain a better understanding of the drivers behind AUDUSD's movements. Long-term investors should focus on the broader macroeconomic picture and the relative strength of the Australian and US economies, while scalpers and swing traders should pay closer attention to short-term correlations with the DXY and commodity prices.
Fundamental Drivers: PMI Data and Geopolitical Risks
The recent decline in AUDUSD can be attributed to a combination of disappointing economic data and escalating geopolitical risks. The Australian economy has been showing signs of slowing down, with recent PMI data falling below expectations. This has raised concerns about the outlook for economic growth and has weighed on the Australian dollar. Moreover, escalating tensions in the Middle East are driving investors towards safe-haven assets, boosting the US dollar and weighing on AUDUSD. According to Reuters, the escalation of tensions has led to a surge in demand for safe-haven currencies like the US dollar and the Japanese yen.
The upcoming U.S. ADP Nonfarm Employment Change on Wednesday and U.S. Retail Sales on Friday will be closely watched by investors. Strong data would likely reinforce the bullish outlook for the US dollar and put further pressure on AUDUSD. Conversely, weak data could provide some relief for the Australian dollar. The S&P Global Japan Services Purchasing Managers' Index (PMI) data will be released on Wednesday, which may have a limited impact on AUDUSD but could provide some insights into the global economic outlook. Traders should closely monitor these data releases and adjust their positions accordingly. Swing traders should be prepared for increased volatility around these events, while long-term investors should focus on the overall trend and the long-term economic outlook.
AUDUSD: What Happens Next?
The near-term outlook for AUDUSD remains uncertain, with conflicting signals from technical indicators and fundamental drivers. The key level to watch is 0.69593, which represents a critical support level. A break below this level would likely trigger further declines, potentially targeting 0.69168. Conversely, a sustained bounce above this level could signal a short-term rebound, with initial resistance at 0.70018. Given the current market conditions, a 'Watch Zone' recommendation is appropriate. This means that traders should remain cautious and wait for confirmation of a clear trend before entering a position.
Scalpers may look for quick long opportunities near the 0.69593 support level, anticipating a short-term bounce. Swing traders could wait for confirmation of a breakout below key support levels before entering short positions, or for a clear reversal pattern before entering long positions. Long-term investors should focus on the broader macroeconomic picture and the relative strength of the Australian and US economies. Patient investors always find opportunities- the key is waiting for the right moment.
Frequently Asked Questions: AUDUSD Analysis
Is AUDUSD a good buy right now?
Given the current downtrend and strong US dollar, AUDUSD is not a good buy right now. The pair is trading at $0.70059, and a break below the key support level of 0.69593 could trigger further declines, making it a risky proposition.
What is the AUDUSD price forecast for this week?
The AUDUSD price forecast for this week is bearish, with a potential target of 0.69168 if the 0.69593 support level is broken. However, a short-term rebound is possible if risk sentiment improves and the US dollar weakens.
What are the key support and resistance levels for AUDUSD?
Key support levels for AUDUSD are 0.69593, 0.69446, and 0.69168. Key resistance levels are 0.70018, 0.70296, and 0.70443, according to the provided market data.
Why is AUDUSD moving today?
AUDUSD is moving lower today due to a combination of disappointing economic data and escalating geopolitical risks in the Middle East. This has led to a stronger US dollar and a decline in risk appetite, weighing on the Australian dollar.
Technical Outlook Summary
| Indicator | Value | Signal |
|---|---|---|
| RSI (14) | 31.52 | Neutral |
| MACD Histogram | Negative | Bearish |
| Stochastic | 14.8 | Bullish |
| ADX | 22.94 | Bearish |
| Bollinger | Lower Band | Watch |
Key Levels
Support Levels
Resistance Levels
Track markets in real-time
AI-powered analysis, technical indicators and real-time price data.
Join Our Telegram Channel
Breaking market news, AI analysis and trading signals instantly.
Join Channel