The Australian dollar (AUDUSD) finds itself at a critical juncture, trading around $0.70397, as traders weigh a mixed bag of technical indicators against the backdrop of broader market dynamics. The strength of the US dollar, reflected in the rising DXY at 98.82, is exerting downward pressure on the pair, while upcoming Purchasing Managers' Index (PMI) data could provide further clues about the health of the Australian economy. This creates a challenging environment for devising an effective australian dollar trading strategy.
- RSI on the 1H chart at 42.73 signals potential for further downside momentum in AUDUSD.
- Key support level for AUDUSD sits at 0.70102, a break below which could trigger further selling.
- MACD on the 4H chart indicates positive momentum, potentially offering short-term bullish opportunities.
- DXY strength, currently at 98.82, is a significant headwind for AUDUSD, requiring careful monitoring.
The AUDUSD pair's direction is heavily influenced by the strength of the US dollar, as indicated by the Dollar Index (DXY). With the DXY currently at 98.82 and showing a bullish trend across all timeframes (1H, 4H, and 1D), the AUDUSD is facing significant downward pressure. Historically, a strong DXY often correlates with a weaker AUDUSD, as the Australian dollar becomes relatively less attractive to investors. This inverse relationship stems from the fact that the US dollar is often considered a safe-haven currency, and its strength reflects increased risk aversion in the global markets. In times of economic uncertainty or geopolitical tensions, investors tend to flock to the dollar, driving up its value and putting pressure on other currencies, including the Australian dollar.
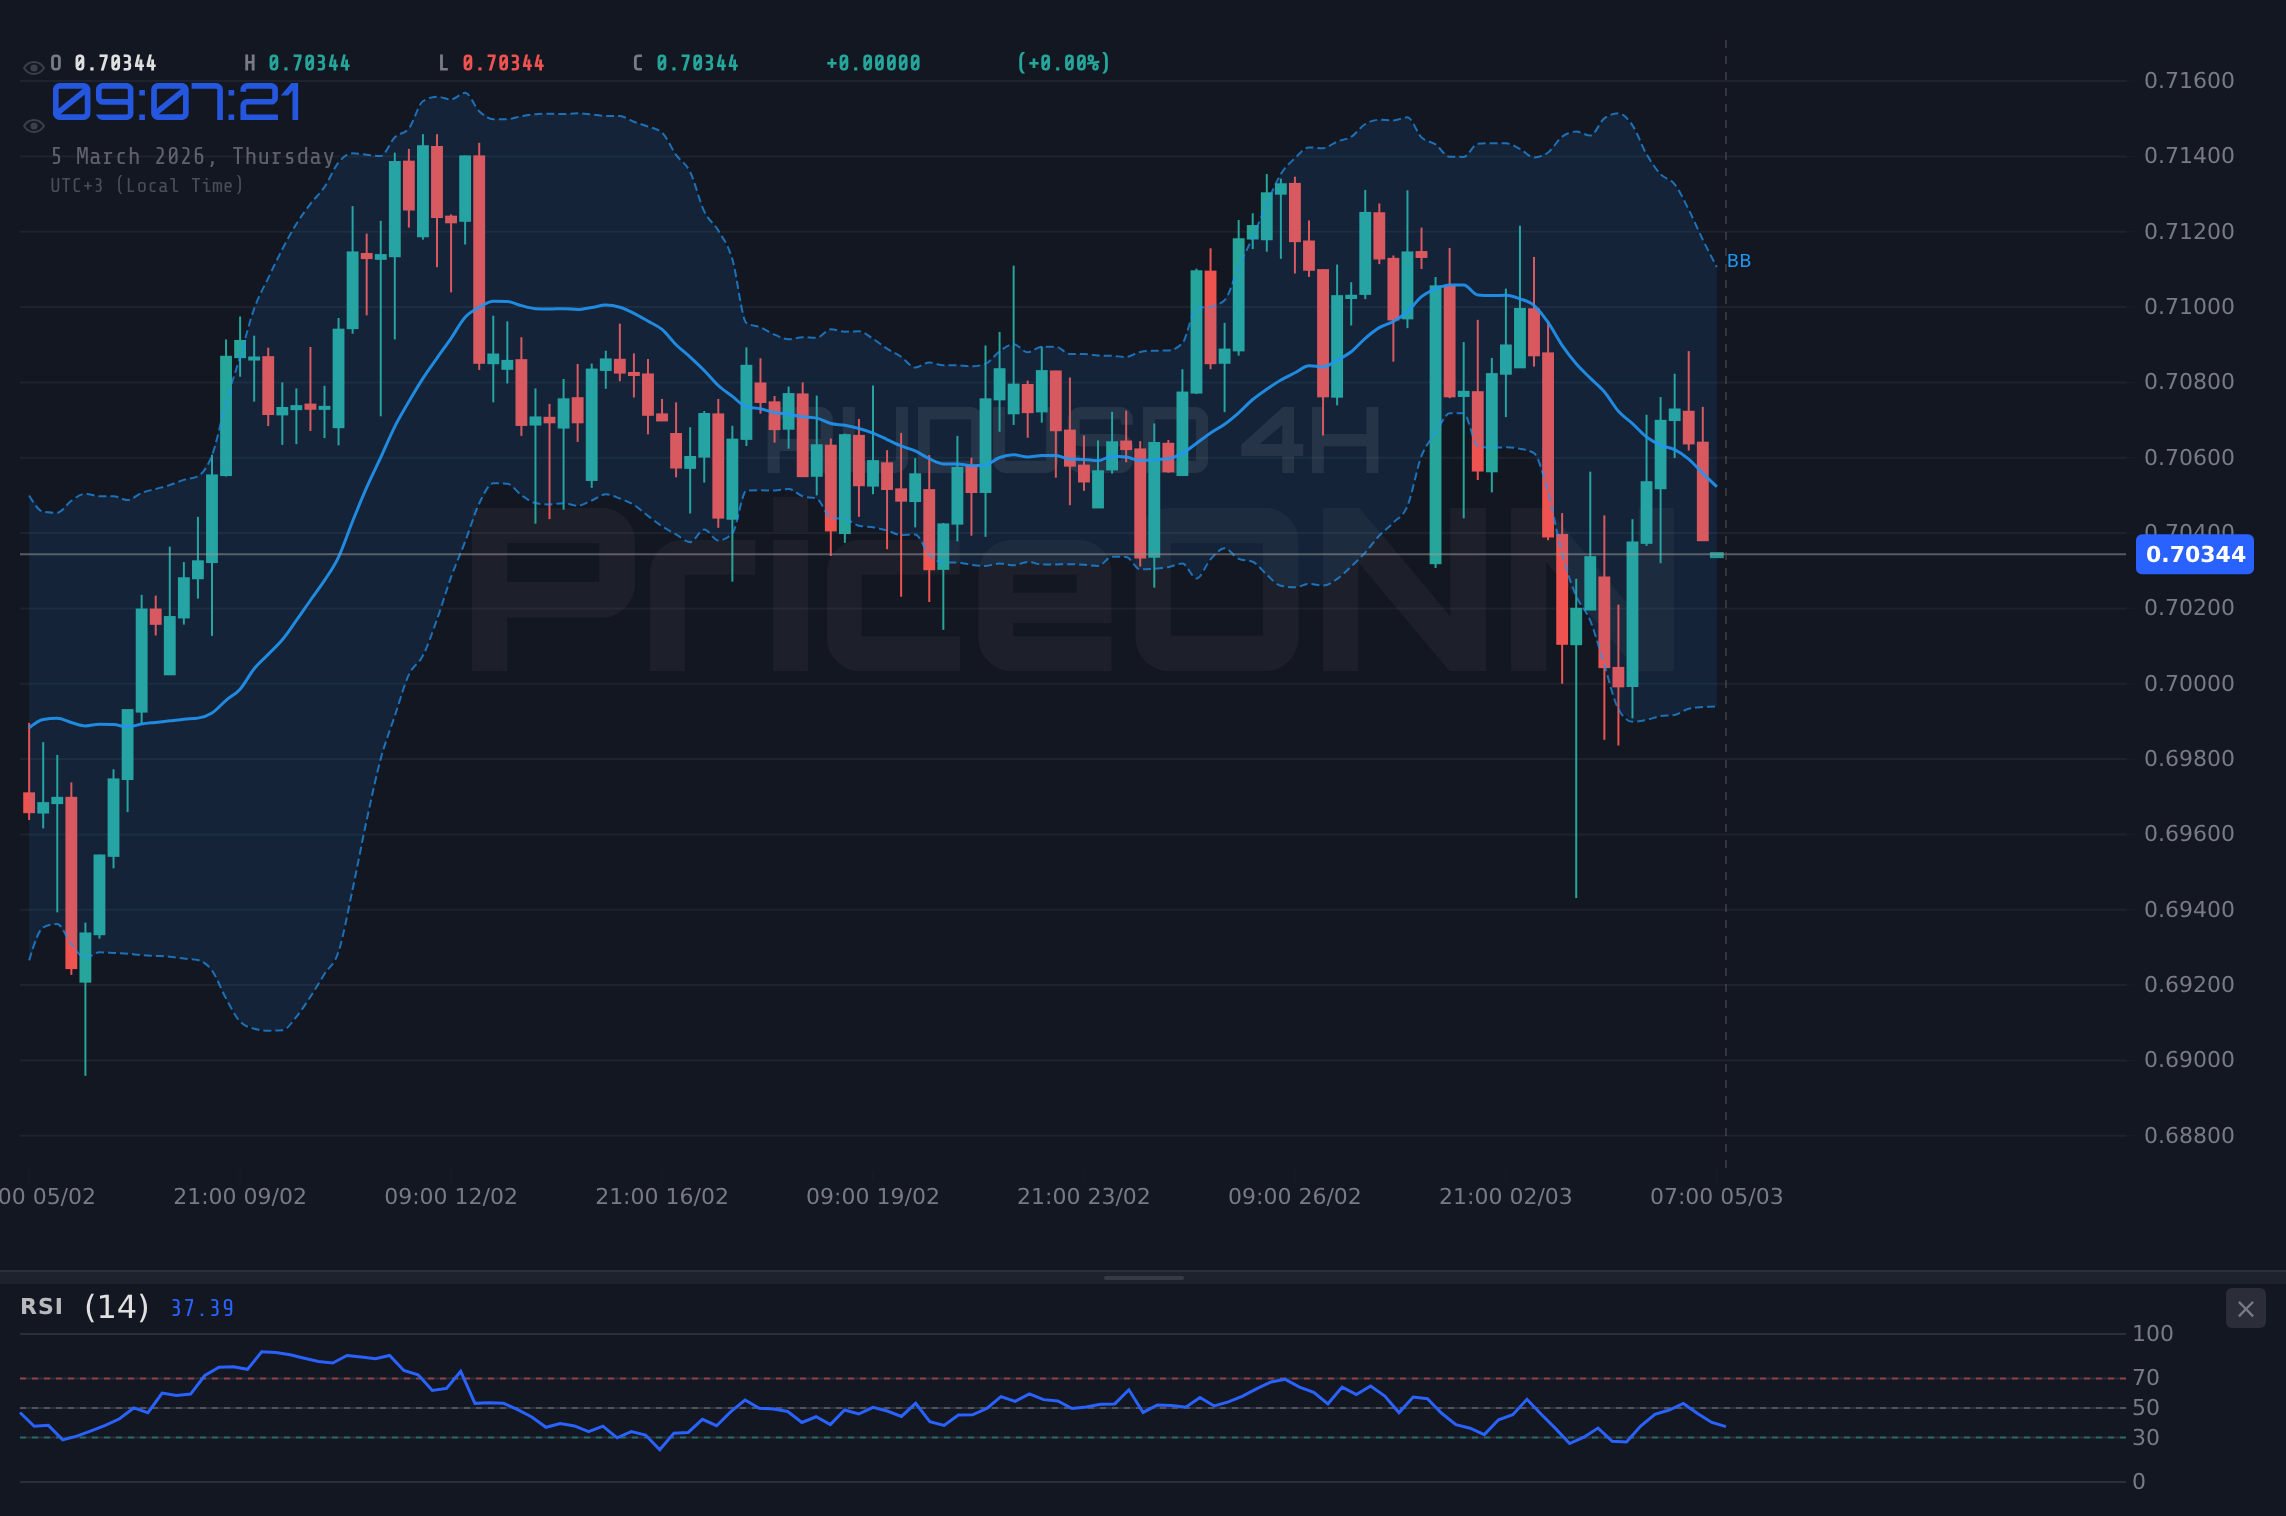
From a technical perspective, the AUDUSD presents a mixed picture. The 1H and 4H timeframes show a neutral trend, with the ADX indicating a weak or moderate trend strength. However, the 1D timeframe points to a bullish trend, suggesting that the overall long-term outlook for the pair remains positive. The RSI on the 1H chart is at 42.73, indicating potential for further downside momentum. The Stochastic oscillator on the 1H chart also confirms a bearish signal (%K
The upcoming PMI data will be crucial in determining the short-term direction of the AUDUSD. A strong PMI reading would suggest that the Australian economy is performing well, potentially boosting the Australian dollar and offsetting the negative impact of the strong US dollar. Conversely, a weak PMI reading would confirm the bearish outlook for the pair and could lead to further declines. The market is currently pricing in a degree of uncertainty, as reflected in the neutral trend across multiple timeframes. The last PMI data release on Monday showed [USD] data, indicating a previous reading of 52.4. The market is looking for clues about the health of the manufacturing and services sectors, as these are key indicators of overall economic activity. Any significant deviation from expectations could trigger a sharp move in the AUDUSD.
Looking at the broader market context, the SP500 is currently trading at 6845.45, showing a bearish trend on the 1D timeframe. This suggests that risk appetite is declining, which could further support the US dollar and put pressure on the AUDUSD. The price of Brent crude oil is currently at $65.73, showing a bullish trend across all timeframes. This could provide some support for the Australian dollar, as Australia is a major exporter of commodities, including oil. However, the positive impact of rising oil prices may be limited by the strength of the US dollar. The aluminium price soared on supply fears. According to Reuters, new tariffs are being prepared by the Trump administration. The energy market is bracing for impact as US-Japan nuclear deal looms.
From a historical perspective, the AUDUSD has often been seen as a proxy for global risk sentiment. In times of economic expansion and rising commodity prices, the Australian dollar tends to perform well, as it is supported by strong export earnings. However, in times of economic uncertainty and declining commodity prices, the Australian dollar tends to underperform, as investors seek the safety of the US dollar. This relationship has been particularly evident in recent years, as the global economy has been buffeted by a series of shocks, including the COVID-19 pandemic, rising inflation, and geopolitical tensions. The current market environment is characterized by a high degree of uncertainty, making it difficult to predict the future direction of the AUDUSD with any degree of confidence. USD/JPY Eyes 158.00: Geopolitical Tensions and Fed Rate Expectations Fuel Dollar Strength.
For scalpers, the 1H timeframe offers the most relevant trading signals. The RSI at 42.73 suggests that the pair may be oversold in the short term, potentially offering opportunities for buying on dips. However, the Stochastic oscillator confirms a bearish signal, suggesting that the pair may continue to decline in the near term. Scalpers should watch the 0.70391 support level for a potential bounce, but they should also be prepared to sell if the pair breaks below this level. For swing traders, the 4H timeframe provides a more balanced perspective. The MACD shows positive momentum, potentially offering opportunities for buying on breakouts. However, the ADX indicates a strong bearish trend, suggesting that the pair may continue to decline in the medium term. Swing traders should wait for a clear break above the 0.70561 resistance before entering long positions, and they should set their stop-loss orders carefully to protect their capital. Long-term investors should focus on the broader economic picture and consider the potential for a rebound in commodity prices, which could support the Australian dollar. They should also monitor the actions of the Reserve Bank of Australia (RBA), as monetary policy decisions can have a significant impact on the value of the Australian dollar.
The correlation analysis reveals that the AUDUSD is negatively correlated with the DXY, as expected. A rising DXY typically puts downward pressure on the AUDUSD, while a falling DXY tends to support the pair. The AUDUSD is also positively correlated with commodity prices, particularly oil and gold. Rising commodity prices tend to support the Australian dollar, as Australia is a major exporter of these commodities. However, the strength of the US dollar can often offset the positive impact of rising commodity prices. The AUDUSD is also correlated with the SP500, although this relationship is less consistent. In general, a rising SP500 tends to support the AUDUSD, as it reflects increased risk appetite in the global markets. However, in times of economic uncertainty, the SP500 and the AUDUSD may decouple, as investors seek the safety of the US dollar.
AUDUSD breaks below the 0.70102 support, driven by a stronger DXY and weaker-than-expected PMI data. Targets include 0.69475 and 0.69115.
AUDUSD finds support at 0.70102 and rallies towards the 0.71089 resistance, driven by positive PMI data and a weaker DXY. Further upside towards 0.71449 is possible.
Upcoming PMI data (2026-03-02) could trigger significant volatility in AUDUSD. Trade with caution and manage your risk effectively.
The AUDUSD is facing a challenging environment, as traders weigh a mixed bag of technical indicators against the backdrop of broader market dynamics. The strength of the US dollar is a significant headwind for the pair, while upcoming PMI data could provide further clues about the health of the Australian economy. Traders should monitor the DXY, commodity prices, and the SP500 closely, as these factors can all have a significant impact on the value of the AUDUSD. Patience looks like it will be rewarded here. Manage your risk, wait for your setup-the market always gives a second chance.
Technical Outlook Summary
| Indicator | Value | Signal |
|---|---|---|
| RSI (14) | 42.73 | Bearish |
| MACD Histogram | Positive | Bullish |
| Stochastic | K=6.91, D=40.19 | Bearish |
| ADX | 14.13 | Weak Trend |
| Bollinger | Middle Band | Neutral |
Key Levels
Support Levels
Resistance Levels
Frequently Asked Questions: AUDUSD Analysis
Is AUDUSD a good buy right now?
AUDUSD is not necessarily a good buy right now, given the downtrend and strong DXY. However, waiting for a break above 0.70561 resistance might present a buying opportunity targeting 0.71089.
What is the AUDUSD price forecast for this week?
The AUDUSD price forecast for this week is mixed. A break above 0.70561 could lead to 0.71089, while a break below 0.70102 could see the pair testing 0.69475. Overall, I'd give a 55% chance to the downside.
What are the key support and resistance levels for AUDUSD?
Key support levels for AUDUSD are 0.70102, 0.69475, and 0.69115. Key resistance levels are 0.71089, 0.71449, and 0.72076, all based on today's live market data.
Why is AUDUSD moving today?
AUDUSD is moving today primarily due to the strength of the US dollar, as indicated by the rising DXY. Upcoming PMI data and overall market sentiment are also contributing factors.
Track markets in real-time
AI-powered analysis, technical indicators and real-time price data.
Join Our Telegram Channel
Breaking market news, AI analysis and trading signals instantly.
Join Channel