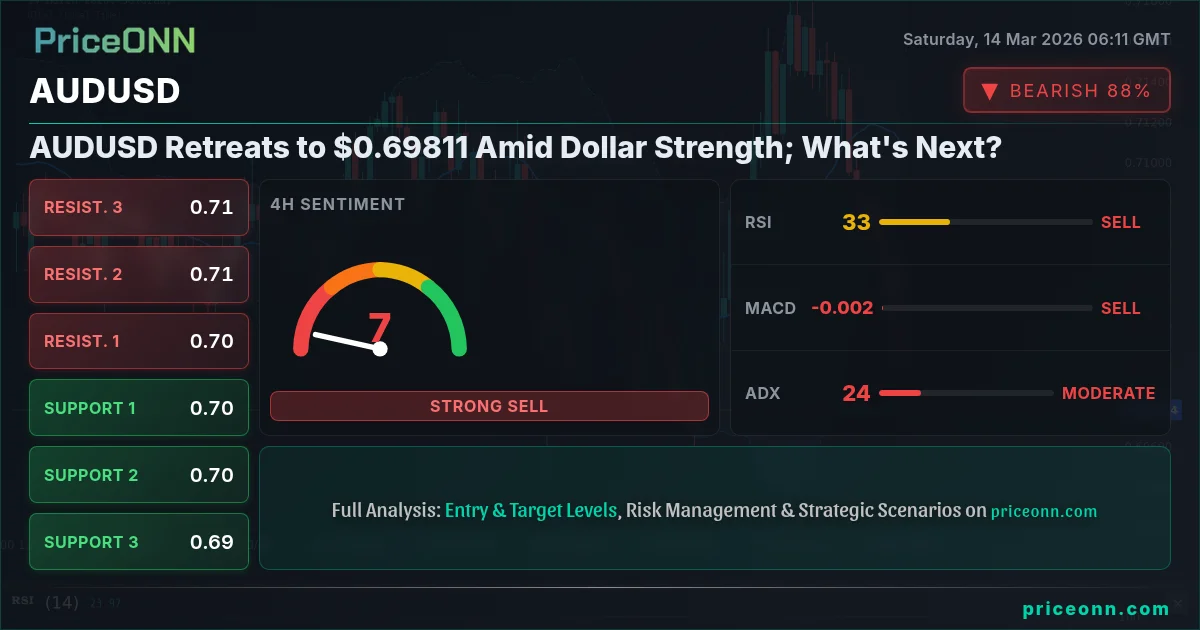
AUDUSD's 1.3% decline this past week has traders on edge, especially with the pair closing Friday near $0.69811. The strengthening dollar, reflected in the DXY's rise to 100.2, is certainly playing a role, but is that the whole story? I think there's more to it than meets the eye, and the upcoming CPI data could be a major catalyst.
- AUDUSD retreated 1.3% this week, closing near $0.69811, pressured by a strong dollar.
- Key support levels to watch are 0.69972 (1H), 0.70327 (4H), and 0.70409 (1D).
- The RSI on the 1H chart is at 23.99, signaling oversold conditions, but a break below 0.69861 could trigger further selling.
- Upcoming CPI data from the US and potential RBA rate hike expectations are key catalysts for next week's price action.
Dollar Dominance Weighs on AUDUSD
The DXY's surge to 100.2 is no small feat. A strong dollar puts pressure on nearly every other currency, and the Aussie is no exception. Looking at the broader picture, escalating tensions in the Middle East, as reported by multiple news outlets this week, are adding fuel to the dollar's fire as investors seek safe-haven assets. This risk-off sentiment is further reflected in the SP500's 0.81% drop to 6625.3 and the Nasdaq100's similar decline to 24337.41. With the dollar index at 100.2, AUDUSD is clearly under pressure, and traders need to respect the trend.
Technical Breakdown: Key Levels and Indicators
Let's dive into the technicals and see what the charts are telling us. On the 1-hour timeframe, AUDUSD is clearly in a downtrend, with the ADX at a strong 41.57. The RSI at 23.99 indicates oversold conditions, suggesting a potential bounce, but don't jump the gun just yet. The MACD is still showing negative momentum, and the price is trading below the middle Bollinger Band, confirming the bearish bias. Key support to watch on this timeframe is 0.69861. A break below this level could open the door for further downside towards 0.69775. However, the Stochastic at 5.43 is in extreme oversold territory, signaling a potential reversal. The question is, will the bulls step in, or will the bears maintain control?
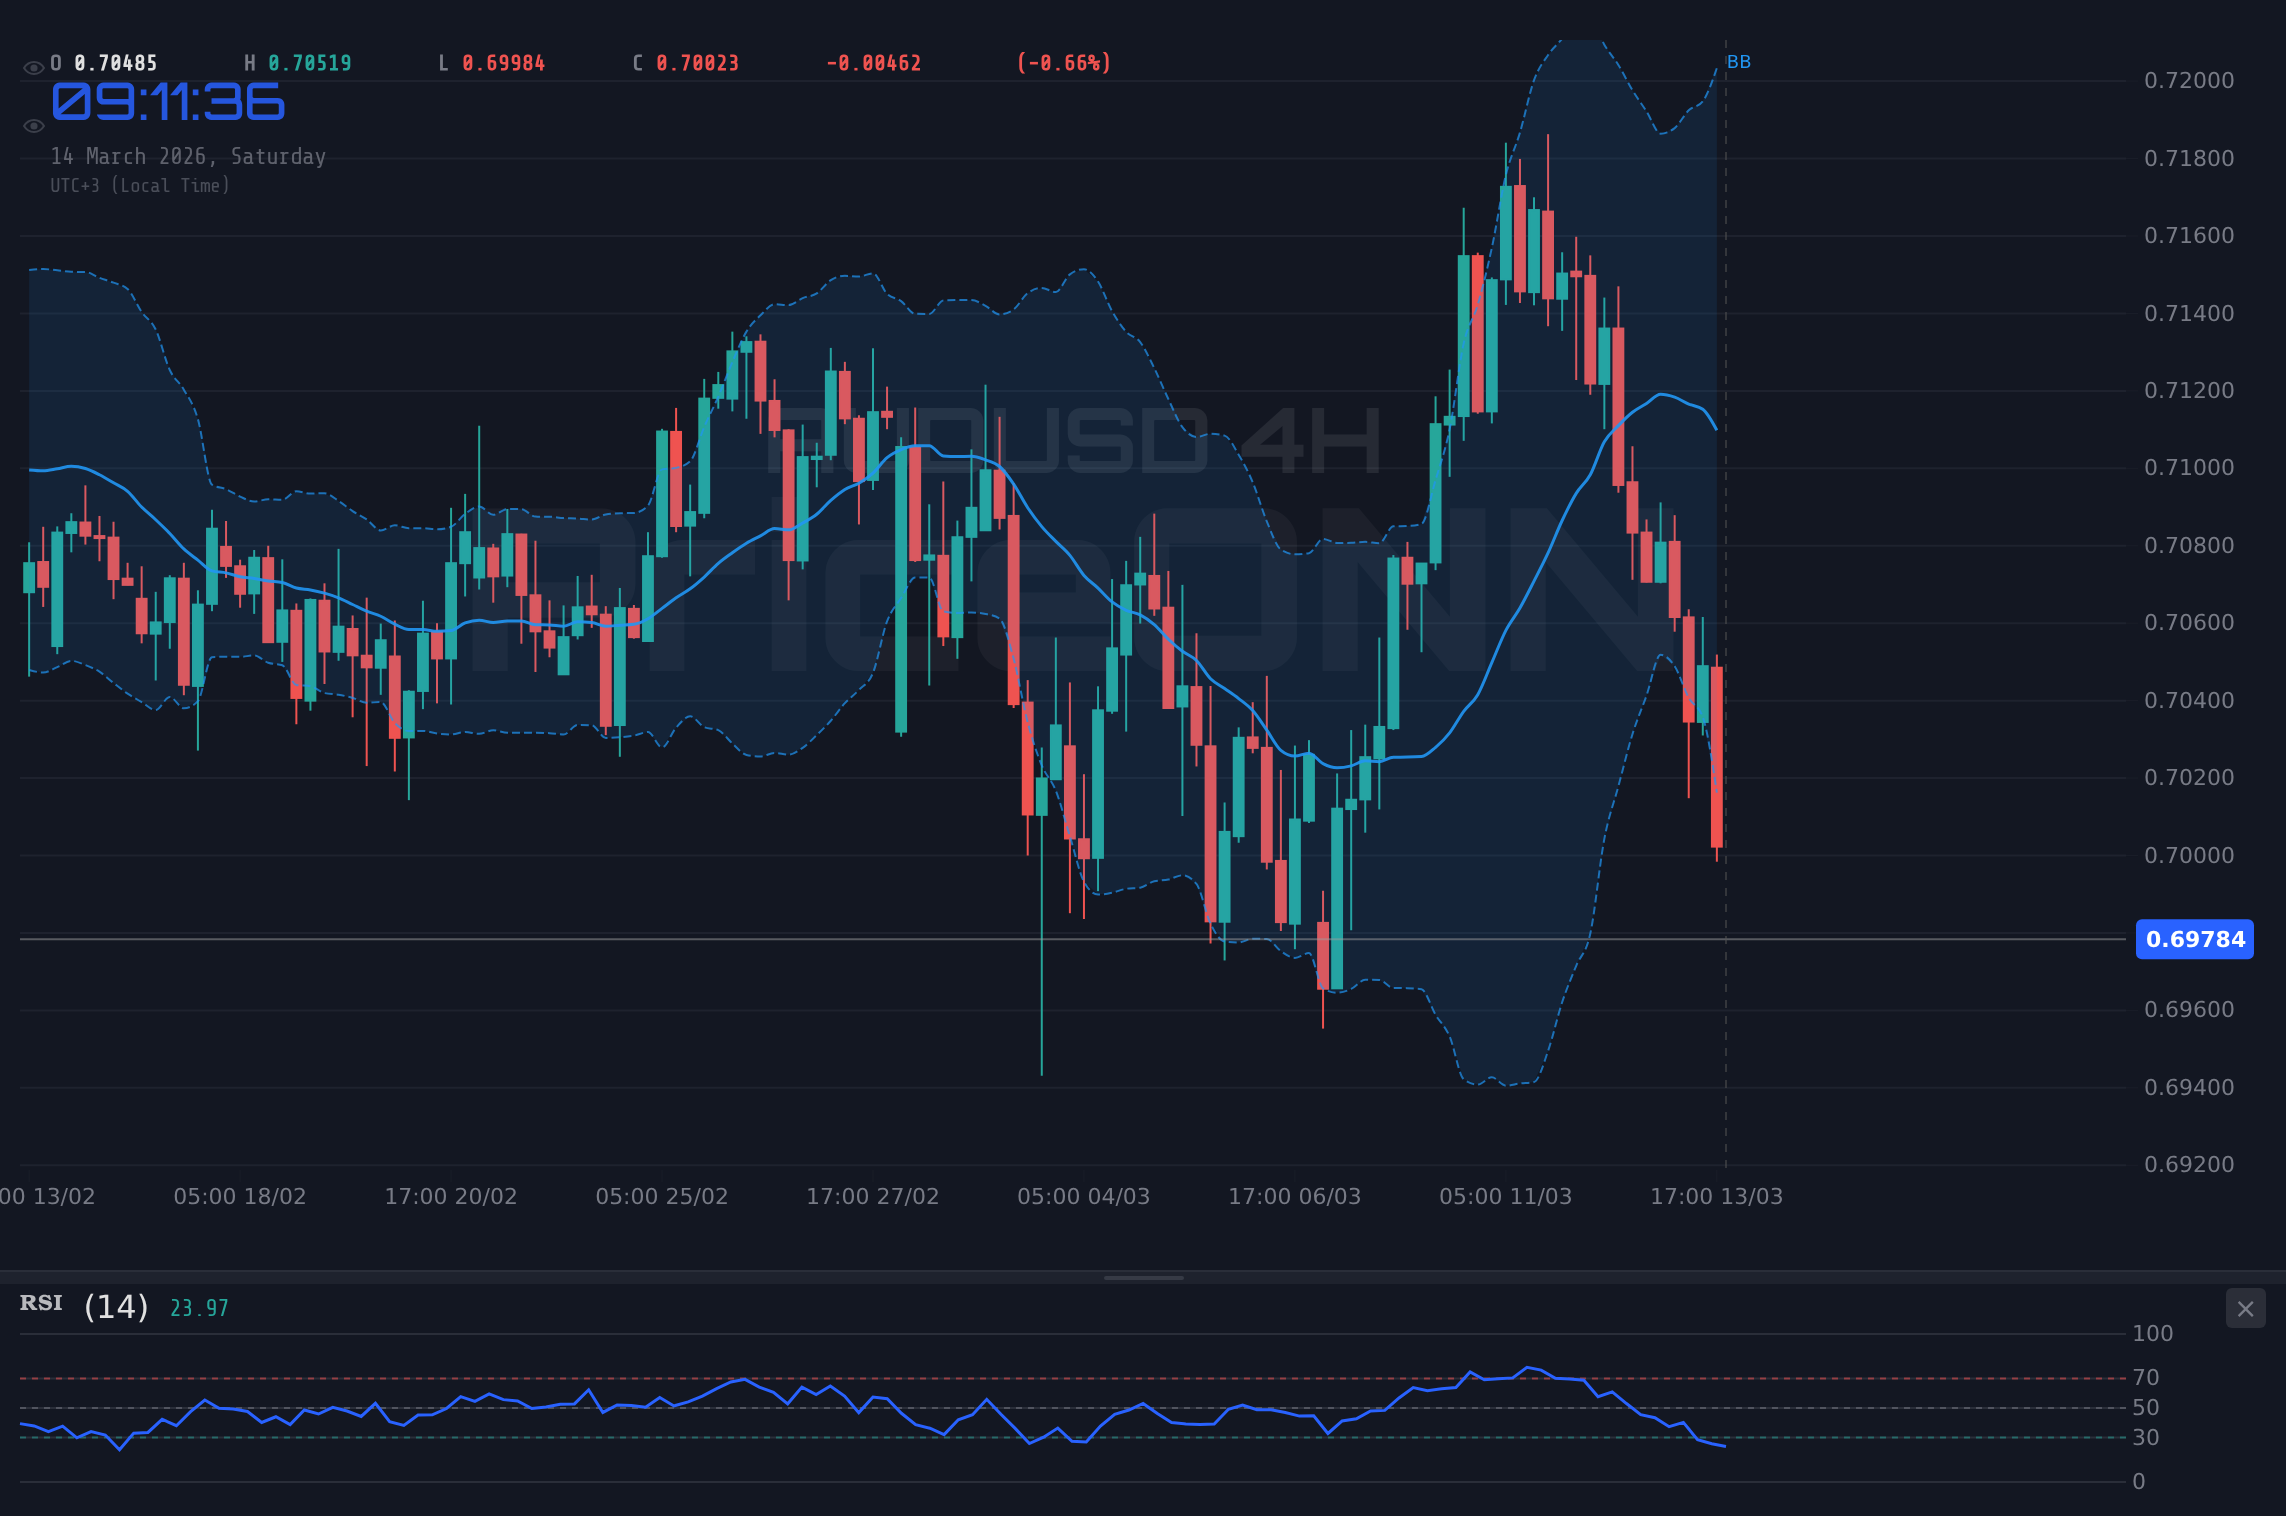
Stepping up to the 4-hour chart, the picture is a bit more nuanced. While the overall trend is neutral, the RSI at 36.14 still suggests downside momentum. The MACD is negative, and the price is trading below the middle Bollinger Band. Key support on this timeframe is 0.70021. The ADX at 22.32 indicates a moderate downtrend, so the bears still have some influence. The Stochastic at 13.53 is deeply oversold. We need to be cautious about calling a bottom here. I'd want to see some confirmation before getting overly bullish.
Zooming out to the daily timeframe, AUDUSD is also showing a neutral trend. However, the indicators are painting a slightly more bearish picture. The RSI at 44.81 suggests downside momentum, and the MACD is negative. The price is trading below the middle Bollinger Band, indicating bearish pressure. Key support on this timeframe is 0.70409. A break below this level could lead to a more significant sell-off. The ADX at 26.01 indicates a strong downtrend. I think the bears have a bit of an edge on this timeframe.
The RBA Rate Hike Wildcard
While the dollar's strength is undoubtedly a major factor, we can't ignore the potential impact of the Reserve Bank of Australia (RBA) and interest rate expectations. As highlighted in PriceONN's recent market news, there's growing speculation that the RBA might raise interest rates in March. This expectation has provided some support for the Aussie in recent weeks, but the question is, has the market already priced this in? If the RBA delivers a hawkish surprise, we could see a significant bounce in AUDUSD. However, if they hold steady or signal a more dovish stance, the downside could be substantial.
Economic Calendar: CPI Data on Deck
Looking ahead to next week, the economic calendar is relatively light, but the CPI data from the US will be a major focus. As the data shows, the previous CPI reading was 0.4%. If the upcoming data comes in higher than expected, it could further strengthen the dollar and put additional pressure on AUDUSD. On the other hand, a weaker-than-expected reading could provide some relief for the Aussie. Traders should also keep an eye on any news or announcements related to the RBA's rate decision. These events will likely dictate the direction of AUDUSD next week.
If AUDUSD can hold above 0.69861 (1H support), a bounce towards 0.70083 (1H resistance) is possible. A sustained break above this level could target 0.70327 (4H resistance).
A break below 0.69861 (1H support) could trigger a sell-off towards 0.69775. Further downside could target 0.69516 (1D support).
Trade Plan: Riding the Downtrend
Given the technical picture and the strength of the dollar, I'm leaning towards a bearish bias on AUDUSD. While the oversold conditions on the shorter timeframes suggest a potential bounce, the overall trend is still down, and the fundamentals are favoring the dollar. Here's a potential trade plan:
- Entry: Short AUDUSD on a break below 0.69861 (1H support)
- Target 1: 0.69775
- Target 2: 0.69516
- Stop/Invalidation: 0.70083
This trade setup offers a decent risk/reward ratio, but remember to manage your risk accordingly. The 1H Stochastic at 5.43 suggests that this trade will have some volatility. Also, the potential RBA rate hike expectations could throw a wrench into this plan, so be prepared to adjust your strategy accordingly. I would estimate this trade to have roughly a 60-65% probability of success, given the confluence of technical and fundamental factors.
Frequently Asked Questions: AUDUSD Analysis
What happens if AUDUSD breaks below 0.69861 support?
A break below the 0.69861 support level could trigger a sell-off towards the next support level at 0.69775. This scenario is supported by the negative MACD momentum on the 1H chart.
Should I short AUDUSD at current levels of $0.69811 given the RSI at 23.99?
While the RSI at 23.99 indicates oversold conditions, shorting at current levels is risky. A safer approach would be to wait for a break below 0.69861 to confirm the downtrend, with a stop-loss at 0.70083.
Is the negative MACD signal on the 4H chart a strong sell signal for AUDUSD?
The negative MACD on the 4H chart reinforces the bearish bias, but it's not a standalone signal. Combine it with other indicators and key levels, like the 0.70021 support, for a more comprehensive assessment.
How will the upcoming US CPI data affect AUDUSD this week?
Stronger-than-expected CPI data could further strengthen the dollar and push AUDUSD lower, potentially towards 0.69516. Conversely, weaker CPI data could provide some relief for the Aussie and trigger a bounce towards 0.70083.
The Bottom Line: Patience is Key
With the dollar flexing its muscles and the RBA's next move still uncertain, AUDUSD is facing a challenging environment. While I'm leaning bearish, I'm not advocating for blindly shorting the pair at current levels. Patience is key here. Wait for the break below 0.69861 to confirm the downtrend, and manage your risk accordingly. The market always gives a second chance, so don't feel pressured to jump in prematurely. The upcoming CPI data will be pivotal, so stay tuned and be prepared to adjust your strategy based on the data.
Technical Outlook Summary
| Indicator | Value | Signal |
|---|---|---|
| RSI (14) | 23.99 (1H) | Oversold |
| MACD Histogram | Negative (1H) | Bearish |
| Stochastic | 5.43 (1H) | Oversold |
| ADX | 41.57 (1H) | Strong Downtrend |
| Bollinger | Middle Band (1H) | Below |
Key Levels
Support Levels
Resistance Levels
Track markets in real-time
AI-powered analysis, technical indicators and real-time price data.
Join Our Telegram Channel
Breaking market news, AI analysis and trading signals instantly.
Join Channel