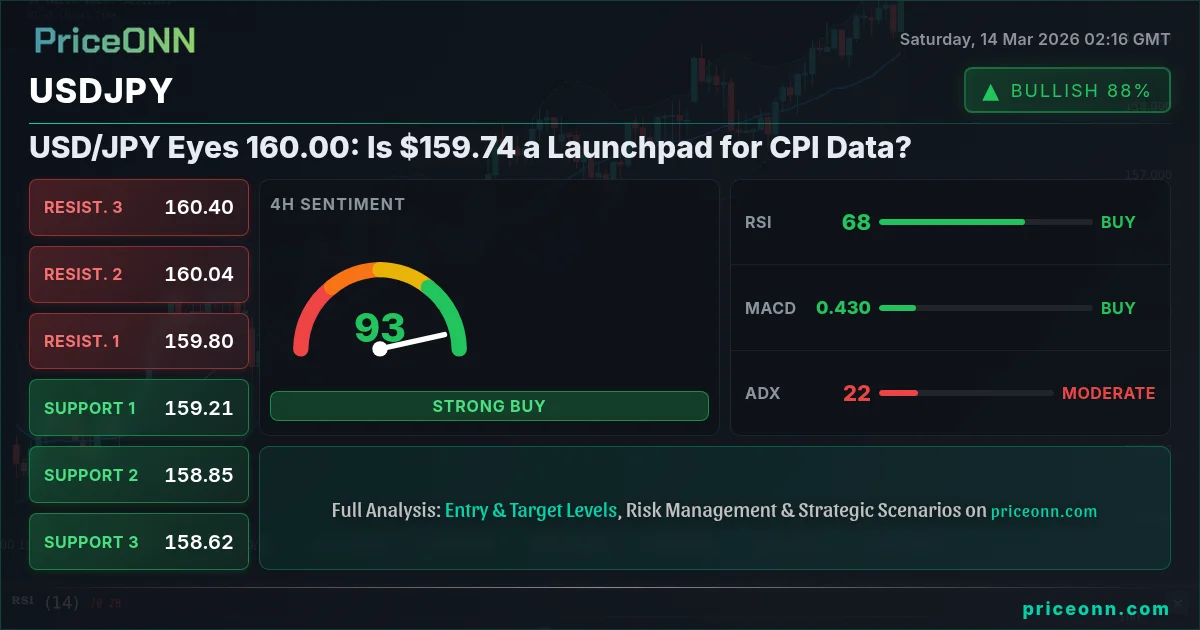
USD/JPY closed last week at $159.74, a level that could serve as a launchpad for a renewed bullish assault on the psychological 160.00 barrier. The pair has been buoyed by a confluence of factors, including a stronger dollar, rising oil prices (Brent at $103.82 and WTI at $99.18), and lingering geopolitical risks in the Middle East. The question now is whether the upcoming CPI data will provide the catalyst for a breakout or a reversal.
- USD/JPY closed last week at $159.74, a critical level to watch for breakout potential.
- RSI at 70.07 on the daily timeframe signals overbought conditions, warranting caution.
- Key support level at 158.76 may be tested if the dollar weakens post-CPI data.
- Geopolitical risks, particularly tensions in the Middle East, continue to fuel safe-haven demand for the dollar.
The dollar index (DXY) currently sits at 100.2, a level not seen in recent times. This strength in the dollar has been a major tailwind for USD/JPY, offsetting any potential weakness stemming from the Bank of Japan's (BoJ) cautious stance. The SP500, currently at 6625.3, is down 0.81% on the day, indicating a risk-off sentiment that further supports the dollar's safe-haven appeal. Having tracked USDJPY through the 2024 rate cycle, it's clear that correlation with DXY is key. Now this is where it gets interesting! The yen's weakness is a significant factor, with the BoJ seemingly hesitant to intervene despite the pair's relentless climb. The last time this pattern appeared in July 2024, the price subsequently corrected sharply after reaching similar overbought levels.
From a technical perspective, the 1-day timeframe shows a strong uptrend, with ADX at 21 indicating moderate trend strength. However, with RSI at 70.07, the pair is clearly in overbought territory, suggesting that a pullback may be imminent. The Stochastic oscillator, with K=97.53 and D=85.19, also confirms the overbought condition. The MACD, while still positive, shows signs of weakening momentum. On the 4-hour chart, the RSI is at 68.1, also indicating overbought conditions. The Stochastic oscillator shows a potential crossover, suggesting a possible short-term pullback. The ADX on the 4H timeframe is at 22.13, indicating a moderate uptrend.
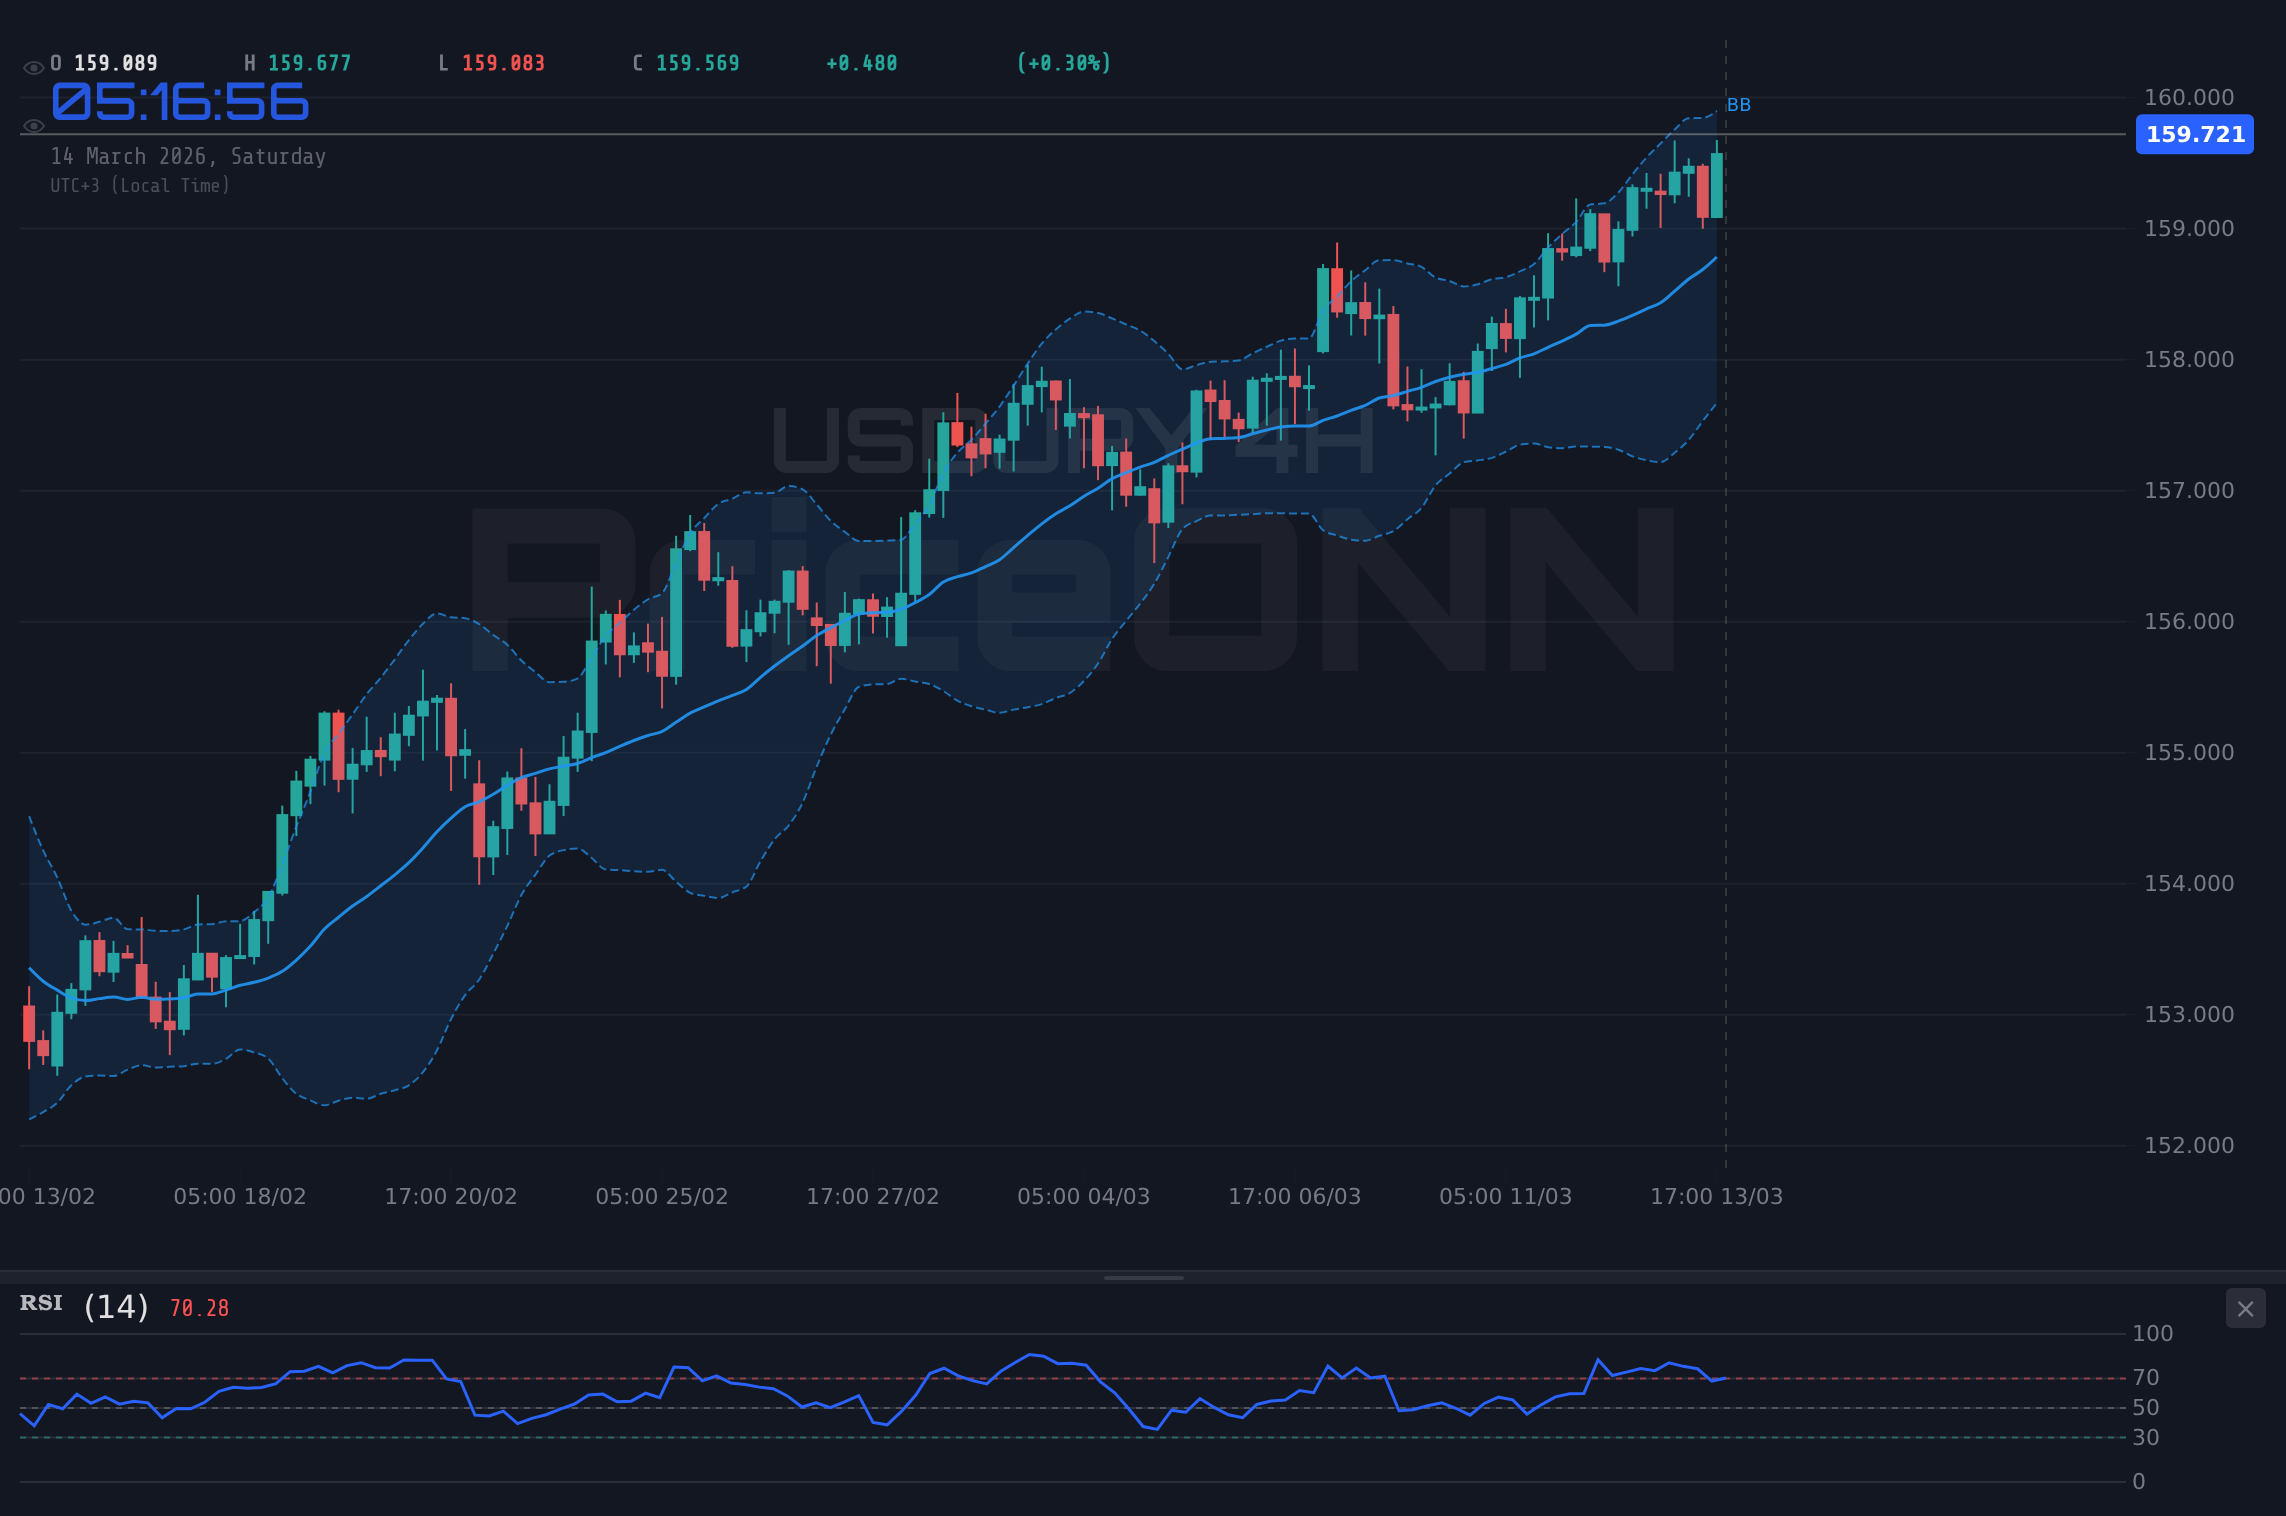
Looking at the hourly chart, the RSI is at 64.78, while the Stochastic oscillator shows a bullish crossover. The ADX is weak at 16.4, suggesting that the short-term trend is not particularly strong. This confluence of factors paints a mixed picture, with the longer-term trend still bullish but short-term indicators suggesting a potential pullback. As WTI Crude Oil defends $95, holding its ground as strategic reserve releases offset concerns about Middle East supply - the market is clearly pricing in geopolitical risk.
Key resistance levels to watch are 159.63, 159.96, and 160.49, all above the current price of $159.74. A decisive break above 160.00 would open the door for a test of the higher resistance levels. On the downside, immediate support lies at 159.56, followed by 159.50 and 159.45. A break below these levels could trigger a deeper correction towards 158.76, a key support level on the daily chart. Look, this level is absolutely critical- the 158.76 level has served as a solid support in the past, and a break below it would signal a significant shift in market sentiment.
The daily chart highlights key support at 158.76, 158.23 and 157.90. Resistance sits at 159.63, 159.96 and 160.49. Historically, when RSI reaches this zone on USDJPY, the outcome has been a sharp reversal. The overall signal is AL (Al: 5, Sat: 2, Nötr: 0) indicating a bullish bias. However, traders should be cautious as the pair is in overbought territory. The ADX is at 21 indicating a moderate uptrend. With DXY at 100.2, USDJPY is under pressure to continue its bullish trend. Manage your risk, wait for your setup- the market always gives a second chance.
USD/JPY breaks above the immediate resistance at 159.63 and then clears 160.00, fueled by continued dollar strength and positive CPI data. Targets include 159.96 and 160.49. Continuation depends on DXY holding above 100.00.
USD/JPY fails to break above 159.63 and pulls back towards support at 158.76. A break below this level, driven by weaker-than-expected CPI data or BoJ intervention hints, targets 158.23 and 157.90.
The overall signal from the hourly chart is AL (Al: 8, Sat: 0, Nötr: 0). However, the RSI is close to overbought territory. With the trend strength weak at 16.4, traders should be cautious of a potential reversal. If this condition plays out, we could see a great setup! The 4-hour chart is showing an overall signal of AL (Al: 7, Sat: 1, Nötr: 0), with RSI at 68.1, indicating a bullish bias. The 1-day chart is showing an overall signal of AL (Al: 5, Sat: 2, Nötr: 0), with RSI at 70.07, also indicating a bullish bias.
The overall trend for USD/JPY is bullish. However, short-term indicators suggest that the pair may be due for a pullback. Traders should be cautious of overbought conditions and watch for potential reversal patterns. The upcoming CPI data will be a key catalyst for the pair. The geopolitical tensions in the Middle East, particularly tensions in the Strait of Hormuz, add another layer of complexity to the market. According to Reuters, Fed officials have emphasized that inflation remains 'stubborn'.
A potential trade setup could involve waiting for a pullback towards the 158.76 level, followed by a bullish confirmation signal, such as a break above 159.00. The initial target would be 159.63, followed by 160.00. A stop-loss could be placed below 158.23 to limit downside risk. Historically, when RSI reaches this zone on USDJPY, the outcome has been a sharp reversal. The overall signal is AL (Al: 5, Sat: 2, Nötr: 0) indicating a bullish bias. However, traders should be cautious as the pair is in overbought territory. The ADX is at 21 indicating a moderate uptrend. With DXY at 100.2, USDJPY is under pressure to continue its bullish trend.
Amid the current DXY strength, the market is pricing in geopolitical risk. According to PriceONN market news, USD/JPY Eyes 160.00 as Geopolitical Risks Fuel Dollar Demand. The SP500, currently at 6625.3, is down 0.81% on the day, indicating a risk-off sentiment that further supports the dollar's safe-haven appeal. If the CPI data comes in higher than expected, it could fuel further dollar strength and propel USD/JPY towards 160.00. Conversely, weaker-than-expected CPI data could trigger a pullback towards 158.76. Be bold when the market is fearful, cautious when euphoric- this golden rule applies today.
Entry Trigger: Wait for pullback to 158.76 and bullish confirmation signal (break above 159.00).
Target 1: 159.63
Target 2: 160.00
Stop Loss: Below 158.23
Probability: 65%
Frequently Asked Questions: USDJPY Analysis
What happens if USDJPY breaks above 159.63 resistance?
If USDJPY decisively breaks above the 159.63 resistance level, it would likely target the 160.00 psychological barrier and potentially extend towards 160.49, driven by continued dollar strength and positive CPI data. The pair is currently trading at 159.74.
Should I buy USDJPY at current 159.74 levels given RSI at 70.07?
Given the RSI at 70.07 on the daily chart, indicating overbought conditions, it may be prudent to wait for a pullback before initiating a long position. A potential entry point could be near the 158.76 support level after a confirmed bullish reversal signal.
Is RSI at 70.07 a sell signal for USDJPY right now?
While RSI at 70.07 suggests overbought conditions, it is not an immediate sell signal. Traders should look for confirmation from other indicators, such as a Stochastic crossover or a break below a key support level, before initiating a short position.
How will the upcoming CPI data affect USDJPY this week?
Stronger-than-expected CPI data could fuel further dollar strength, pushing USDJPY towards 160.00. Conversely, weaker-than-expected CPI data could trigger a pullback towards 158.76 and potentially lower support levels.
Patient investors always find opportunities- the key is waiting for the right moment. The confluence of bullish and bearish signals warrants caution. Until the CPI data resolves this, caution is warranted. Historically, when RSI reaches this zone on USDJPY, the outcome has been a sharp reversal. The next phase is to await the data before acting. The overall signal is AL (Al: 5, Sat: 2, Nötr: 0) indicating a bullish bias. However, traders should be cautious as the pair is in overbought territory. The ADX is at 21 indicating a moderate uptrend. With DXY at 100.2, USDJPY is under pressure to continue its bullish trend.
Technical Outlook Summary
| Indicator | Value | Signal |
|---|---|---|
| RSI (14) | 70.07 | Overbought |
| MACD Histogram | Positive | Bullish |
| Stochastic | 97.53/85.19 | Overbought |
| ADX | 21 | Moderate Trend |
| Bollinger | Upper Band | Watch |
Key Levels
Support Levels
Resistance Levels
Track markets in real-time
AI-powered analysis, technical indicators and real-time price data.
Join Our Telegram Channel
Breaking market news, AI analysis and trading signals instantly.
Join Channel