The DowJones30 is currently locked in a battle between bulls and bears, hovering around the $46,502.50 level. After a week of mixed signals and growing uncertainty, the index is showing signs of weakness, prompting investors to reassess their positions ahead of key economic data releases next week. With the global economic landscape shifting and geopolitical tensions simmering, the Dow's performance is under scrutiny as market participants weigh the potential for further downside versus a possible rebound.
- DowJones30 retreats to $46,502.50 amid broad market sell-off driven by rising geopolitical tensions.
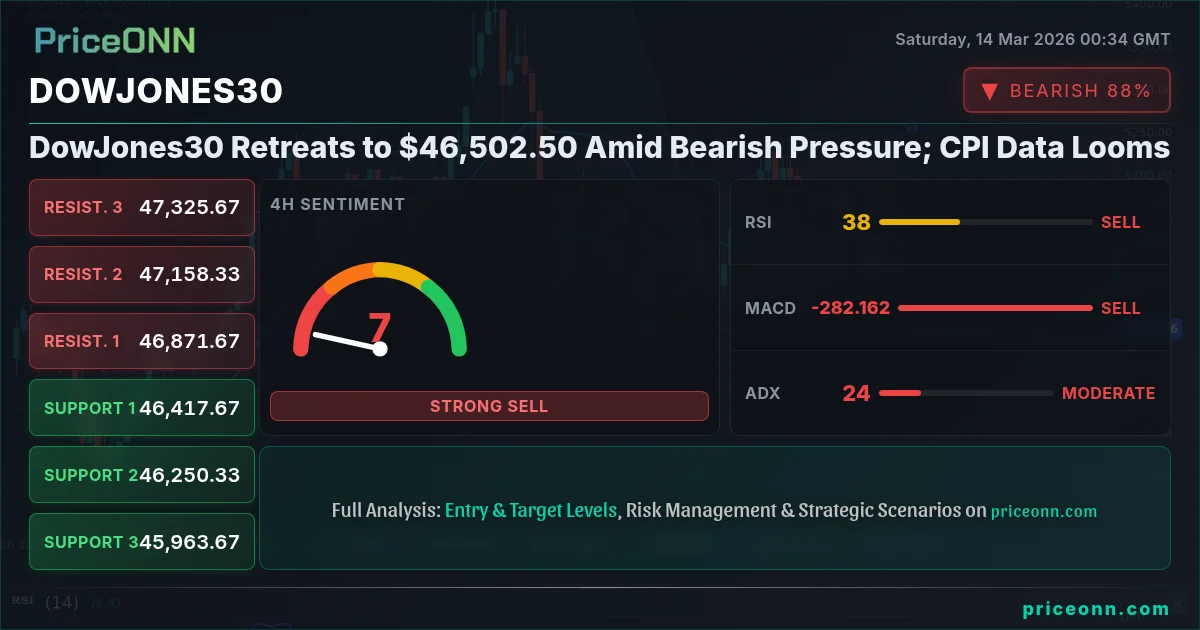
- Key support level at 46,485.67 is being tested, a break below could trigger further downside.
- RSI at 36.82 on the 1H chart suggests potential for further declines despite being near oversold conditions.
- Next week's CPI data will be a critical catalyst, potentially driving DowJones30 correlation with DXY.
The Bull Case for DowJones30: A Temporary Setback?
Despite the recent bearish pressure, there are arguments to be made for a potential rebound in the DowJones30. Historically, the index has shown resilience in the face of short-term volatility, often recovering swiftly after periods of decline. One factor supporting the bullish outlook is the possibility of a dovish shift in monetary policy. If upcoming economic data, particularly next week's CPI release, indicates a slowdown in inflation, the Federal Reserve may be inclined to ease its hawkish stance, providing a boost to risk assets like equities. From a technical perspective, the RSI on the daily chart, currently at 27.44, suggests that the Dow is nearing oversold territory, which could attract bargain hunters and trigger a short-term rally. Moreover, the MACD on the 1D timeframe is showing a potential for a bullish crossover. Additionally, strong earnings reports from key Dow components could also provide positive momentum and help to lift the index higher. The first support level is at 46,485.67, which needs to hold to prevent further downside.
The Bear Case for DowJones30: A Deeper Correction?
Conversely, the bearish scenario for the DowJones30 cannot be ignored. The index faces several headwinds that could lead to a more significant correction. Escalating geopolitical tensions, particularly in the Middle East, are fueling uncertainty and driving investors towards safe-haven assets. As reported by several news outlets, the rising tensions in the Strait of Hormuz are disrupting global oil supplies, leading to concerns about inflation and economic growth. The strong DXY, currently at 100.2, is adding further pressure on the Dow, as a stronger dollar typically weighs on the earnings of multinational corporations. Technically, the ADX on the 1D timeframe stands at 34.71, indicating a strong downtrend. The Stochastic K at 19.19 and D at 28.41 further confirm the downward momentum. A break below the immediate support at 46,485.67 could open the door for a test of the next support level at 46,243.33. The overall signal is currently a 'Sell' based on multiple timeframes.
Technical Analysis: Bulls vs. Bears at a Critical Juncture
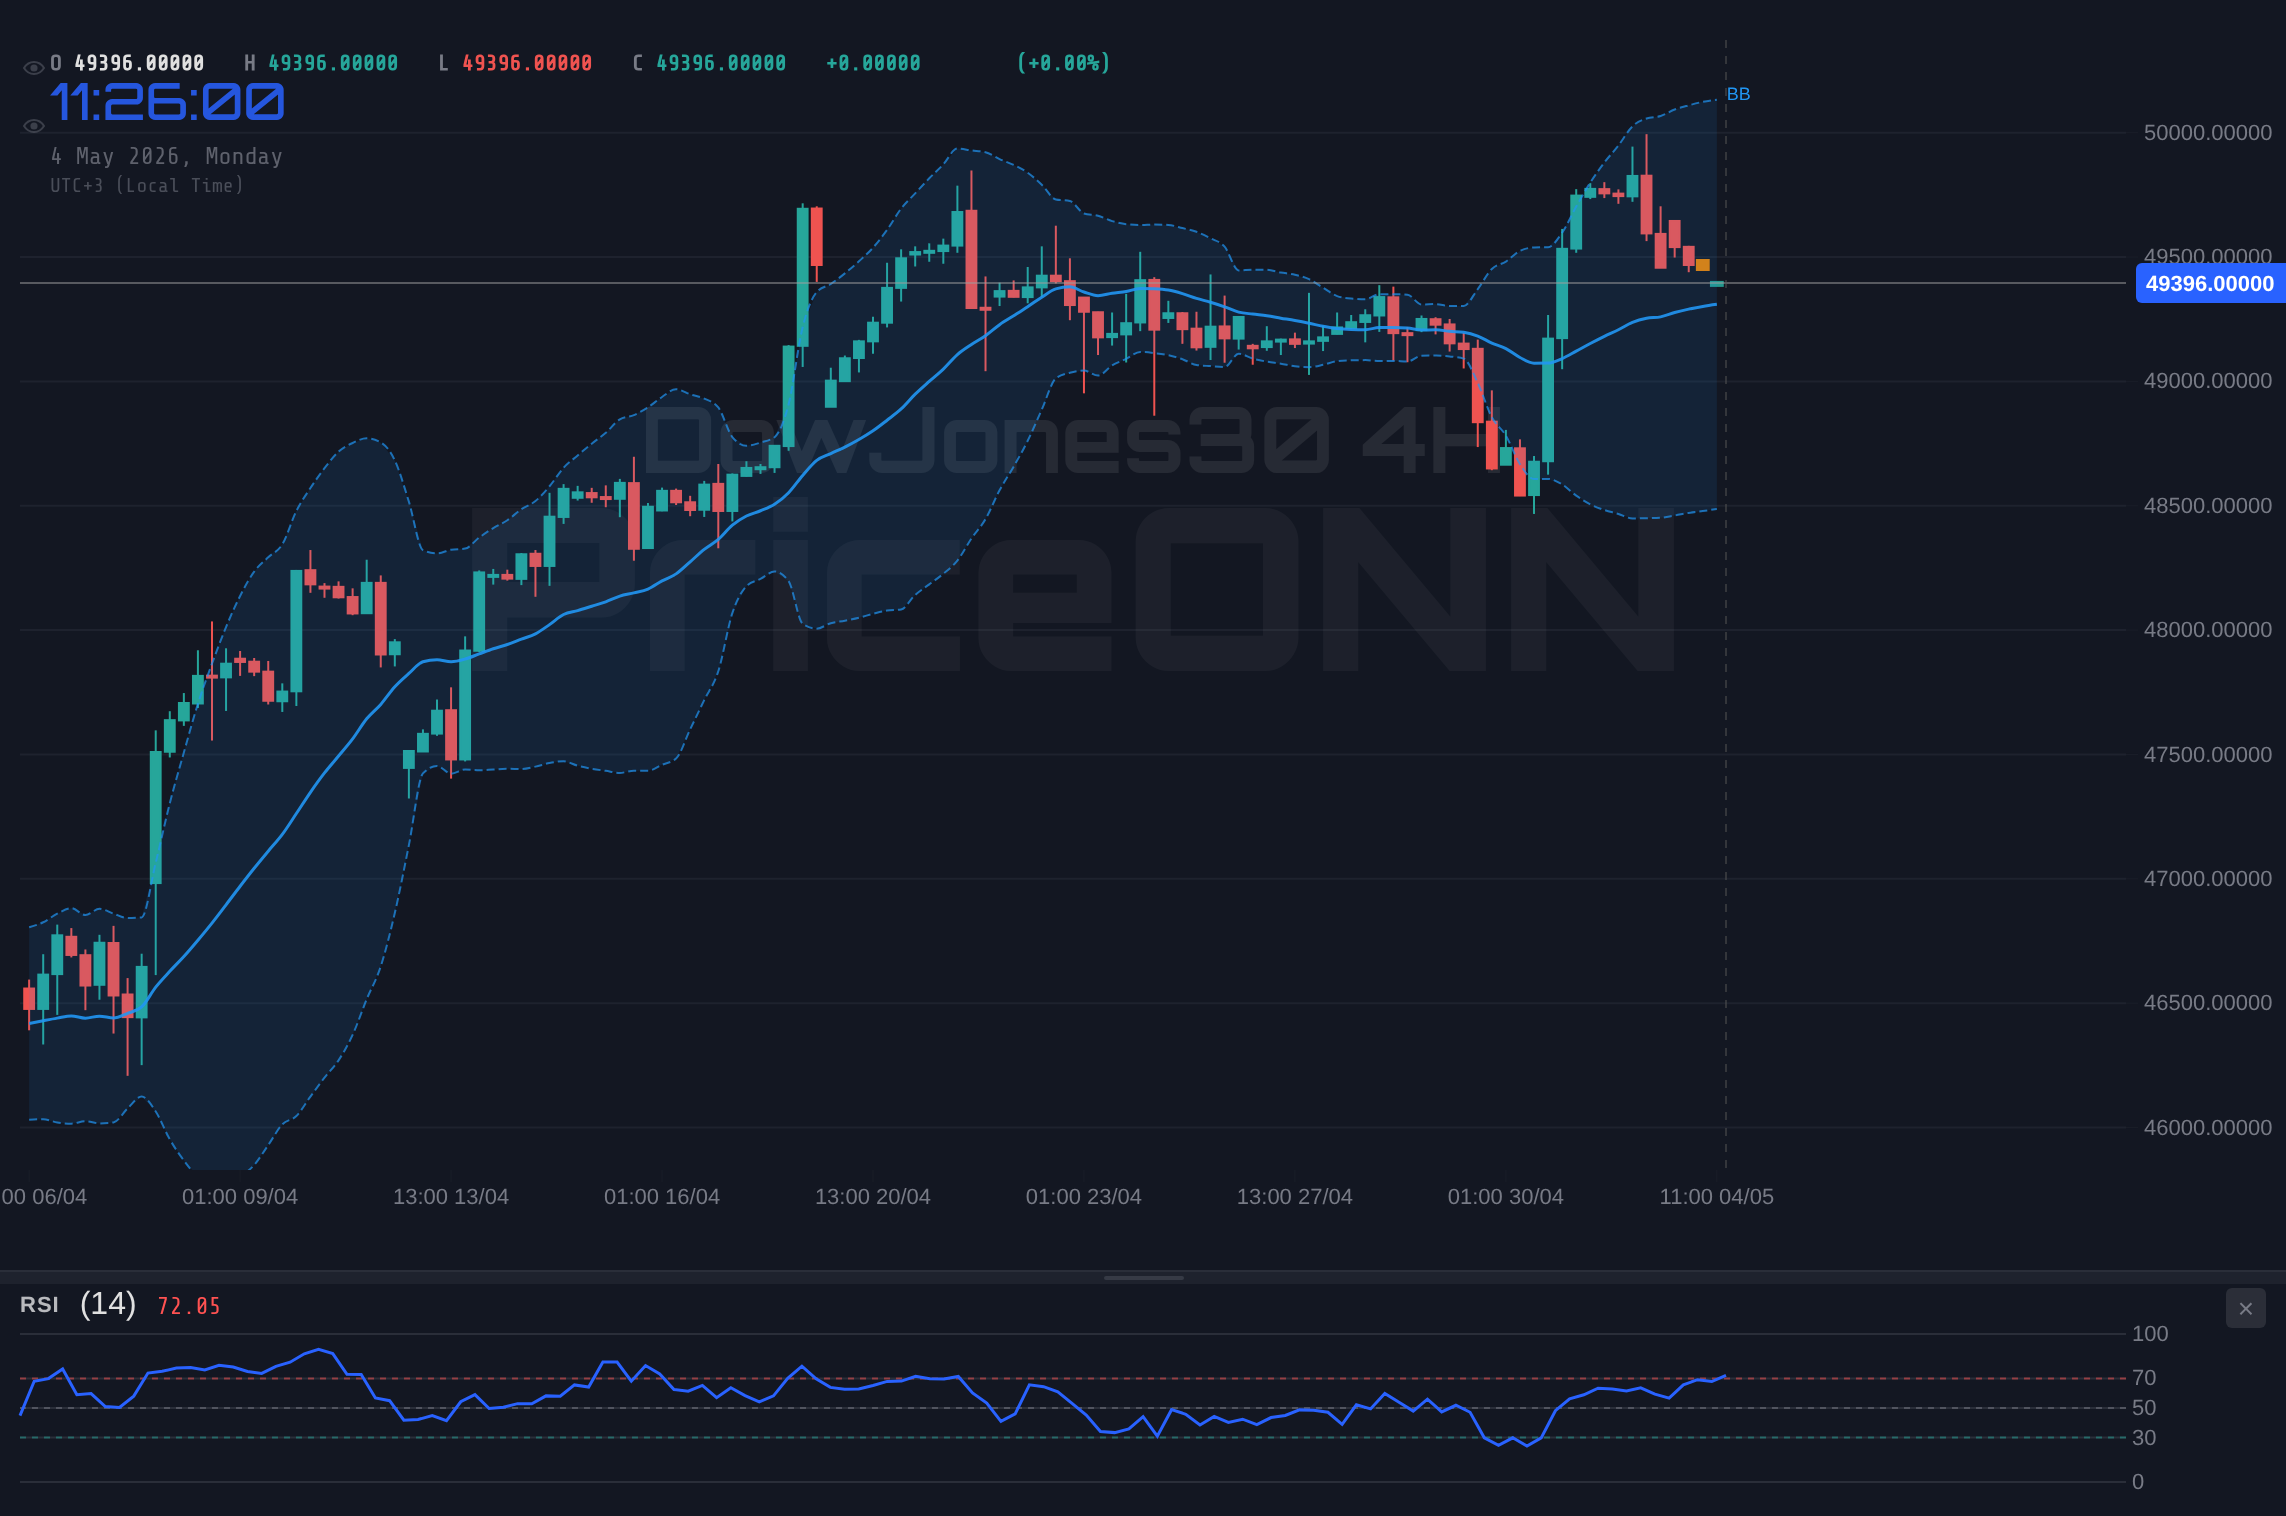
The technical picture for the DowJones30 presents a mixed bag of signals, reflecting the ongoing tug-of-war between bulls and bears. On the hourly chart, the RSI at 36.82 indicates that the index is approaching oversold conditions, suggesting a potential for a short-term bounce. However, the MACD histogram remains negative, signaling continued bearish momentum. The ADX on the hourly chart is relatively weak at 19.63, indicating a lack of strong trend strength, which means the index could move in either direction. The key support level to watch on the hourly chart is 46,509.33, while the immediate resistance lies at 46,720.67. A break above the resistance could signal a shift in momentum, while a break below the support could confirm the bearish trend. On the 4-hour chart, the RSI at 37.64 is also neutral, while the MACD remains negative. The ADX at 24 suggests a moderate downtrend, further supporting the bearish bias. The Stochastic K at 35.24 recently crossed above the D at 22.09, indicating some potential for a short-term recovery.
Looking at the daily timeframe, the picture is decidedly bearish. The RSI at 27.44 suggests that the Dow is oversold, but the strong downtrend indicated by the ADX at 34.71 suggests that the selling pressure could continue. The MACD is negative and trending lower, further confirming the bearish bias. The Stochastic K at 19.19 remains below the D at 28.41, indicating continued downward momentum. The key support level to watch on the daily chart is 46,485.67, while the immediate resistance lies at 47,145.67. The overall signal on the 1D timeframe is a 'Sell'.
Key Levels
Support Levels
Resistance Levels
DowJones30 Trade Plan: Navigating the Uncertainty
Given the mixed signals and the upcoming CPI data release, a cautious approach is warranted when trading the DowJones30. However, a well-defined trade plan can help to navigate the uncertainty and potentially profit from the volatility.
If the DowJones30 breaks above the resistance at 47,145.67, it could signal a shift in momentum and the start of a new uptrend. The initial target would be 47,563.33, followed by 47,805.67. This scenario is contingent on positive earnings reports and a dovish shift in monetary policy.
If the DowJones30 breaks below the support at 46,485.67, it could confirm the bearish trend and lead to further downside. The initial target would be 46,243.33, followed by 45,825.67. This scenario is contingent on escalating geopolitical tensions and a hawkish Federal Reserve.
Technical Outlook Summary
| Indicator | Value | Signal |
|---|---|---|
| RSI (14) | 36.82 | Neutral |
| MACD Histogram | Negative | Bearish |
| Stochastic | 11.21/34.32 | Bearish |
| ADX | 19.63 | Weak |
| Bollinger | Middle Band | Watch |
Navigating the DowJones30: Key Events to Watch
In addition to the technical factors, several key events could influence the DowJones30's performance in the coming days. The most important event to watch is next week's CPI data release. A higher-than-expected CPI reading could fuel concerns about inflation and prompt the Federal Reserve to maintain its hawkish stance, putting downward pressure on the Dow. Conversely, a lower-than-expected CPI reading could ease inflation concerns and prompt the Fed to ease its monetary policy, providing a boost to the index. In addition to the CPI data, investors should also pay attention to other economic data releases, such as the GDP and employment numbers, as well as any geopolitical developments that could impact market sentiment.
Frequently Asked Questions: DowJones30 Analysis
What happens if DowJones30 breaks below 46,485.67 support?
A break below the 46,485.67 support could confirm the bearish trend, potentially triggering a sell-off towards the next support level at 46,243.33. This scenario is contingent on escalating geopolitical tensions and a hawkish Federal Reserve.
Should I sell DowJones30 at current levels given RSI at 36.82?
While the RSI at 36.82 suggests the DowJones30 is approaching oversold conditions on the 1H chart, the MACD histogram remains negative. It is crucial to watch the support level at 46,485.67. If that level breaks, a short position could be considered.
Is the negative MACD signal on the 1D timeframe a reliable sell signal for DowJones30?
The negative MACD signal on the 1D timeframe indicates bearish momentum. However, it's important to consider the RSI at 27.44, which suggests oversold conditions. This conflicting signal calls for caution, and a break below the 46,485.67 level would add confirmation.
How will next week's CPI data affect DowJones30?
Next week's CPI data is a critical catalyst. A higher-than-expected CPI reading could reinforce the Fed's hawkish stance, putting downward pressure on the DowJones30. Conversely, a lower-than-expected reading could lead to a dovish shift, providing a boost to the index.
Track markets in real-time
AI-powered analysis, technical indicators and real-time price data.
Join Our Telegram Channel
Breaking market news, AI analysis and trading signals instantly.
Join Channel