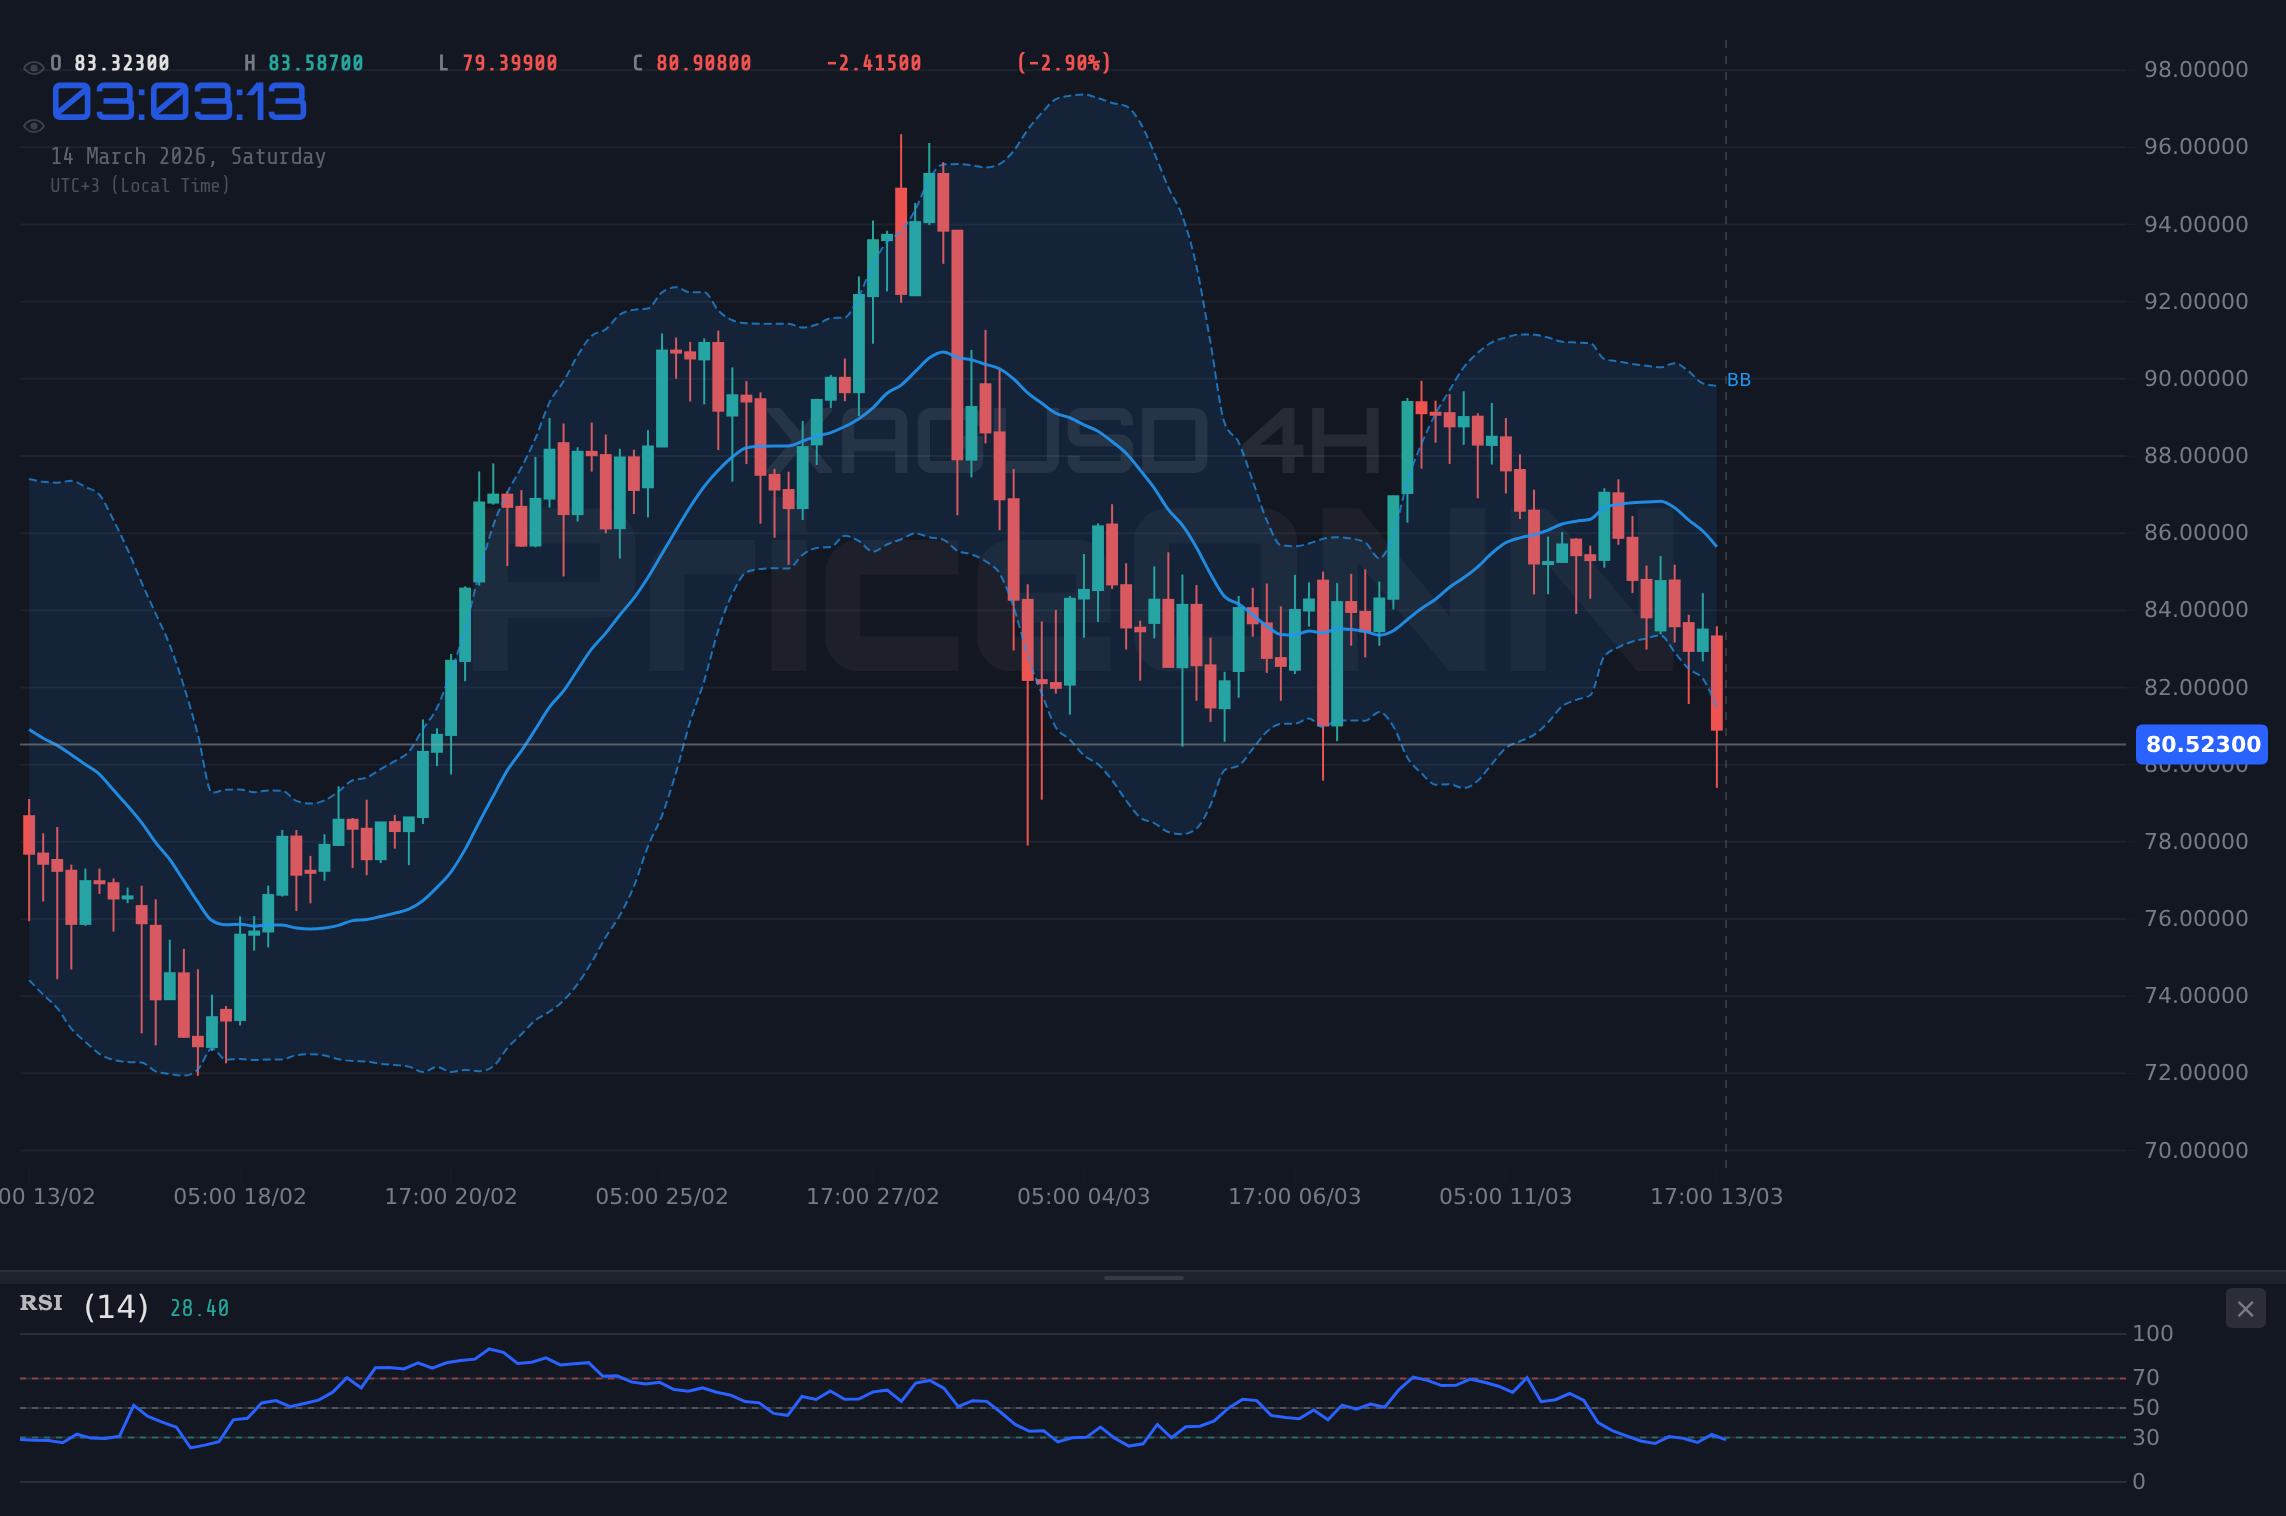
XAGUSD는 현재 80.58달러에 거래되고 있으며, 미국 달러 지수가 지정학적 리스크 속에서 강세를 보이면서 매수 세력과 매도 세력 간의 싸움이 치열해지고 있습니다. 핵심 질문은 은이 중요한 지지선 위로 유지될 수 있는지, 아니면 달러 강세가 추가 하락을 이끌 것인지입니다. 중동의 지정학적 긴장은 달러 수요를 부채질하고 있습니다. 이번 주말 분석에서는 다음 주 XAGUSD의 방향을 결정할 주요 이벤트, 기술적 레벨 및 경제 데이터에 초점을 맞춥니다. 오늘 은 가격 분석에 따르면, 변동성이 커지고 있습니다.
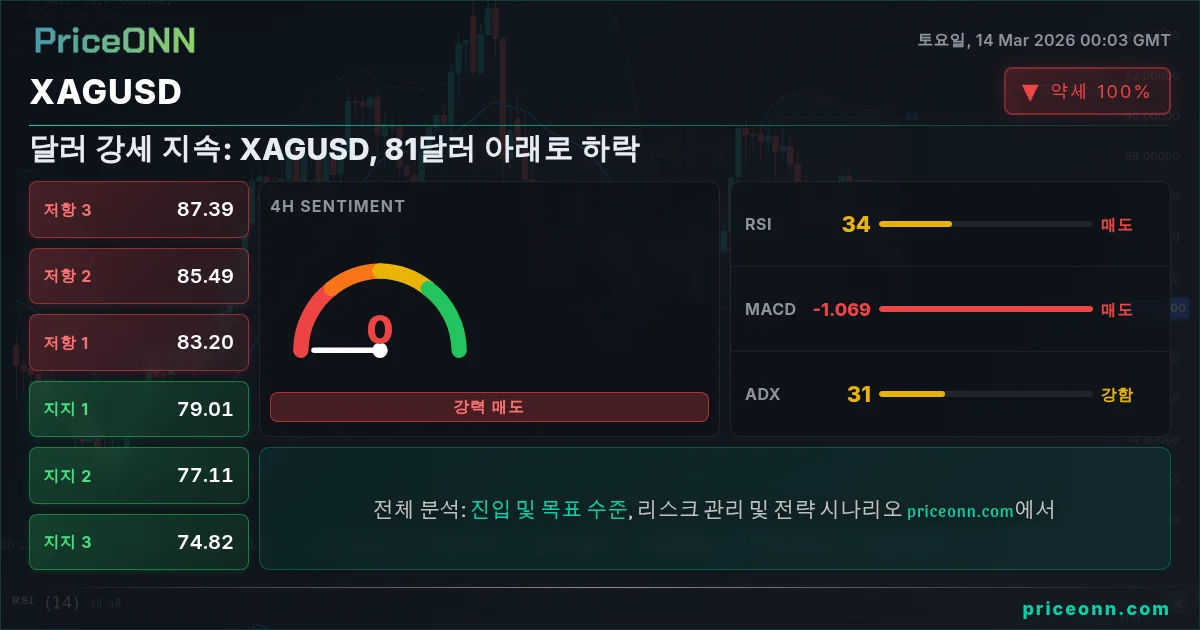
달러 강세 속 XAGUSD 약세 전망
XAGUSD의 약세 전망은 주로 미국 달러 강세에 의해 주도됩니다. 달러 지수(DXY)가 10개월 최고치를 향해 상승함에 따라 은은 상당한 역풍에 직면하고 있습니다. 현재 DXY 레벨은 100.2이며, 이는 XAGUSD에 하락 압력을 가하고 있습니다. 중동의 지정학적 긴장 고조는 안전 자산으로서의 달러 수요를 더욱 부채질하여 은에 대한 압력을 가중시키고 있습니다. PriceONN 시장 뉴스에 따르면 "달러 강세 지속으로 은 81달러 아래로 하락"했습니다. 기술적 관점에서 4시간 차트는 ADX가 29.13으로 강한 하락 추세를 보여주며, 이는 약세 모멘텀이 지속될 가능성이 높다는 것을 나타냅니다. RSI는 33.84로 금속이 과매도 상태에 도달하기 전에 여전히 하락할 여지가 있음을 시사합니다.
또한 MACD 히스토그램은 약세 모멘텀을 보여주어 약세 심리를 더욱 강화합니다. 4시간 차트의 Stochastic 지표는 K=23.84 및 D=25.1을 보여주며, 지속적인 하락 추세를 나타냅니다. 또한 1일 차트는 가격이 볼린저 밴드의 중간 밴드 아래에 있음을 보여주며, 이는 약세 추세를 시사합니다. XAGUSD에 대한 전체적인 신호는 매도이며, 8개의 지표 중 8개가 약세 전망을 가리키고 있습니다. 80.32달러 지지선 아래로 하락하면 더 낮은 목표를 향한 급격한 하락이 촉발될 수 있습니다.
XAGUSD 강세 전망 - 잠재적 반전?
지배적인 약세 심리에도 불구하고 XAGUSD의 강세 반전을 뒷받침할 수 있는 요인이 있습니다. 잠재적인 촉매제 중 하나는 1시간 차트에서 RSI가 33.11로 나타내는 과매도 상태입니다. 이는 트레이더들이 Short 포지션에서 이익을 실현함에 따라 단기 반등의 가능성을 시사할 수 있습니다. 1시간 차트의 Stochastic 지표는 K=28.08 및 D=24.91을 보여주며, 잠재적인 강세 교차를 나타냅니다. 또한 지정학적 긴장은 현재 달러를 지지하고 있지만 상황이 더욱 악화되면 안전 자산으로서의 은 수요를 촉진할 수도 있습니다. WTI 원유가 IEA 비축량 방출로 지정학적 긴장의 균형을 맞추면서 95달러를 방어하고 있다는 소식은 인플레이션 가능성을 시사할 수도 있으며, 이는 인플레이션 헤지로서 은을 지지할 수 있습니다.
또한 80.32달러 지지선은 여러 번 테스트되었으며, 이는 유지될 수 있고 잠재적인 랠리를 위한 기반을 제공할 수 있음을 시사합니다. XAGUSD가 1시간 차트에서 81.22달러 저항선 위로 돌파할 수 있다면 모멘텀의 변화를 알리고 매수자를 유치할 수 있습니다. 펀더멘털 관점에서 달러 약세 또는 지정학적 긴장 완화의 징후는 은 가격에 상승 동력을 제공할 수 있습니다. 그러나 강세 전망은 강한 약세 모멘텀을 극복하고 주요 저항선 위로 돌파하는 데 달려 있습니다.
기술적 분석: 80.58달러에서 매수 세력 vs 매도 세력
XAGUSD에 대한 기술적 그림은 강세 신호와 약세 신호가 혼합되어 있습니다. 1시간 차트에서 추세는 약세이며 강도는 95%이고 가격은 볼린저 밴드의 중간 밴드 아래에 있습니다. RSI는 33.11로 과매도 상태를 시사하는 반면 MACD 히스토그램은 약세 모멘텀을 보여줍니다. Stochastic 지표는 잠재적인 강세 교차를 나타내지만 ADX는 40.31로 강한 하락 추세를 나타냅니다. 4시간 차트에서 추세는 중립적이며 가격은 볼린저 밴드의 중간 밴드 아래에 있습니다. RSI는 33.84로 추가 하락 가능성을 시사하는 반면 MACD 히스토그램은 약세 모멘텀을 보여줍니다. Stochastic 지표는 지속적인 하락 추세를 나타내고 ADX는 29.13으로 강한 하락 추세를 나타냅니다.
1일 차트에서 추세는 약세이며 강도는 88%이고 가격은 볼린저 밴드의 중간 밴드 아래에 있습니다. RSI는 45.41로 추가 하락 가능성을 시사하는 반면 MACD 히스토그램은 약세 모멘텀을 보여줍니다. Stochastic 지표는 지속적인 하락 추세를 나타내고 ADX는 15.12로 약한 추세를 나타냅니다. 전반적으로 기술적 그림은 현재 매도 세력이 통제하고 있지만 1시간 차트의 과매도 상태는 단기 반등으로 이어질 수 있음을 시사합니다. 주시해야 할 주요 레벨은 80.32달러 지지선과 81.22달러 저항선입니다.
경제 캘린더 및 시장 기대
경제 캘린더는 다음 주 XAGUSD의 방향을 결정하는 데 중요한 역할을 할 것입니다. 투자자들은 2026-03-11 (수)에 발표될 [USD] 데이터를 면밀히 주시할 것입니다. 이러한 데이터의 모든 서프라이즈는 달러와 결과적으로 은 가격에 상당한 변동성을 유발할 수 있습니다. 데이터가 예상보다 강하게 나오면 달러를 더욱 강화하고 XAGUSD에 하락 압력을 가할 수 있습니다. 반대로 예상보다 약한 데이터는 달러를 약화시키고 은에 상승 동력을 제공할 수 있습니다. 2026-03-13 (금)에 발표될 [GBP] 데이터도 전체적인 시장 심리와 위험 선호도에 영향을 미칠 수 있으므로 면밀히 주시할 것입니다. 트레이더는 중동의 긴장 고조가 달러와 은 모두에 대한 안전 자산 수요를 촉진할 수 있으므로 지정학적 발전에 주목해야 합니다.
거래 계획: 약세 파도 타기
지배적인 약세 심리와 기술 지표가 나타내는 강한 하락 추세를 감안할 때 Short 거래 설정이 XAGUSD에 대한 가장 가능성이 높은 시나리오로 보입니다. 그러나 위험을 관리하고 거래를 시작하기 전에 명확한 진입 트리거를 기다리는 것이 중요합니다.
XAGUSD가 80.32달러 지지선 아래로 하락하면 Short 진입. 목표 1은 80.17달러입니다. 목표 2는 77.66달러입니다. 전체적인 추세는 약세이고 달러는 강세를 보이고 있습니다. 이 시나리오의 확률은 65%입니다.
XAGUSD가 81.22달러 저항선 위로 돌파하면 Long 진입. 목표 1은 81.48달러입니다. 목표 2는 82.07달러입니다. 현재 달러 강세를 감안할 때 이 시나리오는 가능성이 낮습니다. 이 시나리오의 확률은 35%입니다.
진입 트리거: XAGUSD가 80.32달러 아래로 하락하면 Short 진입. 이는 약세 모멘텀을 확인하고 거래를 시작하기 위한 명확한 신호를 제공합니다.
목표 1: 80.17달러. 이는 진입 트리거 아래의 첫 번째 지지선이며 이익 실현을 위한 가능성이 높은 영역입니다.
목표 2: 77.66달러. 이는 은 가격의 더 깊은 하락 가능성을 기반으로 한 더 야심찬 목표입니다.
스톱/무효화 레벨: 81.22달러. 예상치 못한 상승으로부터 보호하기 위해 이 레벨 위에 스톱-로스 주문을 설정합니다. 가격이 이 레벨 위로 돌파하면 모멘텀의 변화를 알리고 약세 거래 설정을 무효화할 수 있습니다.
확률 평가: 강한 약세 모멘텀과 달러 강세를 감안할 때 이 거래 설정은 성공 확률이 높습니다(65%). 그러나 위험을 관리하고 잠재적인 변동성에 대비하는 것이 중요합니다.
자주 묻는 질문: XAGUSD 분석
XAGUSD가 80.32달러 지지선 아래로 하락하면 어떻게 되나요?
XAGUSD가 80.32달러 지지선 아래로 하락하면 더 낮은 목표를 향한 급격한 하락이 촉발될 수 있습니다. 첫 번째 목표는 80.17달러이고 그 다음은 77.66달러입니다.
4시간 차트에서 RSI가 33.84인 현재 레벨 80.58달러에서 XAGUSD를 매수해야 할까요?
RSI가 33.84로 과매도 상태를 시사하지만 이는 명확한 매수 신호가 아닙니다. 전체적인 추세는 약세이고 달러는 강세를 보이고 있습니다. Long 포지션을 시작하기 전에 명확한 강세 반전 신호를 기다리는 것이 신중합니다.
MACD 히스토그램의 음수 모멘텀은 XAGUSD에 대한 매도 신호인가요?
예, MACD 히스토그램의 음수 모멘텀은 약세 심리를 강화하고 하락 추세가 지속될 가능성이 높다는 것을 시사합니다. 매도 신호이지만 위험을 관리하고 명확한 진입 트리거를 기다리는 것이 중요합니다.
2026-03-11 (수)에 발표될 [USD] 데이터는 이번 주 XAGUSD에 어떤 영향을 미칠까요?
[USD] 데이터가 예상보다 강하게 나오면 달러를 더욱 강화하고 XAGUSD에 하락 압력을 가할 수 있습니다. 반대로 예상보다 약한 데이터는 달러를 약화시키고 은에 상승 동력을 제공할 수 있습니다.
위험/보상 분석
Short 거래 설정에 대한 위험/보상 비율은 유리합니다. 거래에서 얻을 수 있는 잠재적 이익은 잠재적 손실보다 훨씬 높으므로 위험을 감수하려는 트레이더에게 매력적인 기회입니다. 그러나 위험을 관리하고 잠재적인 변동성에 대비하는 것이 중요합니다.
기술적 전망 요약
| 지표 | 값 | 신호 |
|---|---|---|
| RSI (14) | 45.41 | 약세 |
| MACD 히스토그램 | 음수 | 약세 |
| Stochastic | 31.46/39.41 | 약세 |
| ADX | 15.12 | 약한 추세 |
| Bollinger | 중간 밴드 | 약세 |