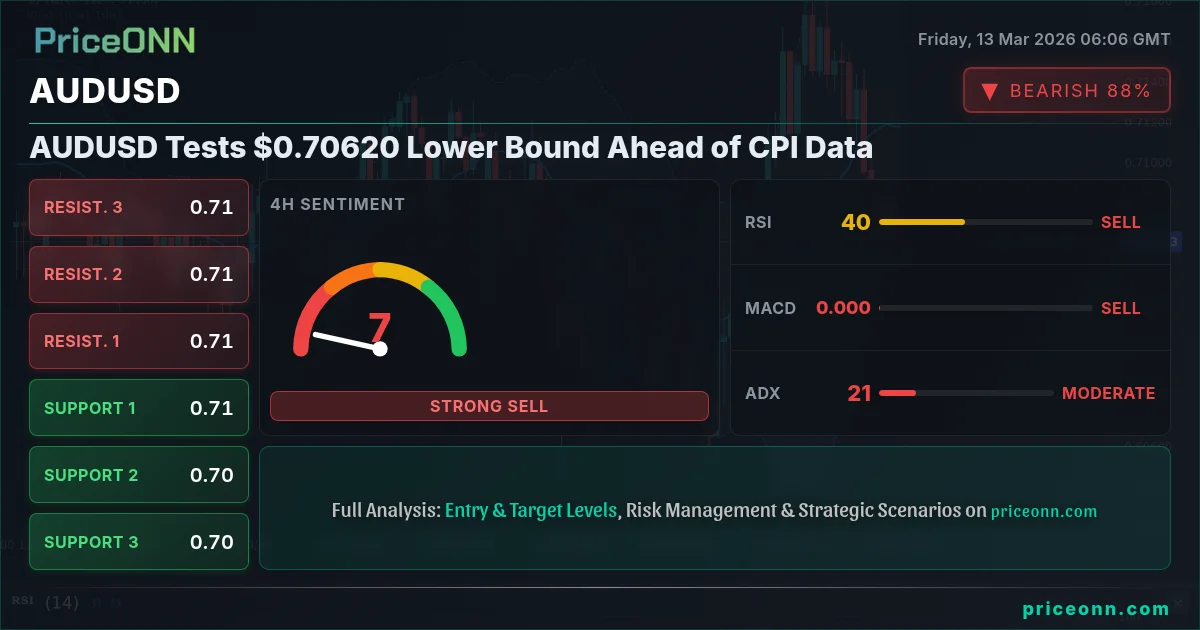
AUDUSD is currently trading near the $0.70620 level, facing downward pressure as the market anticipates upcoming CPI data releases. This level is critical for the Aussie, and a break below could signal further declines.
- RSI at 28.37 on the 1H chart signals oversold conditions, potentially leading to a short-term bounce.
- Key support lies at 0.70563, tested multiple times, with a break opening the door to further losses.
- MACD histogram shows negative momentum, indicating bearish pressure remains dominant.
- DXY strength is weighing on AUDUSD, correlated to the dollar index's recent gains.
The Australian dollar is under pressure against the US dollar, currently finding itself near the lower end of its recent trading range. The AUDUSD pair is hovering around $0.70620, and market participants are keenly watching for a potential breakout or breakdown. The strength of the US dollar, as indicated by the DXY's upward trajectory to 99.61, is contributing to the downward pressure on AUDUSD. This inverse correlation between the dollar index and AUDUSD is a key factor influencing the pair's movements. The DXY's rise suggests increased demand for the US dollar as a safe-haven asset, potentially driven by global economic uncertainties or geopolitical tensions, as recently highlighted by escalating tensions in the Middle East.
Technical Analysis of AUDUSD
A multi-timeframe analysis of AUDUSD reveals a mixed picture. On the 1-hour chart, the trend is bearish, with a strength of 99%, indicated by the ADX at 28.7. The RSI(14) is at 28.37, signaling oversold conditions, which might lead to a short-term rebound. However, the MACD histogram is negative, suggesting that bearish momentum is still in play. The Stochastic indicator also points to a downtrend, with %K less than %D. Key support on this timeframe lies at 0.70563, a level that has been tested multiple times. A break below this support could trigger further declines.
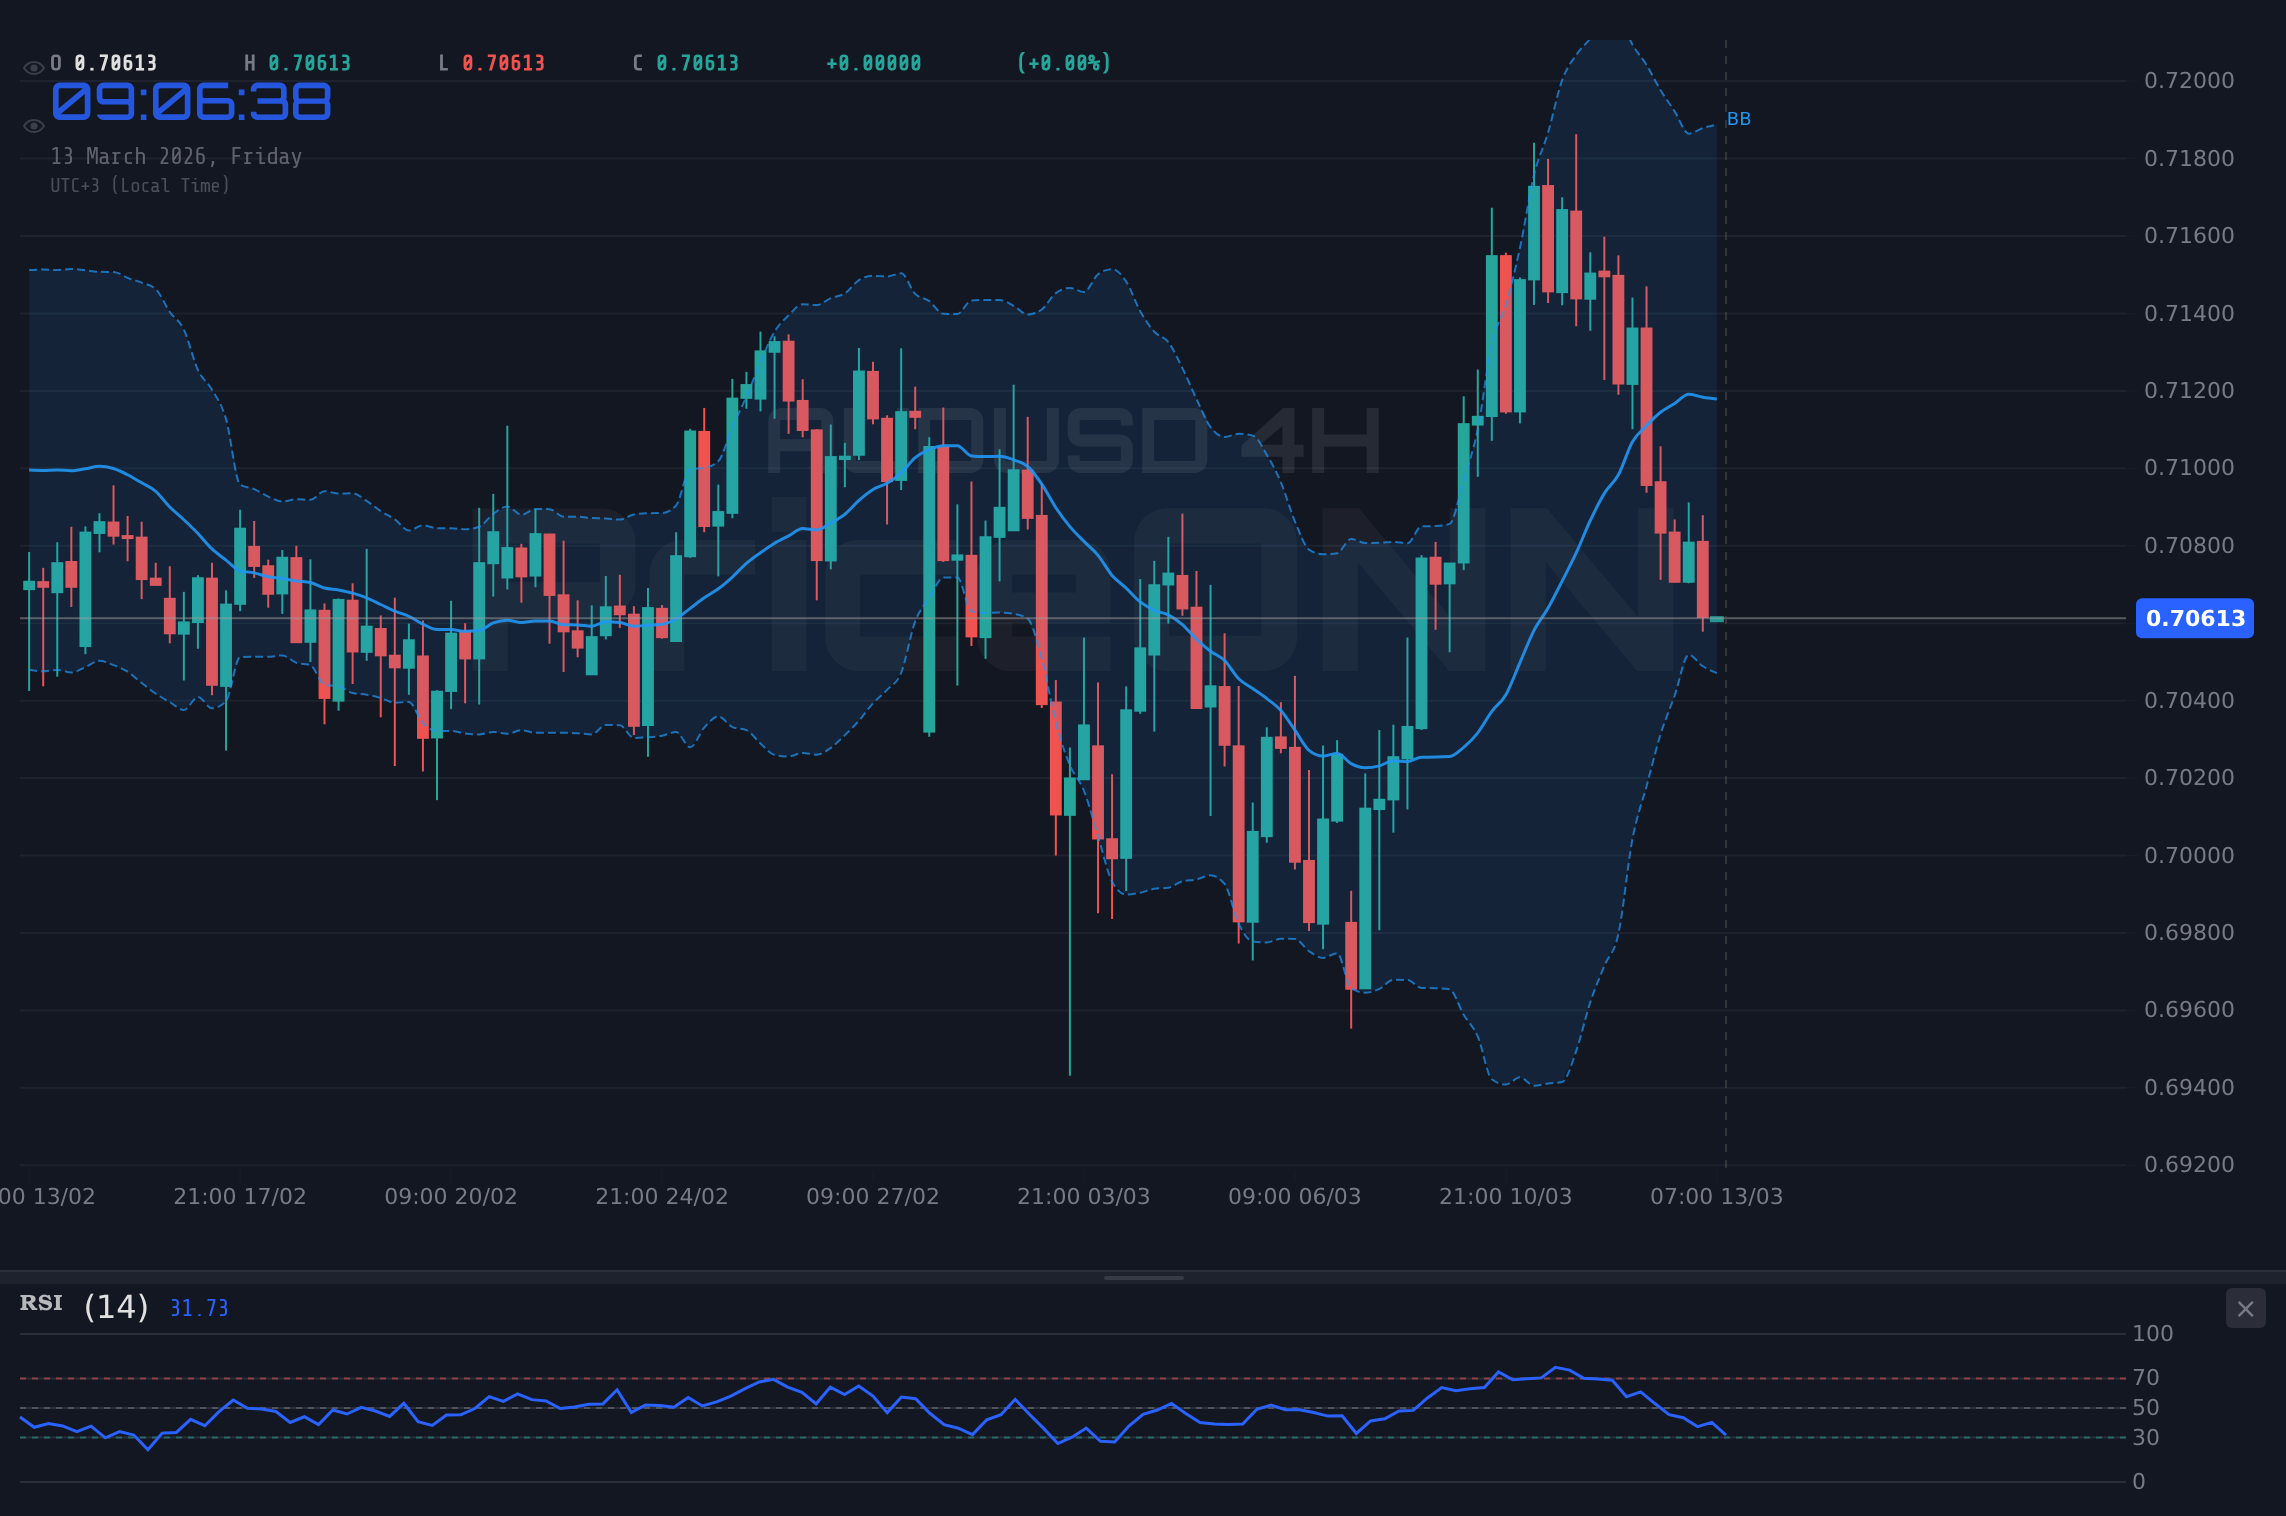
The 4-hour chart presents a slightly different perspective. While the trend is neutral, the ADX remains at 20.51, indicating a moderate downtrend. The RSI(14) is at 43.66, still in neutral territory but trending downwards. The Stochastic indicator is deeply oversold, with %K at 4.32 and %D at 13.57. This could suggest that the pair is due for a correction. Resistance on this timeframe is at 0.70912.
Looking at the daily timeframe, the trend is also neutral. The RSI(14) is at 51.99, indicating neither overbought nor oversold conditions. However, the MACD histogram is negative, and the Stochastic indicator signals a downtrend. Key support on this timeframe is at 0.70409, while resistance lies at 0.71302. The overall signal is mixed, but the prevailing bearish sentiment suggests caution.
Fundamental Drivers and Market Sentiment
The fundamental drivers behind AUDUSD are primarily centered around the strength of the US dollar and the Australian economy's sensitivity to global trade conditions. With the DXY showing significant strength, the Aussie is facing considerable headwinds. Moreover, as reported by Reuters, the Fed is expected to maintain its hawkish stance, which further supports the dollar. The upcoming CPI data releases will be crucial in determining the direction of AUDUSD. Stronger-than-expected CPI data could reinforce the Fed's hawkish stance and lead to further dollar strength, while weaker data could temper expectations and provide some relief for the Aussie. Keep a close eye on the economic calendar; Friday's releases could be pivotal.
Escalating tensions in the Middle East, particularly the Iran threat to the Strait of Hormuz, are adding another layer of complexity. As highlighted by recent news, a surge in crude oil prices could intensify inflation concerns, impacting currency valuations. Given Australia's reliance on commodity exports, any disruption in global trade or commodity prices could have significant consequences for the Aussie.
Trade Plan for AUDUSD
Given the technical and fundamental factors, a cautious approach is warranted for AUDUSD. While the oversold conditions on the short-term charts might suggest a potential bounce, the prevailing bearish sentiment and the strength of the US dollar indicate that the downside risks are significant.
AUDUSD breaks below the 0.70563 support level, triggering further declines towards 0.70409 and potentially 0.7011. This scenario gains traction if the upcoming CPI data reinforces the Fed's hawkish stance.
AUDUSD finds support at 0.70563 and bounces back towards 0.70912 and 0.71302. This scenario becomes more likely if the CPI data is weaker than expected, tempering expectations for further Fed rate hikes.
Trade Recommendation: Consider a short position if AUDUSD breaks below 0.70563, with a stop-loss at 0.70757 (above the 1H resistance) and target levels at 0.70409 and 0.7011. This trade has a probability of 60% given the current bearish sentiment. Conversely, a long position may be considered if AUDUSD rebounds from 0.70563, with a stop-loss at 0.7044 and target levels at 0.70912 and 0.71302. However, this trade carries a higher risk due to the prevailing bearish pressure, and the probability is estimated at 40%.
The upcoming CPI data releases on Friday could trigger significant volatility in AUDUSD. Exercise caution and manage your risk accordingly. Stronger-than-expected data could lead to further downside, while weaker data could spark a rally.
Frequently Asked Questions: AUDUSD Analysis
What happens if AUDUSD breaks below 0.70563 support?
If AUDUSD breaks below the 0.70563 support level, it could trigger further declines towards 0.70409 and potentially 0.7011. This scenario is more likely if the upcoming CPI data reinforces the Fed's hawkish stance.
Should I buy AUDUSD at current levels of $0.70620 given RSI at 28.37?
While the RSI at 28.37 on the 1H chart signals oversold conditions, it's crucial to consider the prevailing bearish sentiment and the strength of the US dollar. A cautious approach is warranted, and a long position should only be considered if AUDUSD shows a clear rebound from 0.70563 with confirmation from other indicators.
Is the negative MACD histogram a sell signal for AUDUSD?
The negative MACD histogram indicates that bearish momentum is in play, but it should be considered in conjunction with other indicators. The oversold RSI suggests a potential for a short-term bounce, so a sell position should be confirmed by a break below the 0.70563 support level.
How will the upcoming CPI data affect AUDUSD this week?
The upcoming CPI data releases will be crucial in determining the direction of AUDUSD. Stronger-than-expected data could reinforce the Fed's hawkish stance and lead to further dollar strength, while weaker data could temper expectations and provide some relief for the Aussie.
Having tracked AUDUSD through the 2024 rate cycle, I’ve noticed that geopolitical tensions in the Middle East can lead to unexpected rallies in oil. If the Iran situation escalates, it could push oil prices higher, influencing inflation expectations and potentially shifting the Fed’s stance. Historically, when RSI reaches this zone on AUDUSD, the outcome has been a short-term bounce followed by a continuation of the prevailing trend. This pattern last appeared in February 2026, when price subsequently broke through the support level.
Amid the current DXY strength and risk-off environment, the correlated broader equity selloff suggests that investors are seeking safe-haven assets. Given the current technical and fundamental outlook, a cautious approach is advisable. The key level to watch is 0.70563. A break below this level could pave the way for further downside, while a rebound could offer a short-term buying opportunity.
Track markets in real-time
AI-powered analysis, technical indicators and real-time price data.
Join Our Telegram Channel
Breaking market news, AI analysis and trading signals instantly.
Join Channel