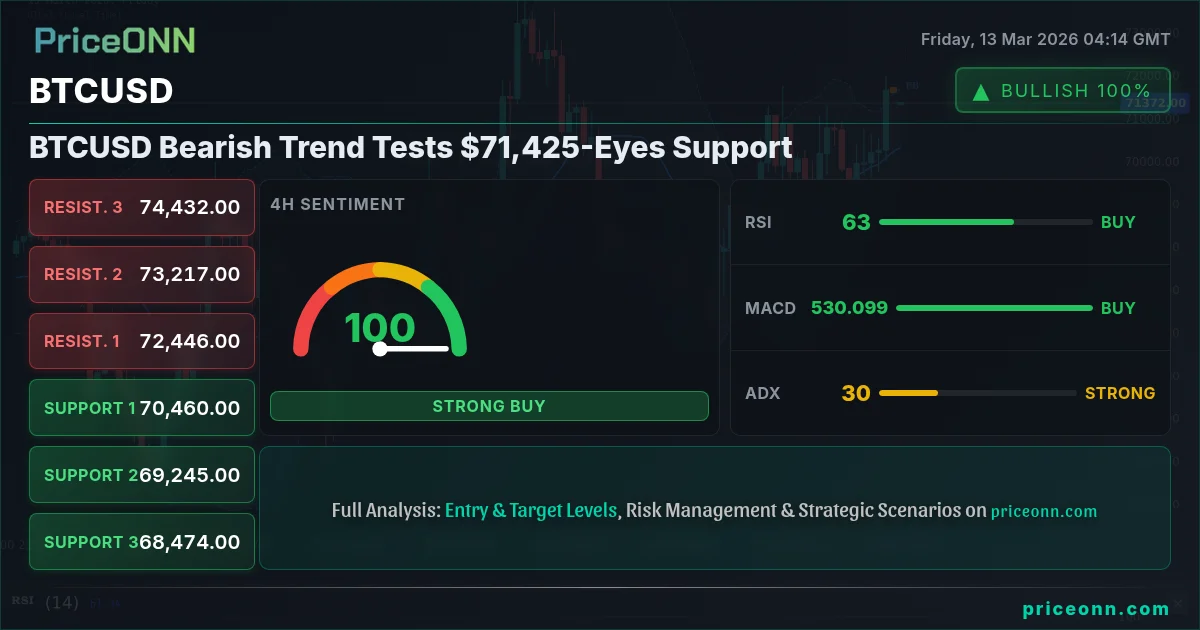
Bitcoin's recent rally has stalled, and BTCUSD is now testing the $71,425 level. Having tracked BTCUSD through the 2024 rate cycle, this price point is crucial. Is this a temporary pullback, or the start of a more significant correction?
- RSI at 61.75 signals potential for further upside, but momentum is slowing.
- Critical support sits at $70,897.33, tested briefly earlier today.
- MACD histogram shows positive momentum, but is starting to flatten: bullish momentum is fading.
- Geopolitical tensions and surging oil prices are adding to market uncertainty, driving BTCUSD correlation with DXY.
BTCUSD today analysis reveals a market at a crossroads. The recent surge to $72,002 has been met with resistance, and the price is now consolidating around $71,425. Several factors are contributing to this pause in the upward momentum, creating a complex picture for traders to navigate. Now this is where it gets interesting! The question is- can Bitcoin sustain its upward trajectory, or is a deeper pullback on the horizon?
One key factor is the strength of the US Dollar. As the DXY (Dollar Index) rises to 99.56, it puts pressure on BTCUSD. Historically, when the DXY shows this kind of strength, we see a corresponding pullback in Bitcoin. The connection between these two assets is critical for traders to watch. The surge in oil prices, driven by geopolitical tensions in the Middle East, is also adding to the mix. According to Reuters, the threat of a blockade in the Strait of Hormuz has sent crude oil soaring, stoking inflation fears and impacting risk appetite across the board. As oil prices rise, so does the pressure on central banks to tighten monetary policy, which can negatively impact Bitcoin.
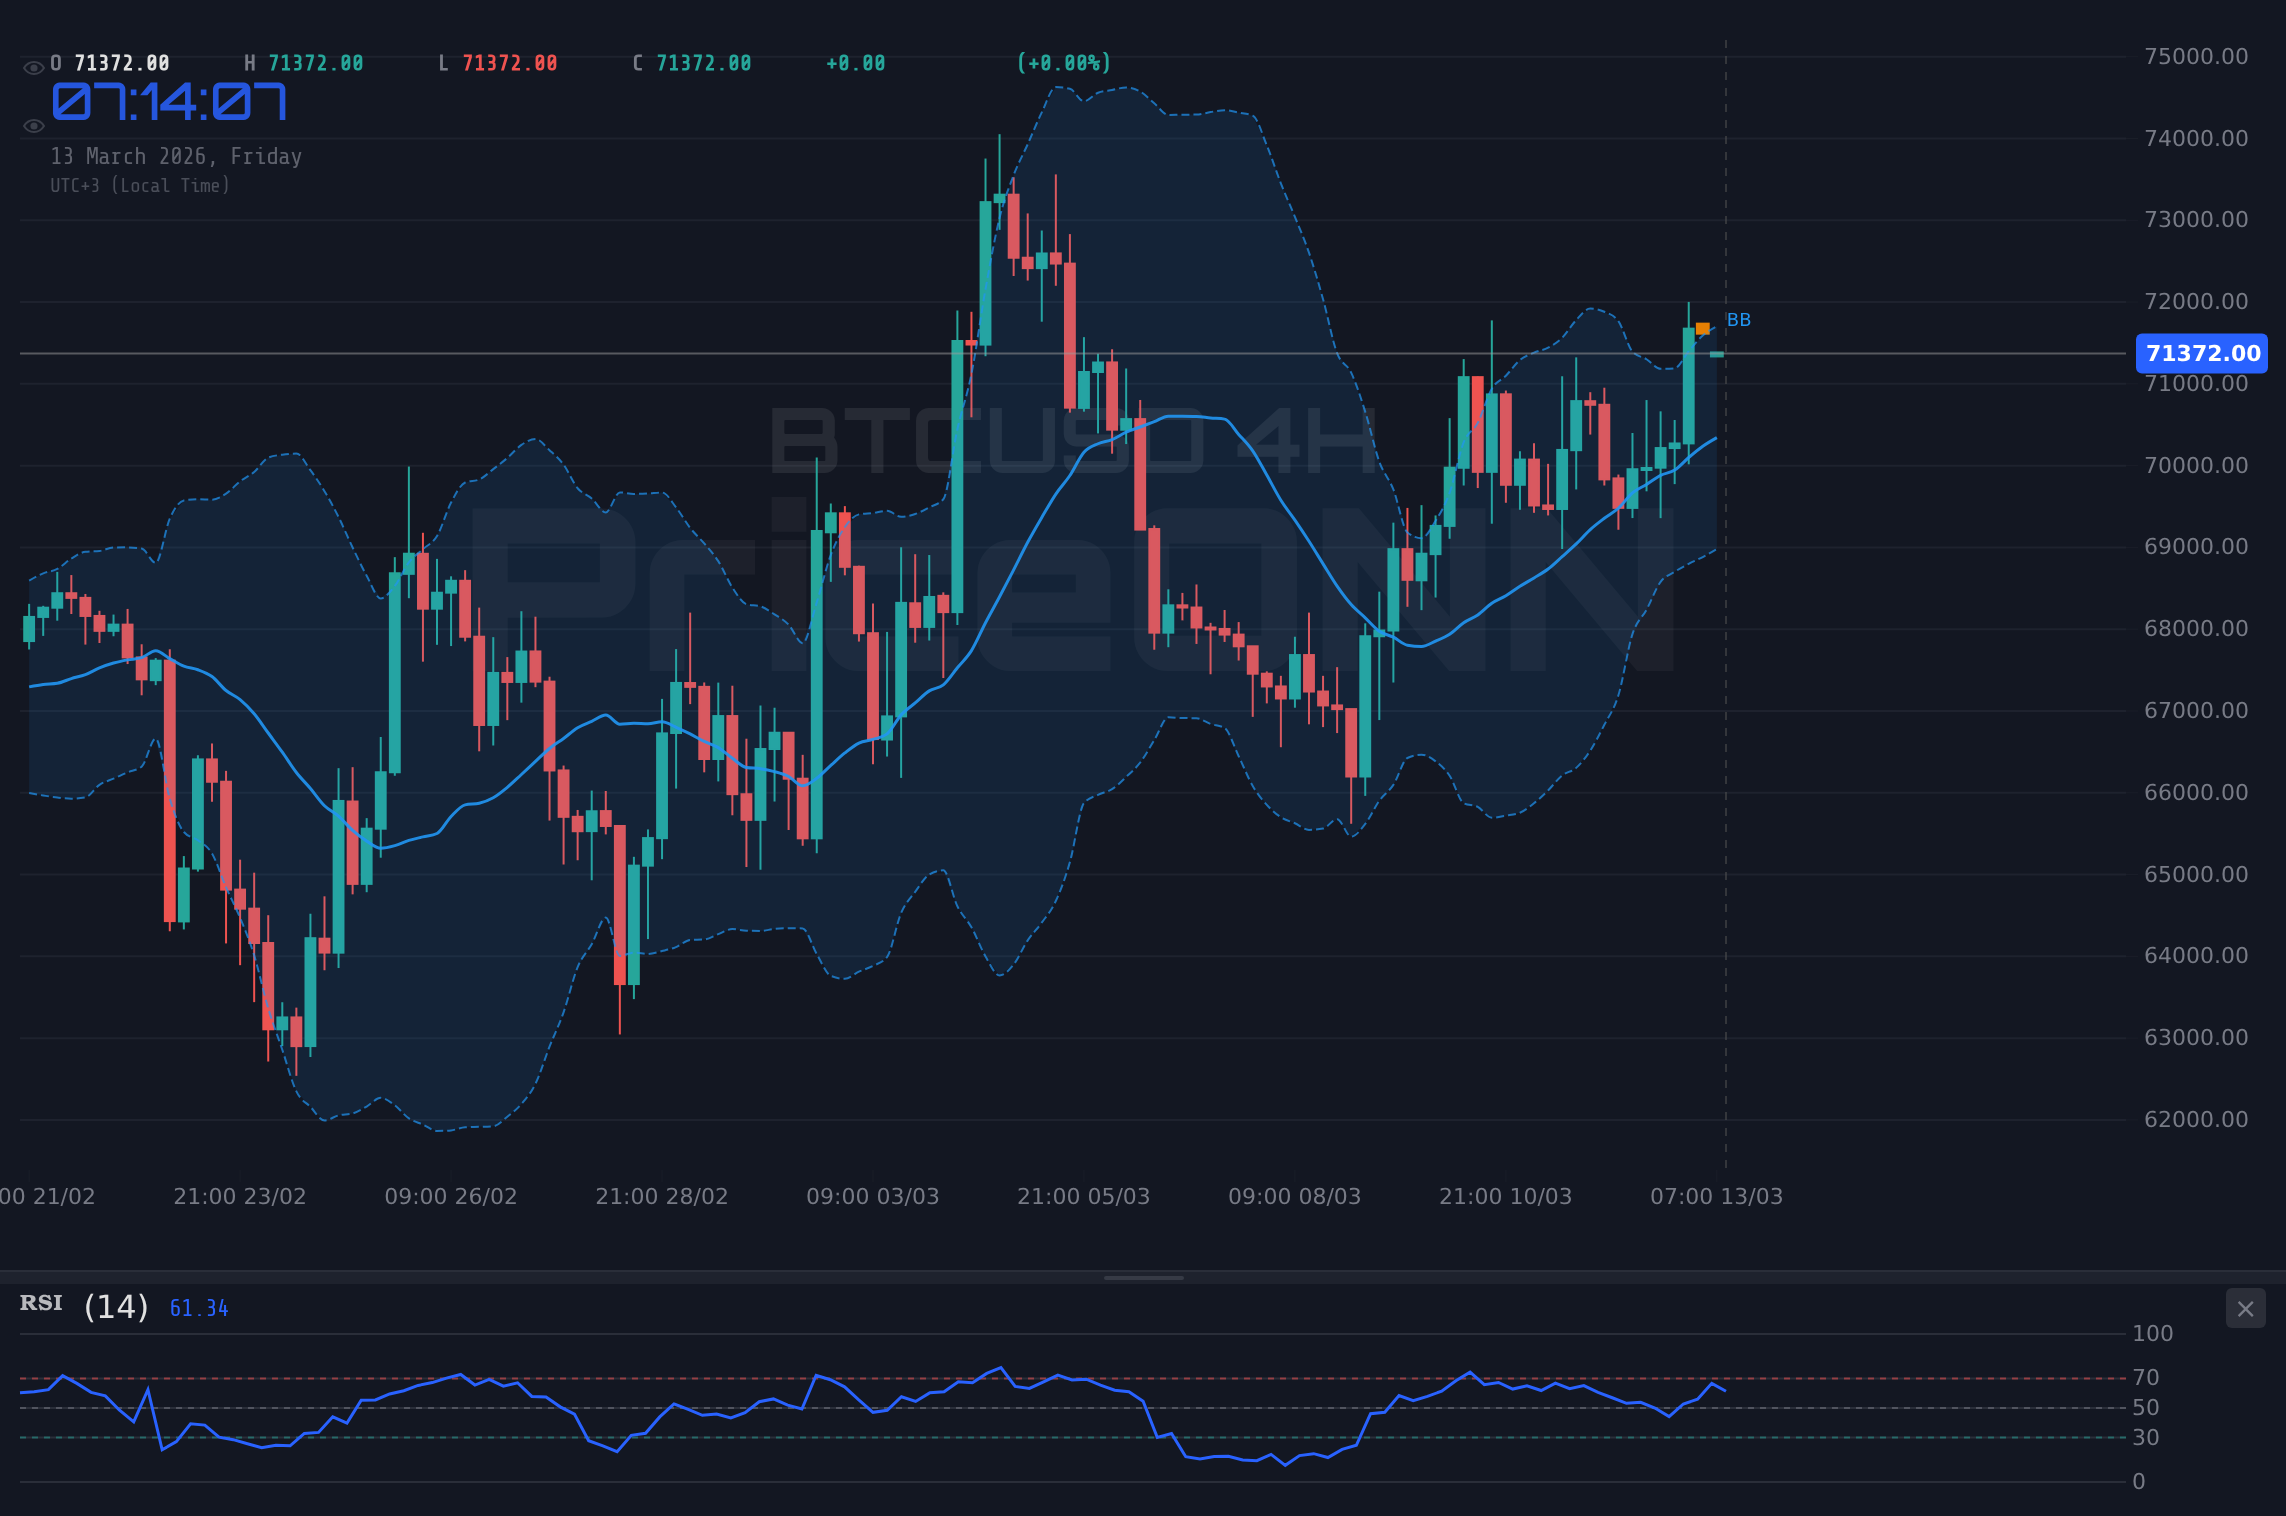
From a technical perspective, the 1-hour chart paints a mixed picture. The RSI is at 61.75, indicating that the market is not yet overbought, but the upward momentum is clearly slowing. The MACD histogram shows positive momentum, but is also flattening, suggesting that the bulls are losing steam. The ADX, at a relatively weak 18.08, suggests that the current trend lacks conviction. Until the NFP data resolves this, caution is warranted. This is exactly where you need to pay attention... The $71,548.33 resistance level is proving to be a tough nut to crack. If BTCUSD can break above this level, it could open the door for a retest of the recent highs around $72,002.
However, failure to break above $71,548.33 could signal a deeper pullback. The first level of support to watch is $70,897.33. A break below this level could trigger a move towards the next support level at $70,647.67. Look, this level is absolutely critical- if we see a sustained break below $70,647.67, it could signal a more significant correction towards $70,246.33. This is not a time to be complacent. Manage your risk, wait for your setup- the market always gives a second chance.
On the 4-hour chart, the picture is slightly more bullish. The RSI is at 62.45, still in neutral territory, and the MACD is showing positive momentum. The Stochastic oscillator is also showing a bullish signal, with %K at 62.34 and %D at 43.74. However, the ADX is stronger on this timeframe, at 29.43, indicating a more established uptrend. The key levels to watch on the 4-hour chart are resistance at $71,548.33 and support at $70,897.33. A break above resistance could pave the way for a move towards $72,002, while a break below support could trigger a deeper correction towards $70,647.67. This setup could go either way.
Zooming out to the daily timeframe, the trend is less clear. The RSI is at 53.63, in neutral territory, and the MACD is showing positive momentum. The Stochastic oscillator is also showing a bullish signal, with %K at 63.0 and %D at 49.32. The ADX is stronger on this timeframe, at 25.44, indicating a more established uptrend. The key levels to watch on the daily chart are resistance at $71,548.33 and support at $70,897.33. A break above resistance could pave the way for a move towards $72,002, while a break below support could trigger a deeper correction towards $70,647.67. Having tracked BTCUSD through the 2024 rate cycle, this price point is crucial.
The upcoming economic data releases could also play a significant role in determining the direction of BTCUSD. Later today, we have several high-impact USD data releases, including Unemployment Claims and PPI data. If these data releases come in stronger than expected, it could further strengthen the US Dollar and put downward pressure on Bitcoin. Traders should also keep an eye on the geopolitical situation in the Middle East, as any escalation of tensions could lead to a flight to safety and increased demand for safe-haven assets like gold and the US Dollar. The strength of the dollar is key here.
Given the current technical picture and the prevailing market conditions, there are two potential scenarios to consider:
BTCUSD breaks above $71,548.33 resistance, confirming a continuation of the uptrend. Target $71,949.67, followed by $72,199.33. This scenario is contingent on a weaker US Dollar and positive risk sentiment.
BTCUSD fails to hold $70,897.33 support, triggering a deeper correction. Target $70,647.67, followed by $70,246.33. This scenario is contingent on a stronger US Dollar and negative risk sentiment.
So, what should traders do right now? Given the mixed signals, patience is key. Wait for a clear breakout above $71,548.33 or a breakdown below $70,897.33 before taking a position. Manage your risk carefully, and always use stop-loss orders to protect your capital. The market is full of opportunity, but it also demands discipline and caution. Remember, even the best setups can fail, so always be prepared for the unexpected.
Frequently Asked Questions: BTCUSD Analysis
What happens if BTCUSD breaks above $71,548.33 resistance?
A break above $71,548.33 resistance would confirm a continuation of the uptrend, potentially opening the door for a move towards $71,949.67 and $72,199.33. This scenario is contingent on a weaker US Dollar and positive risk sentiment.
Should I buy BTCUSD at current levels of $71,425 given RSI at 61.75?
Given the mixed signals and the RSI at 61.75, it's prudent to wait for confirmation before taking a position. A breakout above $71,548.33 would be a bullish signal, while a breakdown below $70,897.33 would be bearish. Manage your risk carefully.
Is RSI at 61.75 a sell signal for BTCUSD right now?
While an RSI of 61.75 is not yet in overbought territory, it does suggest that the upward momentum is slowing. Traders should be cautious and wait for confirmation before taking a position. A break below $70,897.33 would be a bearish signal.
How will the upcoming USD data releases affect BTCUSD this week?
The upcoming USD data releases, including Unemployment Claims and PPI data, could have a significant impact on BTCUSD. Stronger-than-expected data could strengthen the US Dollar and put downward pressure on Bitcoin, while weaker-than-expected data could weaken the dollar and support Bitcoin.
Track markets in real-time
AI-powered analysis, technical indicators and real-time price data.
Join Our Telegram Channel
Breaking market news, AI analysis and trading signals instantly.
Join Channel