XAGUSD is currently navigating a complex landscape, testing the $84.65 level amid escalating geopolitical tensions in the Middle East. As traders, we know that uncertainty breeds volatility, and silver is no exception. The surge in oil prices due to threats to the Strait of Hormuz, as reported by Reuters, is adding another layer of complexity. The key question now is whether this pullback is a temporary correction or the beginning of a more substantial downtrend.
- RSI (14) on the 1H chart at 44.9 signals neutral momentum, suggesting a potential for further downside.
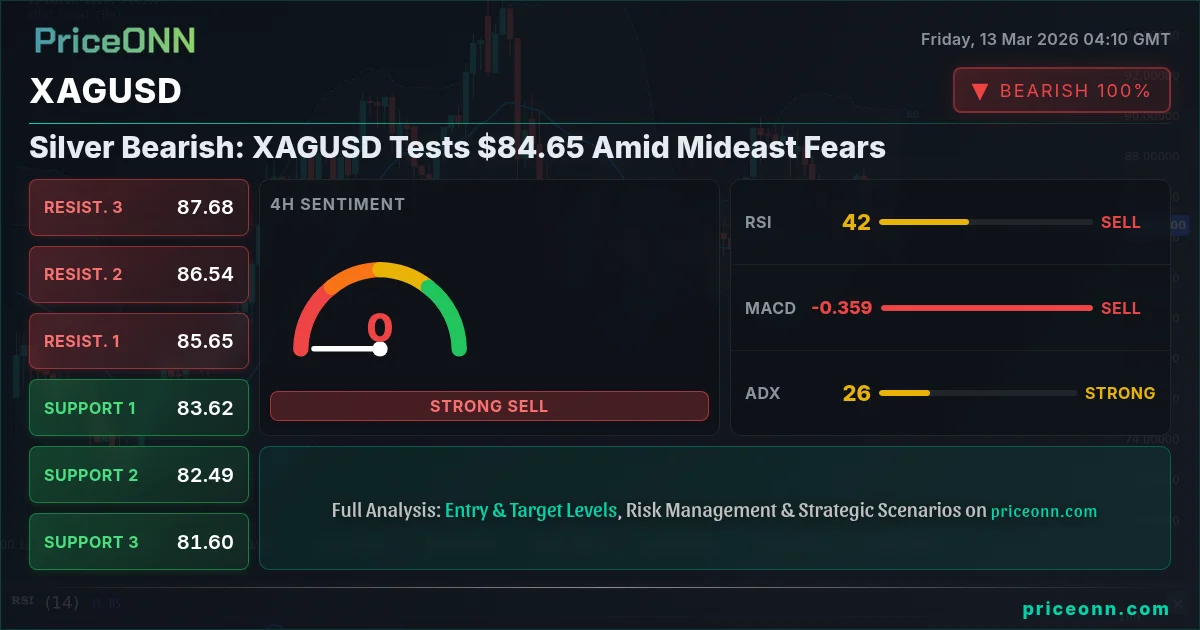
- Immediate resistance for XAGUSD lies at $84.93, a level to watch for potential breakout attempts.
- The ADX at 33.79 indicates a strong downtrend on the 1H timeframe, reinforcing bearish sentiment.
- Geopolitical tensions and rising oil prices are key drivers impacting XAGUSD's correlation with safe-haven assets.
To understand the current XAGUSD price action, we need to analyze the interplay of technical indicators and fundamental drivers. The 1-hour chart reveals a neutral trend with 92% strength, but a strong bearish signal. The RSI(14) stands at 44.9, suggesting neither overbought nor oversold conditions, implying room for further downside. The MACD histogram indicates decreasing positive momentum, hinting at a potential bearish crossover. The Stochastic K is at 65.09, while D is at 46.94, showing a bullish signal, with %K > %D, but this could be short-lived given the overall bearish picture. The ADX at 33.79 signifies a strong downtrend, reinforcing the bearish sentiment. This combination of factors suggests that the current test of $84.65 is more than just a minor pullback.
The Bull's Roadmap: A Path to Recovery
For the bulls to regain control, XAGUSD needs to decisively break above the immediate resistance at $84.93. If XAGUSD manages to clear this hurdle, the next target would be $85.47, followed by $85.77. A sustained move above $85.77 would signal a potential shift in sentiment, attracting further buying interest. However, this scenario is contingent on a weakening US Dollar and a stabilization of geopolitical tensions. Scalpers might look for quick long positions above $84.93, while swing traders might wait for a confirmed breakout above $85.47. From a longer-term perspective, investors should monitor industrial demand, which can provide a fundamental boost to silver prices.
Where Bears Take Control: The Downside Scenario
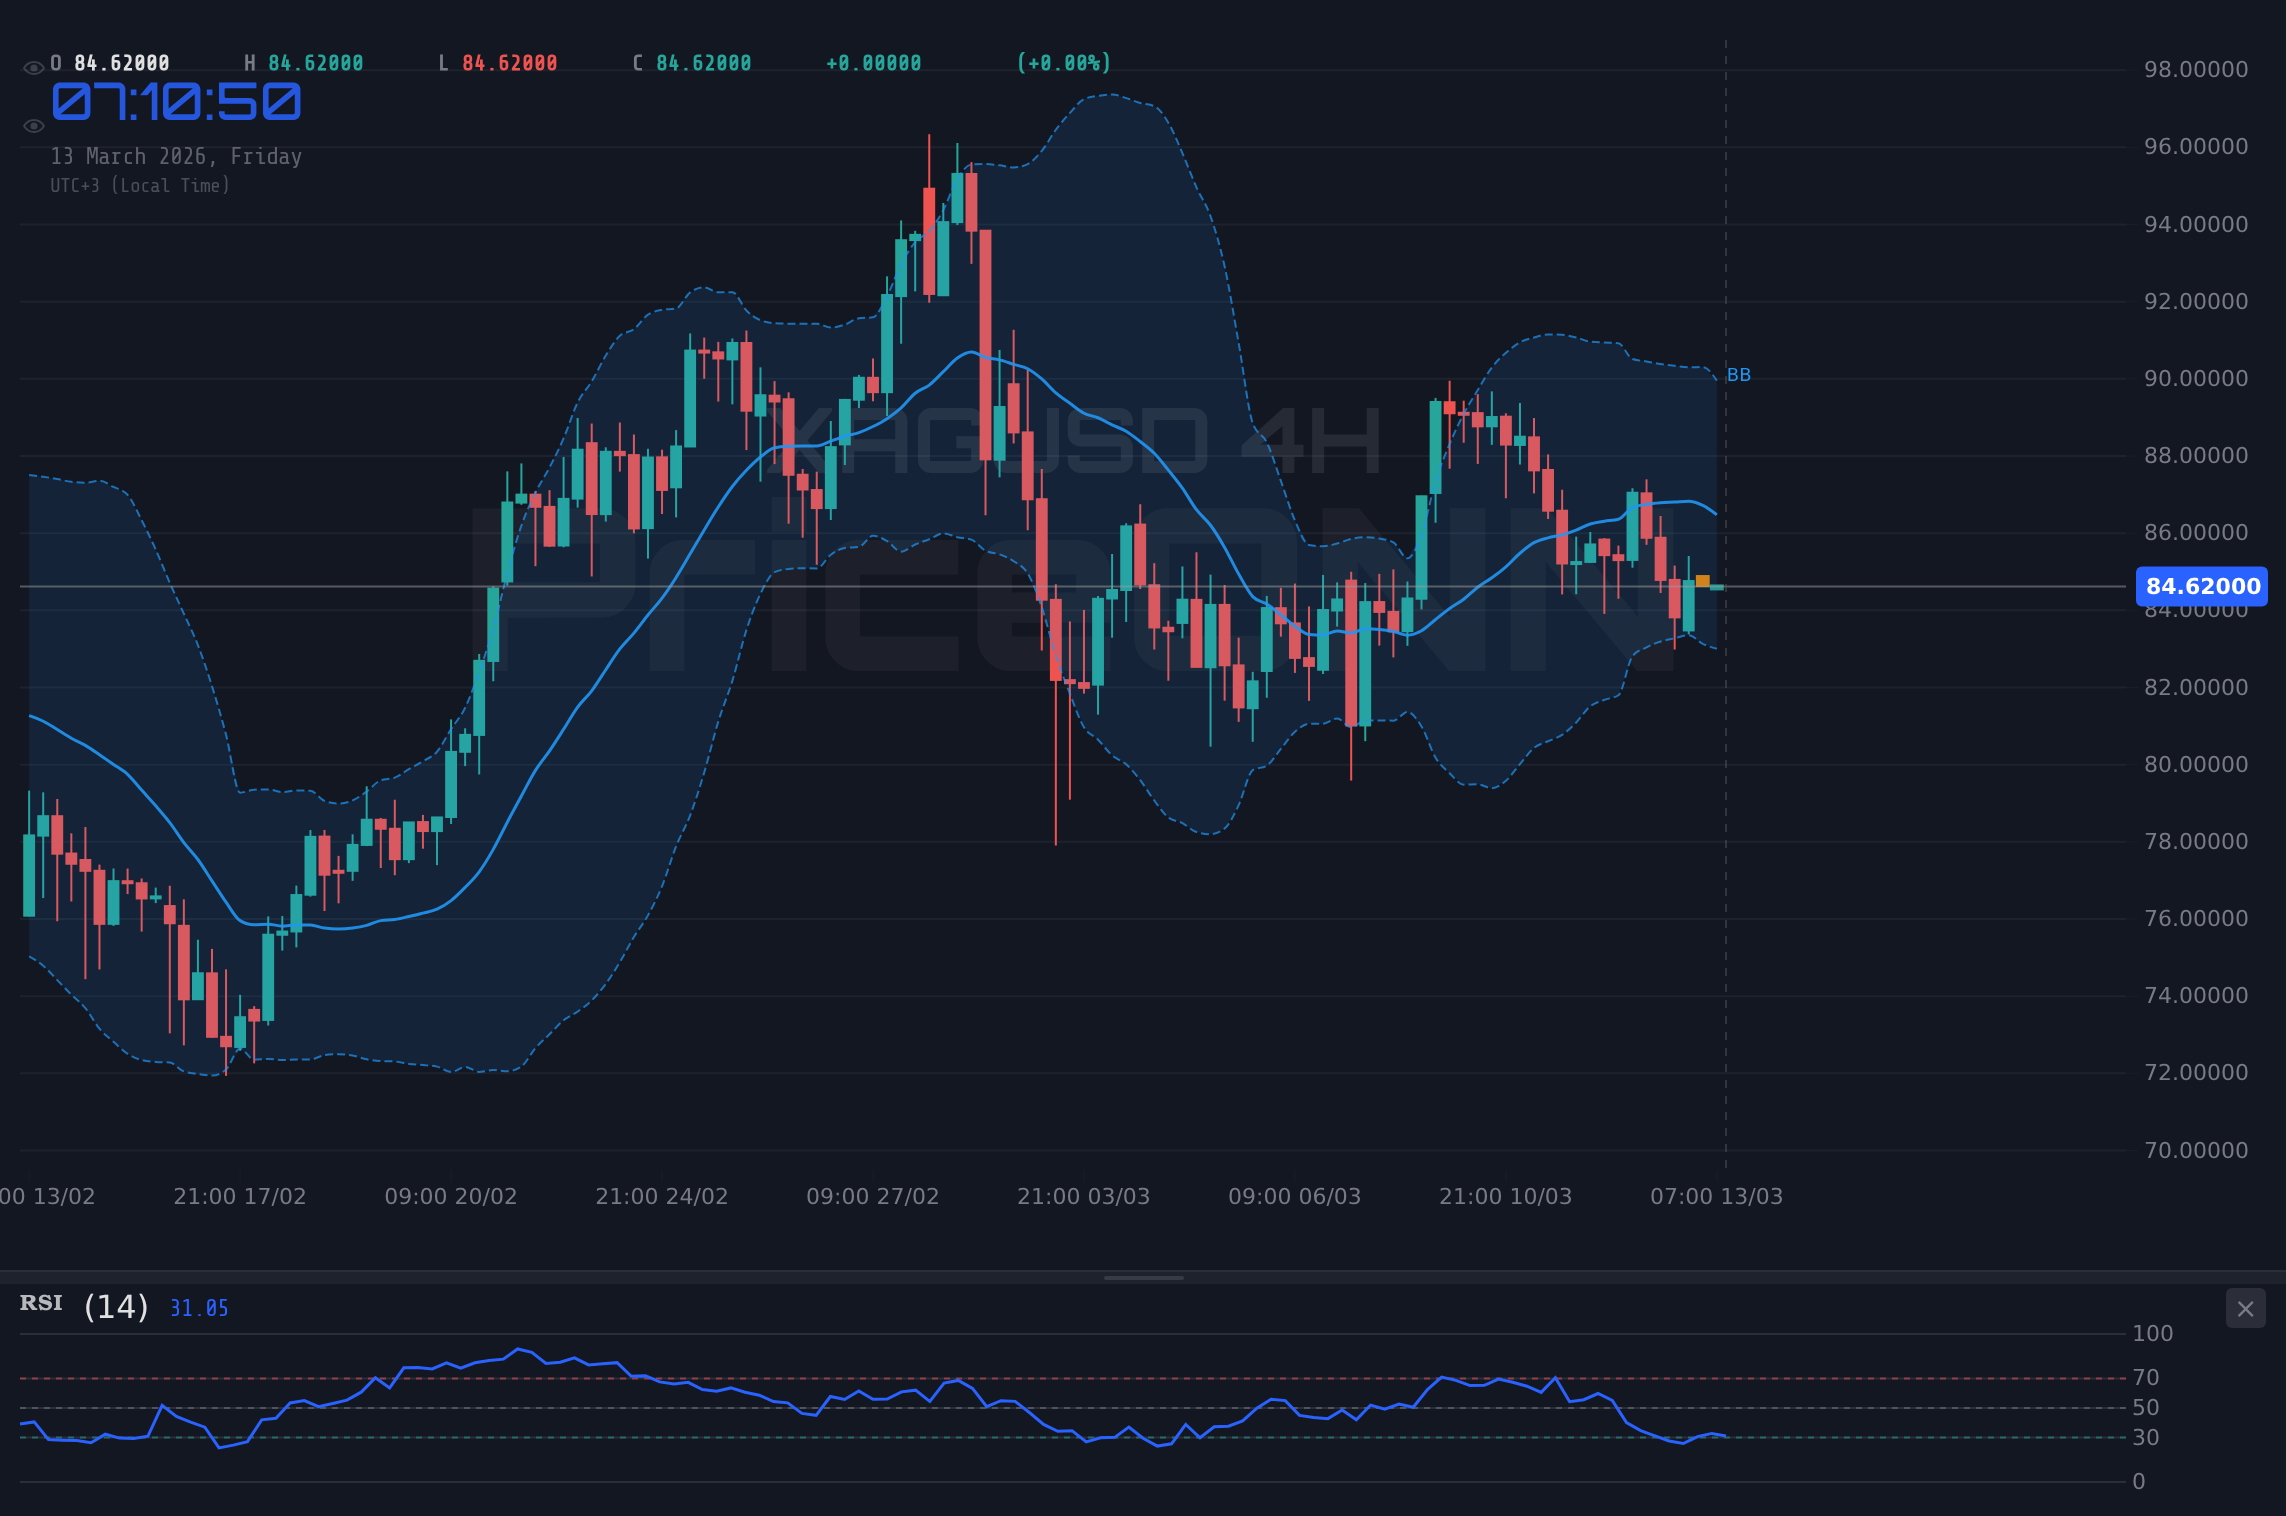
The bearish scenario unfolds if XAGUSD fails to hold the immediate support at $84.1. A break below this level could trigger a cascade of selling pressure, pushing the price towards the next support at $83.8, and subsequently $83.26. The 4H chart shows that the first support sits at $82.81. The RSI(14) at 45.36 signals neutral momentum, leaving space for further downside. The MACD's negative momentum reinforces this bearish outlook. The stochastic at K=26.01 and D=32.35 also indicate a bearish signal. An ADX of 25.03 confirms a strong downtrend. This bearish scenario is further supported by the strengthening US Dollar, with the DXY currently at 99.56. Short-term traders might eye short positions below $84.1, while swing traders could consider entries below $83.8.
The Waiting Game: A Range-Bound Squeeze
A neutral scenario emerges if XAGUSD remains trapped between the immediate support at $84.1 and the resistance at $84.93. In this case, the price action would likely be characterized by choppy, sideways movement. The 1D chart shows a weak trend with an ADX of 14.53, and a general signal to sell. The RSI(14) is at 49.69, indicating neutral momentum. The 1H chart shows that the stochastic K is at 65.09 and D is at 46.94, showing a bullish signal. This mixed bag of signals suggests that the market is indecisive, awaiting a catalyst to break the stalemate. Scalpers might attempt to profit from short-term fluctuations within this range, but longer-term traders should remain on the sidelines, awaiting a clearer directional signal. A sustained period of consolidation could also set the stage for a powerful breakout in either direction.
Assessing the Probabilities: Which Scenario is Most Likely?
Given the current technical picture and the prevailing geopolitical tensions, the bearish scenario appears to be the most likely outcome in the short term. The strong downtrend indicated by the ADX on the 1H chart, combined with the weakening momentum suggested by the MACD, favors further downside. The Reuters report of Iran's threat to the Strait of Hormuz blockade is adding more pressure. However, it's crucial to acknowledge the potential for a sudden shift in sentiment. A de-escalation of tensions or a weakening US Dollar could quickly invalidate the bearish thesis. Therefore, a probability estimate of 50% is assigned to the bearish scenario, 30% to the bullish scenario, and 20% to the neutral scenario. The current global economic and political climate makes the bearish scenario the most probable.
Key Triggers to Watch This Week
Several key events and data releases could act as catalysts for XAGUSD this week. Traders should closely monitor the upcoming US economic data, including the USD releases scheduled for today (Friday). Any surprises in these figures could trigger a sharp reaction in the US Dollar, impacting XAGUSD. Geopolitical developments in the Middle East will also remain a key driver. Any further escalation of tensions could boost safe-haven demand, supporting silver prices. Finally, keep an eye on the DXY (Dollar Index). A sustained break above 99.58 could exert further downward pressure on XAGUSD, while a reversal could provide some relief.
Historical Perspective and Correlation Analysis
Historically, silver has often acted as a safe-haven asset during times of geopolitical uncertainty. However, its industrial demand also makes it sensitive to economic growth. Looking back at previous instances of Middle East tensions, we've seen silver prices initially spike, followed by a correction as the market digests the news. Currently, XAGUSD is showing a negative correlation with the DXY, as the dollar strengthens. The SP500 and Nasdaq are showing a downward trend, suggesting risk aversion. WTI crude oil is trading around $95.6, indicating that the oil price surge is already priced into the market. Traders should consider these correlations when formulating their trading strategies.
The Role of Central Bank Policies
Central bank policies, particularly those of the Federal Reserve, play a significant role in influencing XAGUSD prices. Currently, market expectations are pricing in a more hawkish stance from the Fed, which is supporting the US Dollar and putting downward pressure on silver. According to Reuters, Fed officials have emphasized that inflation remains 'stubborn'. This suggests that the Fed is unlikely to ease its monetary policy anytime soon, which could continue to weigh on XAGUSD. Traders should monitor Fed speeches and economic data releases for clues about the future direction of monetary policy.
Trade Plan: XAGUSD Bearish Scenario
Considering the technical and fundamental factors, a bearish trade plan for XAGUSD appears to be the most prudent approach.
Enter short if price breaks and holds below $84.1. Target 1: $83.8. Target 2: $83.26. This scenario plays out if geopolitical tensions remain high and the US Dollar continues to strengthen.
Enter long if price breaks and holds above $84.93. Target 1: $85.47. Target 2: $85.77. This scenario plays out if geopolitical tensions ease and the US Dollar weakens.
The upcoming USD economic data releases on Friday could trigger significant volatility in XAGUSD. Exercise caution and manage your risk accordingly.
Technical Outlook Summary
| Indicator | Value | Signal |
|---|---|---|
| RSI (14) 1H | 44.9 | Neutral |
| MACD Histogram 1H | Negative | Bearish |
| Stochastic 1H | K=65.09, D=46.94 | Bullish |
| ADX 1H | 33.79 | Strong Downtrend |
| Bollinger 1H | Below Middle Band | Bearish |
Key Levels
Support Levels
Resistance Levels
Frequently Asked Questions: XAGUSD Analysis
What happens if XAGUSD breaks below $84.1 support?
If XAGUSD decisively breaks below the $84.1 support level, it could trigger a significant sell-off, potentially pushing the price down to the next support levels at $83.8 and $83.26. This scenario is supported by the strong downtrend indicated by the ADX on the 1H chart.
Should I short XAGUSD at current levels of $84.65 given the RSI at 44.9?
While the RSI at 44.9 suggests neutral momentum, the overall technical picture favors a bearish approach. A short position could be considered if the price breaks and holds below $84.1, with a stop-loss placed above $84.93 to manage risk. Remember that upcoming USD releases can cause significant volatility.
Is the Stochastic at K=65.09 and D=46.94 a reliable buy signal for XAGUSD?
The Stochastic showing K=65.09 and D=46.94 on the 1H chart indicates a bullish signal, but it's crucial to consider the broader context. Given the strong downtrend indicated by the ADX, this bullish signal should be viewed with caution. It might be a short-term bounce within a larger downtrend.
How will the upcoming USD economic data releases affect XAGUSD this week?
The upcoming USD economic data releases scheduled for today (Friday) could significantly impact XAGUSD. Stronger-than-expected data could boost the US Dollar, putting downward pressure on silver, while weaker-than-expected data could weaken the dollar, providing some relief to XAGUSD.
Track markets in real-time
AI-powered analysis, technical indicators and real-time price data.
Join Our Telegram Channel
Breaking market news, AI analysis and trading signals instantly.
Join Channel