USDJPY is currently testing resistance around $159.24, a level that has proven difficult to breach in recent sessions. With the dollar index (DXY) gaining strength, the pressure is mounting on the yen. Is this the prelude to a significant breakout, or will the bears defend this key level? The answer lies in a confluence of technical indicators and fundamental drivers that demand close attention from traders right now.
- RSI at 61.09 on the 1H chart suggests increasing bullish momentum.
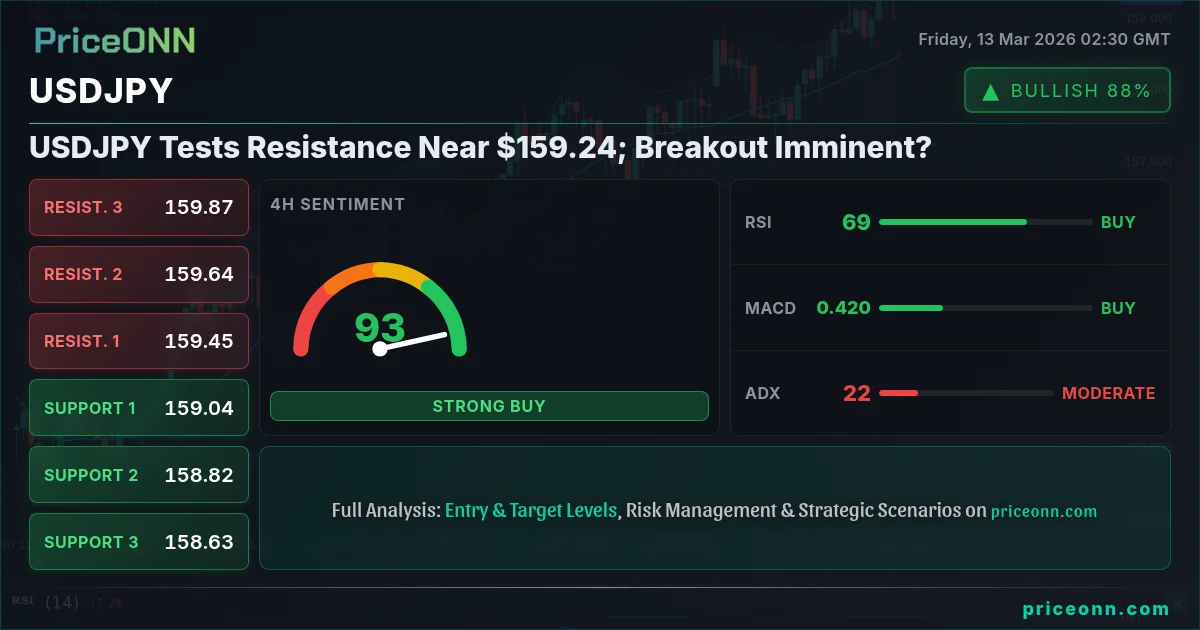
- Key resistance level near $159.24, a sustained break above which could trigger further upside.
- ADX at 16.66 on the 1H timeframe indicates a weak trend, suggesting a potential consolidation before the next move.
- Strengthening DXY is adding downward pressure on USDJPY, creating a potential breakout setup.
Why $159.24 is the Line in the Sand
The $159.24 level represents a critical juncture for USDJPY. Having tracked USDJPY through the 2024 rate cycle, we’ve seen this level act as a magnet for price action, attracting both buyers and sellers. A decisive break above this resistance would signal a potential shift in market sentiment, opening the door for further gains. However, failure to overcome this hurdle could lead to a retest of support levels and a period of consolidation. The key here is patience and waiting for confirmation before committing to a directional bias.
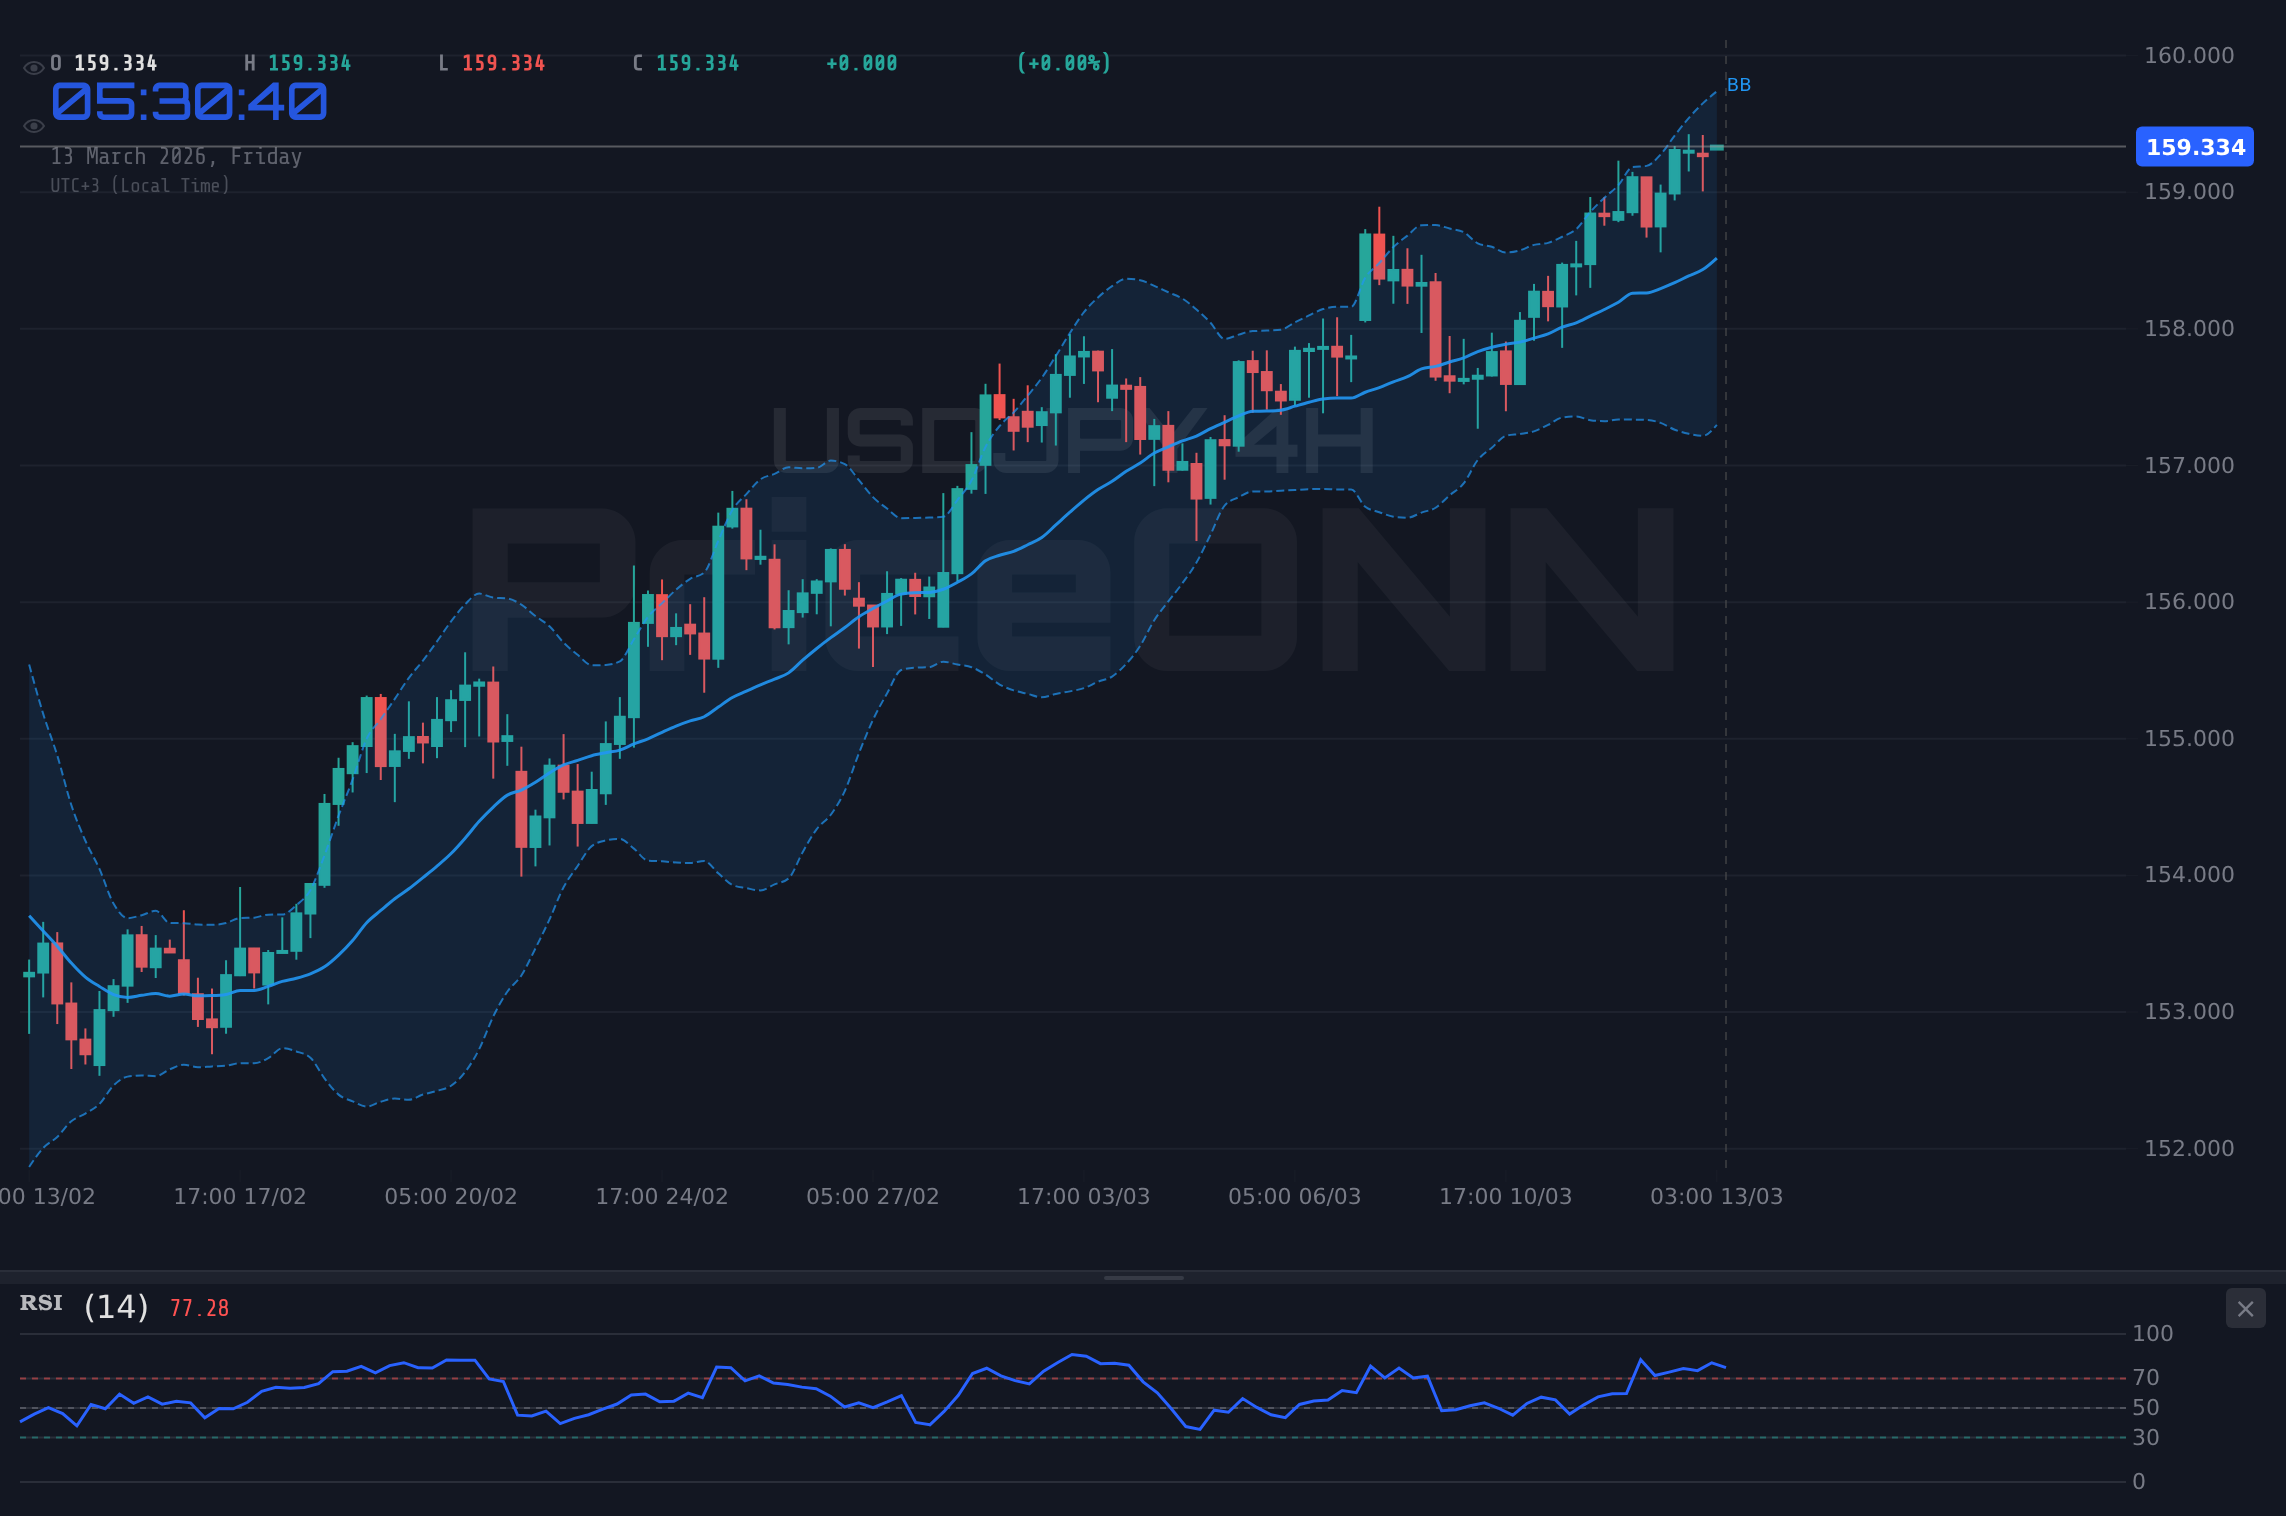
On the 1H timeframe, USDJPY is trading above its middle Bollinger Band, which often acts as dynamic support, currently near $159.10. The RSI at 61.09 indicates that the market is not yet overbought, providing room for further upside. However, the Stochastic oscillator shows a potential overbought condition with %K at 45.14 and %D at 67.53, suggesting caution is warranted. A trader might wait for a pullback to the middle Bollinger Band before entering a long position. This approach aligns with a risk-averse strategy, allowing for a more favorable entry point and a tighter stop-loss order.
Multi-Timeframe Analysis: What Signals Are We Seeing?
A multi-timeframe analysis provides a more comprehensive view of USDJPY. On the 4H chart, the pair is exhibiting a bullish trend, with the ADX at 21.46 indicating moderate strength. The RSI at 68.41, while not yet in overbought territory, suggests that the bulls are in control. The MACD histogram is positive, further supporting the bullish narrative. However, the Stochastic oscillator is flashing an overbought signal with %K at 93.08 and %D at 85.26, which could trigger a short-term pullback. This is exactly where you need to pay attention. The 1D chart shows a mixed picture, with the ADX at a weak 19.9, suggesting a lack of strong trend. The RSI at 68.38 is neutral, while the MACD is positive. The Stochastic oscillator is also overbought with %K at 89.49 and %D at 83.39. This divergence across different timeframes highlights the need for careful risk management and confirmation before initiating a trade.
Scalpers might look for short-term opportunities to buy pullbacks to the middle Bollinger Band on the 1H chart, targeting a quick profit near the $159.24 resistance. Swing traders might wait for a decisive break above this level before entering a long position, targeting higher resistance levels. Long-term investors might use pullbacks to accumulate USDJPY, anticipating further yen weakness due to the diverging monetary policies between the Federal Reserve and the Bank of Japan. Each trading style requires a unique approach to risk management and trade execution.
The DXY Effect: How Dollar Strength Impacts USDJPY
The dollar index (DXY) plays a crucial role in influencing USDJPY. As the DXY strengthens, it puts downward pressure on USDJPY, as the yen weakens relative to the dollar. Currently, the DXY is trading at 99.46, with a daily change of 0.58%. The 1H, 4H, and 1D timeframes all show a bullish trend for the DXY, with the ADX indicating strong momentum. This DXY strength is providing a tailwind for USDJPY, potentially fueling a breakout above the $159.24 resistance. Historically, when the DXY exhibits such strength, we often see a corresponding weakness in the yen. However, traders should also monitor risk sentiment and potential safe-haven flows, which could temporarily support the yen despite the DXY strength.
The correlation between DXY and USDJPY isn't always perfect. Geopolitical events, shifts in risk appetite, and domestic Japanese economic data can all influence the pair independently of the dollar index. For example, any surprise announcement from the Bank of Japan regarding its monetary policy could trigger a sharp move in USDJPY, regardless of the DXY's trajectory. Therefore, traders should consider a broad range of factors before making a trading decision.
Geopolitical Tensions and the Oil Price Surge
Escalating geopolitical tensions, particularly in the Middle East, are having a significant impact on global markets. The surge in oil prices, with Brent crude currently at $100.73 and WTI crude at $95.75, is fueling inflation fears and potentially pushing the Federal Reserve towards a more hawkish stance. According to Reuters, Fed officials have expressed concerns about “stubborn” inflation, suggesting that further interest rate hikes may be necessary. This hawkish Fed narrative is supporting the dollar and adding to the downward pressure on USDJPY. The oil price surge also creates a complex dynamic, as it could negatively impact the Japanese economy, which is heavily reliant on imported energy. This economic headwind could further weaken the yen, amplifying the impact of the strengthening dollar.
The market’s reaction to these geopolitical risks is evident in the retreat of Asian markets and the plunge in the Dow Jones Industrial Average. This risk-off sentiment is typically supportive of safe-haven currencies like the yen. However, the countervailing force of the strengthening dollar is currently dominating the price action in USDJPY. Traders should monitor these geopolitical developments closely, as they could trigger sudden shifts in market sentiment and volatility.
Japanese Economic Data and BOJ Policy
While the external factors are exerting significant influence, it's crucial not to overlook the domestic Japanese economic landscape and the Bank of Japan’s (BOJ) policy. The BOJ has maintained its ultra-loose monetary policy, despite rising inflation, creating a stark contrast with the Fed's tightening stance. This policy divergence is a primary driver of yen weakness. According to Bloomberg data, institutional investors are increasingly betting on further yen depreciation, citing the BOJ's reluctance to deviate from its current course. However, any hints of a potential shift in BOJ policy could trigger a sharp reversal in USDJPY. Historically, surprises from the BOJ have often led to significant market volatility, catching many traders off guard.
Upcoming Japanese economic data, including inflation figures and GDP growth, will be closely watched for any signs of change. Stronger-than-expected data could put pressure on the BOJ to reconsider its policy stance, potentially providing support for the yen. Conversely, weaker data could reinforce the BOJ’s current policy and further weaken the yen. Traders should remain vigilant and be prepared to adjust their positions based on these data releases. The next few weeks could prove to be pivotal for USDJPY, as the market grapples with these competing forces.
Trade Plan: Riding the Bullish Wave?
Based on the current technical and fundamental outlook, a bullish trade setup for USDJPY is worth considering, but with careful risk management. The 1H and 4H charts show a bullish trend, while the DXY strength provides a supporting tailwind. However, the overbought Stochastic oscillator and the potential for geopolitical risks warrant caution. Patience looks like it will be rewarded here.
A sustained break above $159.24 resistance would open the door for further upside, targeting $159.43 and $159.56. This scenario is contingent on continued DXY strength and no surprise announcements from the BOJ.
Failure to break above $159.24 could lead to a retest of support near $158.98 and $158.88. This scenario would likely play out if risk sentiment deteriorates or if the BOJ hints at a policy shift.
The probability of the bullish scenario playing out is estimated at 60%, given the DXY strength and the prevailing market sentiment. However, the 40% probability of the bearish scenario highlights the need for vigilance and careful risk management. Remember to manage your risk, wait for your setup- the market always gives a second chance. You need to pay attention here.
Frequently Asked Questions: USDJPY Analysis
What happens if USDJPY breaks above $159.24 resistance?
A sustained break above $159.24 would likely trigger further upside momentum, targeting the next resistance levels at $159.43 and $159.56. This scenario is contingent on continued DXY strength and no surprise announcements from the BOJ.
Should I buy USDJPY at current levels of $159.33 given the overbought Stochastic?
While the 1H chart shows bullish momentum, the overbought Stochastic oscillator suggests caution. A more conservative approach would be to wait for a pullback to the middle Bollinger Band near $159.10 before entering a long position, allowing for a more favorable entry point and a tighter stop-loss order.
Is RSI at 61.09 a strong buy signal for USDJPY right now?
An RSI of 61.09 on the 1H chart indicates increasing bullish momentum but is not yet in overbought territory. While this supports a bullish outlook, traders should also consider other factors, such as the DXY strength and the potential for geopolitical risks, before initiating a trade.
How will the upcoming GBP data affect USDJPY this week?
The upcoming GBP data is unlikely to have a direct impact on USDJPY. The primary drivers for USDJPY remain the DXY strength, BOJ policy, and geopolitical risks. However, any surprise in the GBP data could indirectly affect risk sentiment and safe-haven flows, potentially influencing USDJPY.
Track markets in real-time
AI-powered analysis, technical indicators and real-time price data.
Join Our Telegram Channel
Breaking market news, AI analysis and trading signals instantly.
Join Channel