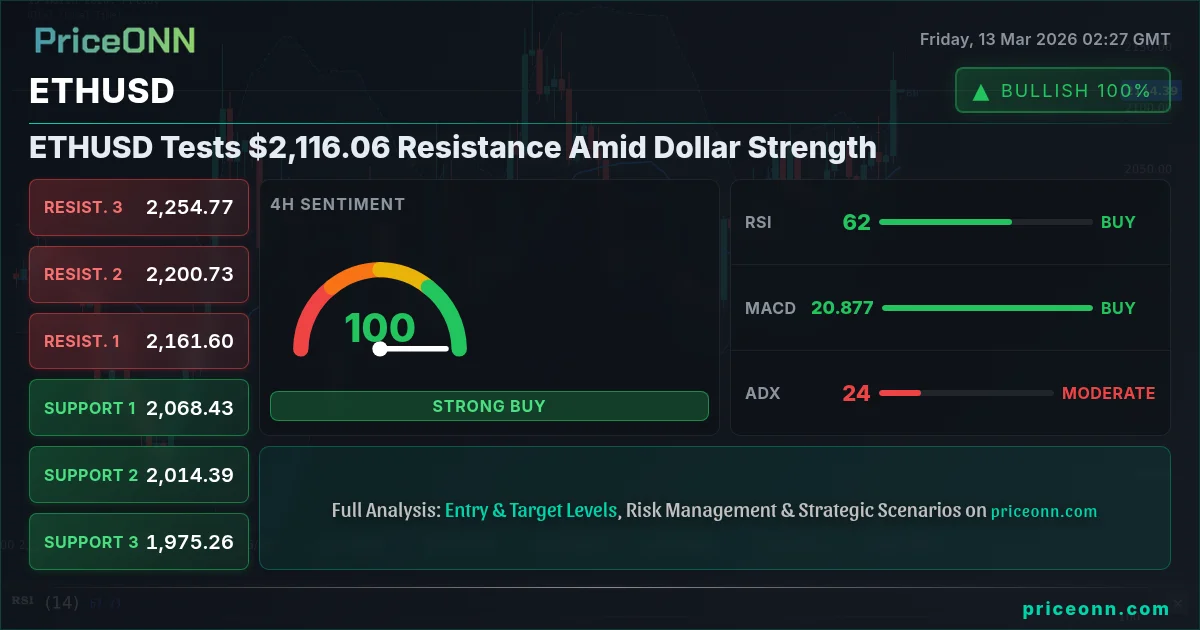
ETHUSD is currently grappling with resistance at $2,116.06, a level that could determine its short-term trajectory. The tug-of-war between bulls and bears is intensifying amid broader market dynamics, particularly the strengthening Dollar Index (DXY), which is currently at 99.46. A stronger dollar typically exerts downward pressure on cryptocurrencies, making this resistance test even more critical.
- ETHUSD is testing resistance at $2,116.06, a critical level for future price action.
- The Dollar Index (DXY) at 99.46 is exerting downward pressure on ETHUSD.
- RSI at 69.18 on the 1H chart suggests the market is approaching overbought conditions.
- A potential breakout above $2,116.06 could target $2,152.93, while failure could see a retest of $2,074.43 support.
The Bull Case for ETHUSD
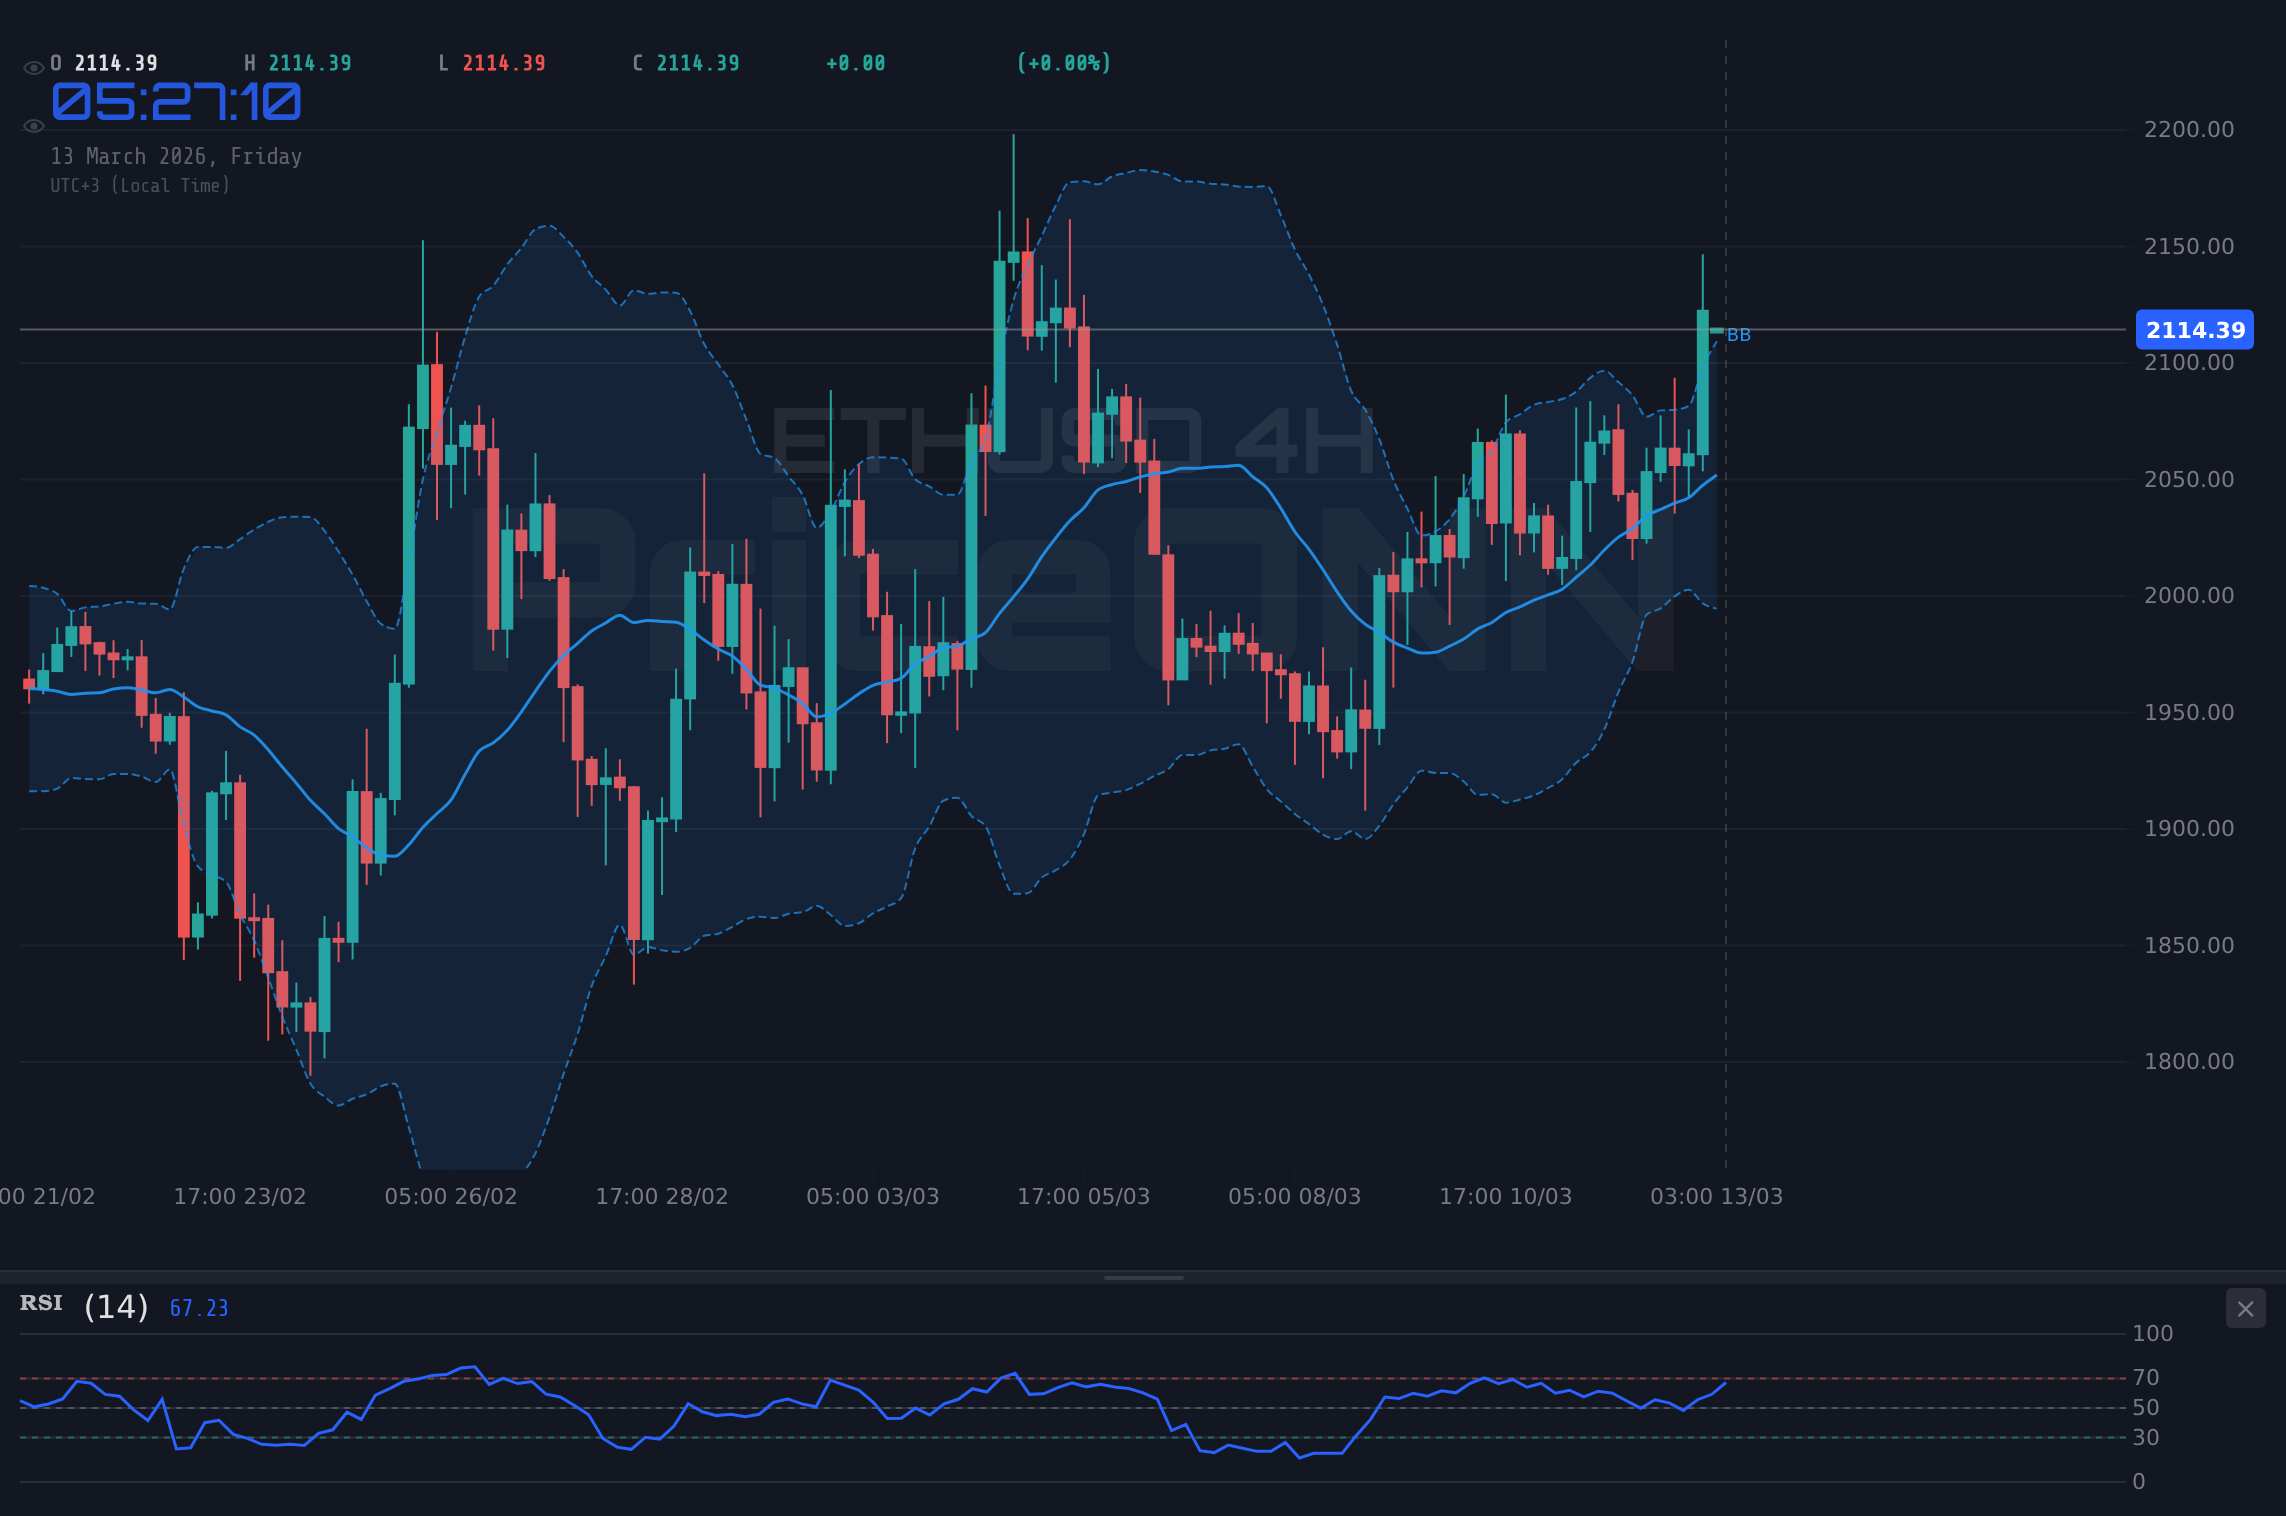
The bullish scenario hinges on ETHUSD's ability to overcome the $2,116.06 resistance. Several technical indicators suggest this is possible. On the 1-hour chart, the Stochastic oscillator shows a bullish crossover with K=68.46 and D=52.11, indicating increasing upward momentum. The MACD histogram is also positive, further supporting the bullish sentiment. Moreover, ETHUSD is trading above its middle Bollinger Band, suggesting that the price is trending upwards. A successful breakout could target the next resistance level at $2,152.93, a potential 1.7% gain from current levels. Scalpers might look for quick entries above $2,117, targeting $2,125 and $2,130 for profit taking. Swing traders could hold for a move to $2,152, while long-term investors might see this as an opportunity to add to their positions, anticipating further gains in the coming weeks.
Why $2,116.06 is the Line in the Sand
The $2,116.06 level is not just a random number; it represents a confluence of technical factors. It aligns with previous swing highs and acts as a psychological barrier for traders. A breakout above this level would signal strong bullish conviction and could trigger a wave of buying, pushing ETHUSD higher. However, failure to break above this level could lead to a double-top formation, a bearish pattern that could send ETHUSD back down to its support levels. The 1-hour RSI at 69.18 suggests that the market is approaching overbought conditions, which could lead to a temporary pullback before a potential breakout. Therefore, traders should exercise caution and wait for confirmation before entering long positions.
The Bear Case for ETHUSD
The bearish scenario is predicated on ETHUSD's inability to sustain its upward momentum and the potential for a reversal. The strengthening Dollar Index (DXY) at 99.46 is a significant headwind for ETHUSD. Historically, a stronger dollar has often led to a decline in cryptocurrency prices, as it makes them more expensive for international investors. The 4-hour RSI at 64.5, while still in neutral territory, is trending downwards, suggesting that the bullish momentum is waning. The MACD histogram, although positive, is showing signs of convergence, indicating a potential slowdown in upward momentum. Furthermore, ETHUSD is trading near the upper Bollinger Band on the 1-hour chart, which could indicate overbought conditions and a potential pullback. A failure to break above $2,116.06 could lead to a retest of the $2,074.43 support level, a potential 2% decline from current levels. A break below this support could trigger a further selloff, targeting the next support level at $2,032.07.
Correlation Analysis: DXY and ETHUSD
The inverse correlation between the Dollar Index (DXY) and ETHUSD is a key factor to consider. With DXY currently at 99.46 and showing a strong upward trend on the 1-hour chart (ADX: 33.19), ETHUSD faces significant downward pressure. The DXY's strength is driven by expectations of further interest rate hikes by the Federal Reserve, as well as increased safe-haven demand amid geopolitical tensions. A stronger dollar makes it more expensive for international investors to purchase ETHUSD, potentially dampening demand. Therefore, traders should closely monitor the DXY's movements, as it could provide valuable insights into ETHUSD's future trajectory. Any further strengthening of the DXY could exacerbate the bearish scenario for ETHUSD, while a weakening dollar could provide a much-needed boost.
Economic Calendar and Geopolitical Risks
Several high-impact economic events are scheduled for today, March 13th, which could significantly impact ETHUSD. The GBP is releasing data, and the USD has multiple releases, including Previous data. These data releases could trigger increased volatility in the market, potentially leading to sharp price swings in ETHUSD. According to Reuters, Fed officials have emphasized the need to remain data-dependent, suggesting that these economic releases could play a crucial role in shaping future monetary policy. Furthermore, geopolitical tensions in the Middle East continue to roil markets, adding to the uncertainty. As Bloomberg reported, escalating tensions could lead to increased safe-haven demand, further strengthening the dollar and putting downward pressure on ETHUSD.
ETHUSD Trade Plan
Based on the current technical picture, a cautious approach is warranted. The conflicting signals from various indicators suggest that a breakout or breakdown is imminent. Traders should wait for confirmation before entering positions. A breakout above $2,116.06, confirmed by strong volume, could signal a continuation of the bullish trend, targeting $2,152.93 and $2,189.07 as potential profit-taking levels. Conversely, a break below the $2,074.43 support level, confirmed by increased selling pressure, could signal a reversal of the bullish trend, targeting $2,032.07 and $1,995.93 as potential profit-taking levels. Stop-loss orders should be placed strategically to minimize potential losses. For long positions, a stop-loss order could be placed just below the $2,074.43 support level, while for short positions, a stop-loss order could be placed just above the $2,116.06 resistance level.
A breakout above $2,116.06, confirmed by strong volume, could signal a continuation of the bullish trend. Targets include $2,152.93 and $2,189.07. The upside scenario is further reinforced if DXY weakens below 99.00.
A break below $2,074.43, confirmed by increased selling pressure, could signal a reversal of the bullish trend. Targets include $2,032.07 and $1,995.93. The downside scenario is reinforced if DXY strengthens above 99.50.
Historical Perspective
Having tracked ETHUSD through the 2024 rate cycle, similar patterns of resistance tests followed by breakouts or breakdowns have been observed. In July 2024, ETHUSD faced resistance at $1,800, eventually breaking through after a period of consolidation. Conversely, in October 2024, ETHUSD failed to break above $2,000, leading to a significant pullback. These historical examples highlight the importance of waiting for confirmation before entering positions. The current scenario at $2,116.06 mirrors these past events, suggesting that patience and disciplined risk management are key to navigating the market.
What Different Trader Types Should Watch
Scalpers should focus on short-term price action around the $2,116.06 level, looking for quick entries and exits based on momentum. Swing traders should monitor the 4-hour chart for sustained breakouts or breakdowns, targeting larger moves with wider stop-loss orders. Long-term investors should assess the fundamental drivers of ETHUSD, such as adoption rates and regulatory developments, and use the current consolidation as an opportunity to add to their positions at attractive levels. All trader types should closely monitor the DXY and economic data releases, as these factors could significantly impact ETHUSD's trajectory.
Frequently Asked Questions: ETHUSD Analysis
What happens if ETHUSD breaks above $2,116.06 resistance?
A confirmed breakout above $2,116.06 could trigger a rally towards the next resistance level at $2,152.93, representing a potential 1.7% gain. Bullish momentum could then push towards $2,189.07 as traders target new highs.
Should I buy ETHUSD at current levels of $2,116.06 given RSI at 69.18?
Given the RSI is approaching overbought conditions, caution is warranted. A confirmed breakout above $2,116.06 with strong volume would provide a more compelling entry signal. Consider waiting for a pullback to $2,090 before entering a long position to manage risk.
Is RSI at 69.18 a sell signal for ETHUSD right now?
While RSI at 69.18 suggests the market is approaching overbought conditions, it is not a definitive sell signal. A confirmed break below the $2,074.43 support level, combined with a declining RSI, would provide a stronger indication of a potential reversal.
How will the upcoming USD data releases affect ETHUSD this week?
Stronger-than-expected USD data releases could strengthen the dollar, putting downward pressure on ETHUSD. Conversely, weaker-than-expected data could weaken the dollar, providing a boost to ETHUSD. Traders should closely monitor these releases for potential market-moving catalysts.
Technical Outlook Summary
| Indicator | Value | Signal |
|---|---|---|
| RSI (14) - 1H | 42.77 | Neutral |
| MACD Histogram - 1H | Negative | Bearish |
| Stochastic - 1H | K=59.34, D=27.47 | Bullish |
| ADX - 1H | 40.44 | Strong Trend |
| Bollinger Bands - 1H | Middle Band | Neutral |
Key Levels
Support Levels
Resistance Levels
Track markets in real-time
AI-powered analysis, technical indicators and real-time price data.
Join Our Telegram Channel
Breaking market news, AI analysis and trading signals instantly.
Join Channel