Brent Crude Eyes $100.61 Amid Mideast Tensions
Brent crude is trading near $100.61 as geopolitical risks escalate in the Middle East. Will tensions push prices higher despite mixed technical signals?
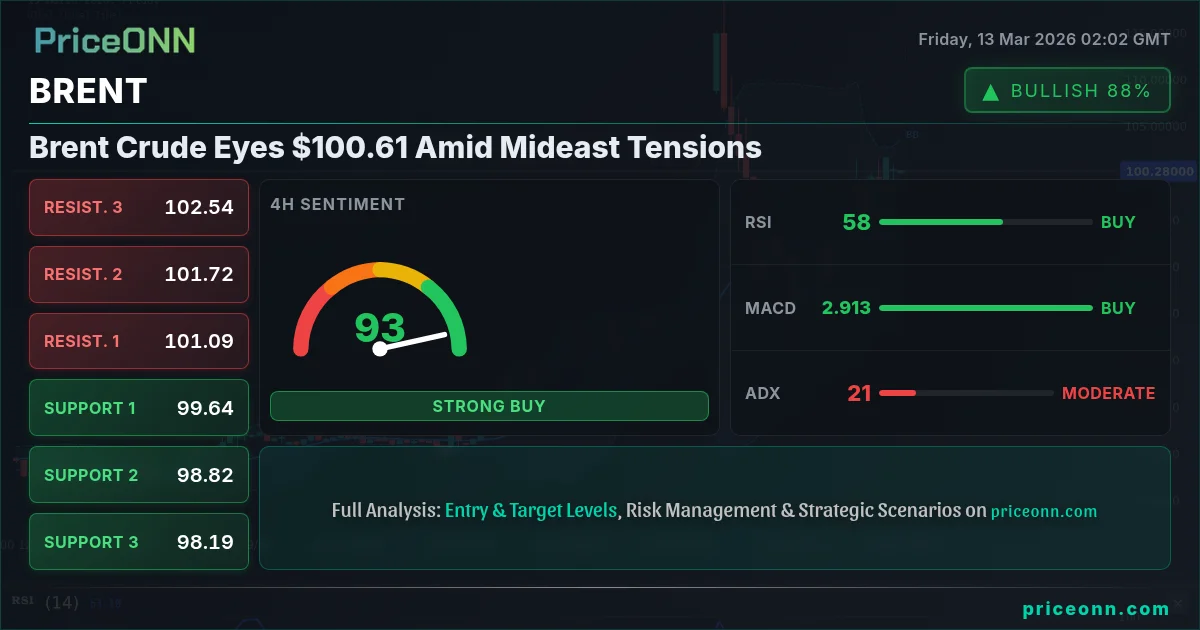
Brent crude oil is currently trading around $100.61, buoyed by escalating geopolitical tensions in the Middle East. Despite this bullish pressure, technical indicators present a mixed picture, leaving traders uncertain about the sustainability of this upward momentum. The key question is whether the fundamental drivers will outweigh the technical headwinds, pushing Brent beyond the psychological $100 barrier.
- RSI at 59.89 on the 1H chart suggests potential for further upside, but not yet in overbought territory.
- Immediate resistance sits at $101.91, a break above which could trigger further gains.
- ADX at 35.65 on the 1H chart indicates a strong uptrend, supporting bullish sentiment in the short term.
- Geopolitical tensions in the Middle East and supply disruptions are key drivers behind Brent's recent surge.
Technical Overview: A Tug-of-War
Looking at the technical picture, the 1-hour timeframe shows a neutral trend, albeit with a bullish bias. The RSI(14) stands at 59.89, indicating that while there's upward momentum, it's not yet in overbought territory. The MACD histogram is positive, suggesting buying pressure. However, the Stochastic oscillator shows a potential overbought condition, with K=85.15 and D=79.95, which could signal a short-term pullback. The ADX reads 21.09, pointing to a moderately strong uptrend.
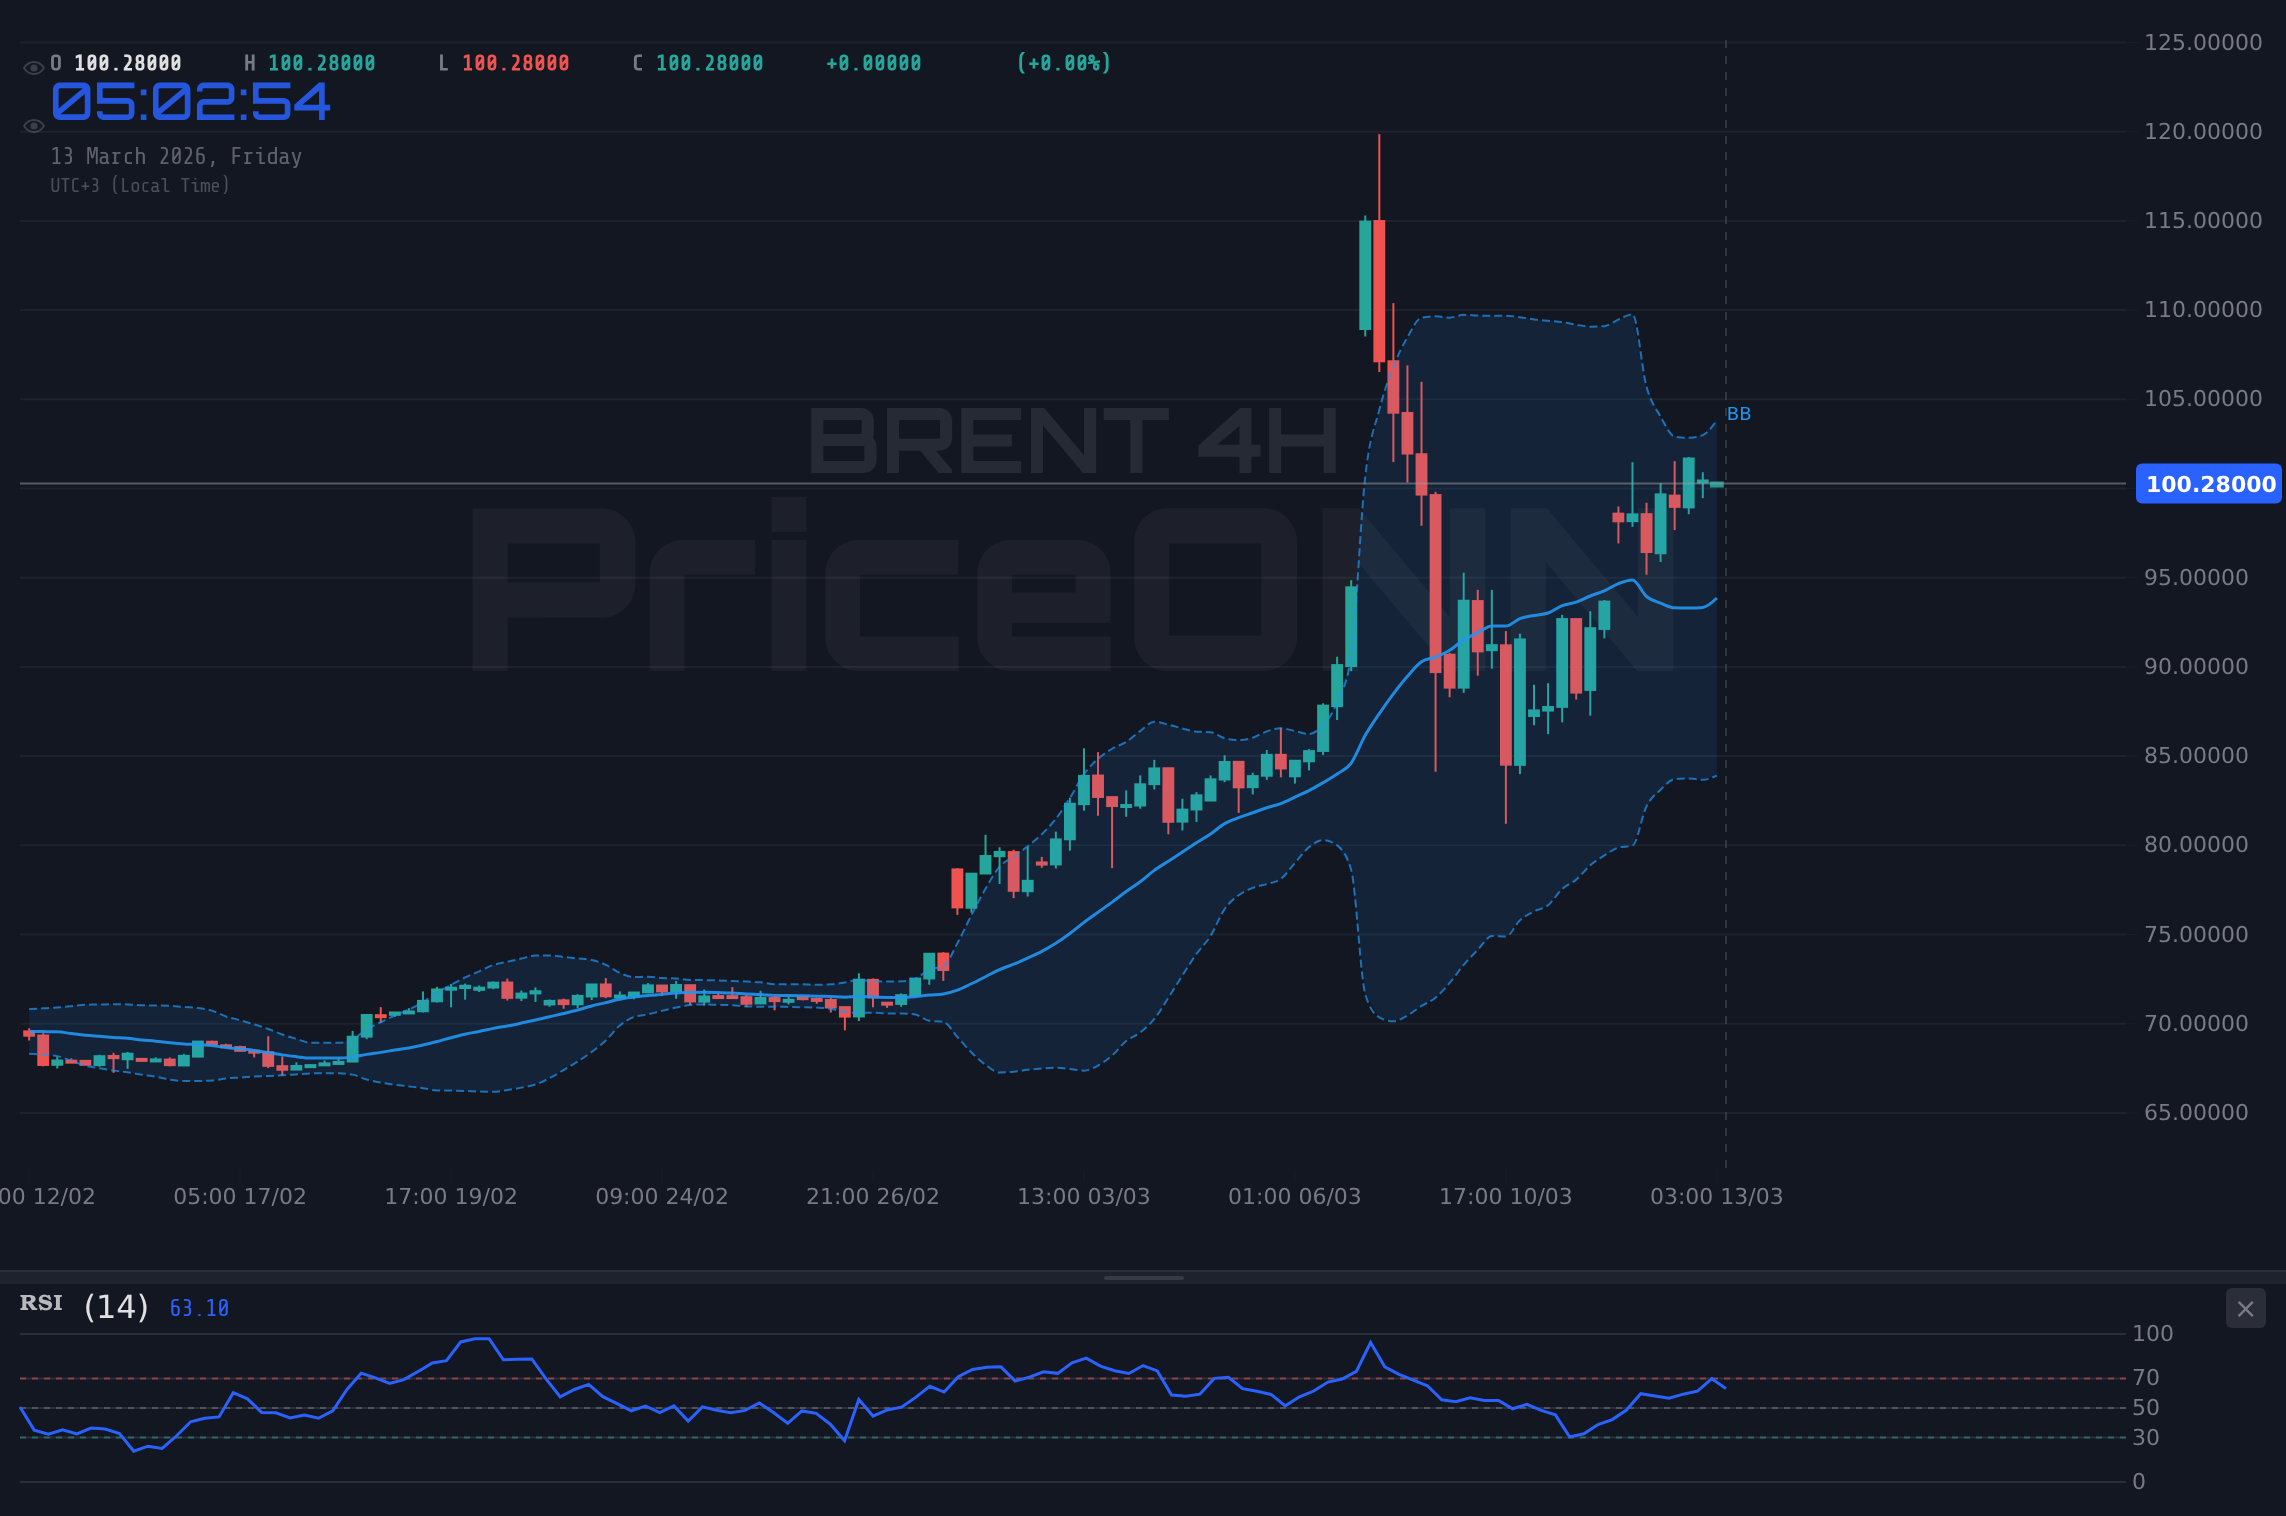
Stepping up to the 4-hour timeframe, the trend remains bullish. The RSI(14) is at 58.97, still in neutral territory. The MACD is positive, supporting the bullish outlook. The Stochastic, however, is in overbought territory (K=91.33, D=85.53), suggesting a potential correction. The ADX is at 21.19, again indicating a moderately strong uptrend. These conflicting signals highlight the need for caution, as the market could be poised for either a continuation of the rally or a near-term retracement.
On the daily chart, the trend remains bullish. The RSI(14) is lofty at 86.11, firmly in overbought territory, indicating that Brent may be overextended. The MACD is positive, but the Stochastic shows a potential downturn (K=48.71, D=65.39), adding to the mixed signals. The ADX is at 53.84, signaling a very strong uptrend. This divergence between the momentum indicators and the trend strength suggests that while the overall trend is up, a pullback could be imminent.
Key Price Levels to Watch
Immediate support on the 1-hour chart lies at $101.26, followed by $100.85 and $100.61. These levels will be crucial in determining whether the bulls can maintain control. A break below $100.61 could open the door to further downside. On the resistance side, the immediate target is $101.91, followed by $102.15 and $102.56. Clearing $101.91 could lead to a test of higher levels, potentially reaching $103 and beyond.
On the 4-hour chart, key support levels are $99.57, $97.47, and $96.37. Resistance levels are $102.77, $103.87, and $105.97. These broader levels suggest that any pullback could find support in the high $90s, while further gains could target the $103-$106 range.
The daily chart reveals support at $88.68, $83.69, and $81.16, and resistance at $96.20, $98.73, and $103.72. The fact that the price is already above the $96.20 resistance is significant, suggesting that the next target could be $98.73 and potentially $103.72 if the bullish momentum persists.
Trade Strategy Amidst Geopolitical Uncertainty
Given the mixed technical signals and the strong fundamental drivers, a cautious approach is warranted. The price action is heavily influenced by geopolitical events, making technical analysis less reliable. However, a potential trade setup could involve waiting for a pullback to the $100.85 support level on the 1-hour chart. A long position could then be initiated with a stop-loss just below $100.61, targeting the $101.91 resistance level initially, and $102.56 as the second target. This approach allows traders to capitalize on the bullish momentum while managing risk in a volatile environment.
If Brent breaks above the immediate resistance at $101.91, the next target would be $102.56. A sustained move above this level could open the door to a test of $103.72 on the daily chart. This scenario is contingent on continued geopolitical tensions and no significant increase in supply.
If Brent fails to hold the $100.61 support, a decline to $99.57 on the 4-hour chart becomes likely. A break below this level could trigger a deeper correction towards $97.47. This scenario could materialize if geopolitical tensions ease or if there is a surprise increase in oil supply.
The IEA's recent report of supply disruptions, compounded by the ongoing conflict in Ukraine, adds another layer of complexity to the oil market. According to Reuters, "Oil prices have soared due to concerns about supply disruptions, but the market remains highly volatile." This volatility underscores the need for careful risk management and a nimble trading approach.
With the DXY (Dollar Index) currently at 99.47, a strengthening dollar could put downward pressure on Brent, as oil is typically priced in dollars. Traders should monitor the DXY closely for any significant moves that could impact Brent's price action. The decline in SP500 by 0.95% indicates a risk-off environment, which could support safe-haven assets and potentially weigh on riskier assets like oil. This is especially true if investors begin to worry about the global economy.
The upcoming GBP economic data release today could also add volatility to the market. Traders should be prepared for potential price swings following the announcement. Furthermore, the trend in the brent prognose has recently increased, indicating a growing search volume for Brent price predictions.
Economic Calendar and Potential Catalysts
Several key economic data releases are on the horizon that could impact Brent's price. The upcoming USD data release could provide further clues about the Fed's policy outlook, influencing the dollar's strength and subsequently affecting oil prices. Traders should also monitor any developments in the Middle East, as geopolitical tensions remain a significant driver of oil market volatility. The US Dollar Index is approaching the key 100 level as escalating tensions in the Middle East fuel safe-haven demand.
Trading Plan: Navigating the Volatility
Given the current market conditions, a well-defined trading plan is essential. Here's a potential strategy:
- Entry Trigger: Wait for a pullback to the $100.85 support level on the 1-hour chart.
- Stop-Loss: Place a stop-loss order just below $100.61 to limit potential losses.
- Target 1: Aim for the $101.91 resistance level as the initial target.
- Target 2: If the bullish momentum persists, target the $102.56 resistance level.
- Position Sizing: Adjust the position size based on your risk tolerance and account size. A general guideline is to risk no more than 1-2% of your capital on any single trade.
Risk Management Considerations
Trading oil can be highly risky due to its inherent volatility. Geopolitical events, economic data releases, and unexpected supply disruptions can all trigger sudden and significant price swings. It's crucial to implement a robust risk management strategy to protect your capital. Always use stop-loss orders, avoid over-leveraging your account, and be prepared to adjust your positions based on changing market conditions. Remember, capital preservation is paramount.
Frequently Asked Questions: BRENT Analysis
What happens if BRENT breaks above $101.91 resistance?
If Brent breaks above the $101.91 resistance, it could trigger a further rally towards $102.56 and potentially $103.72 on the daily chart. This scenario is contingent on continued geopolitical tensions and stable or declining supply levels.
Should I buy BRENT at current $100.61 levels given RSI at 59.89?
Given the RSI at 59.89 on the 1H chart, buying at current levels is a moderately bullish setup. However, waiting for a pullback to $100.85 support could offer a better entry point with reduced risk, assuming the support holds. Risk should be managed closely with a stop-loss below $100.61.
Is Stochastic in overbought territory a sell signal for BRENT?
The Stochastic oscillator being in overbought territory does suggest a potential for a short-term pullback. However, it's not a definitive sell signal on its own. Traders should look for confirmation from other indicators or price action, such as a break below the $100.85 support level, before initiating a short position.
How will the upcoming USD data affect BRENT this week?
The upcoming USD data releases could influence the dollar's strength, which in turn affects Brent's price, as oil is typically priced in USD. Stronger-than-expected USD data could strengthen the dollar, putting downward pressure on Brent, while weaker data could weaken the dollar, supporting Brent's price.
Technical Outlook Summary
| Indicator | Value | Signal |
|---|---|---|
| RSI (14) | 59.89 | Neutral |
| MACD Histogram | Positive | Bullish |
| Stochastic | 85.15/79.95 | Overbought |
| ADX | 21.09 | Moderate Uptrend |
| Bollinger | Middle Band | Watch |
Key Levels
Support Levels
Resistance Levels
Track markets in real-time
AI-powered analysis, technical indicators and real-time price data.
Join Our Telegram Channel
Breaking market news, AI analysis and trading signals instantly.
Join Channel