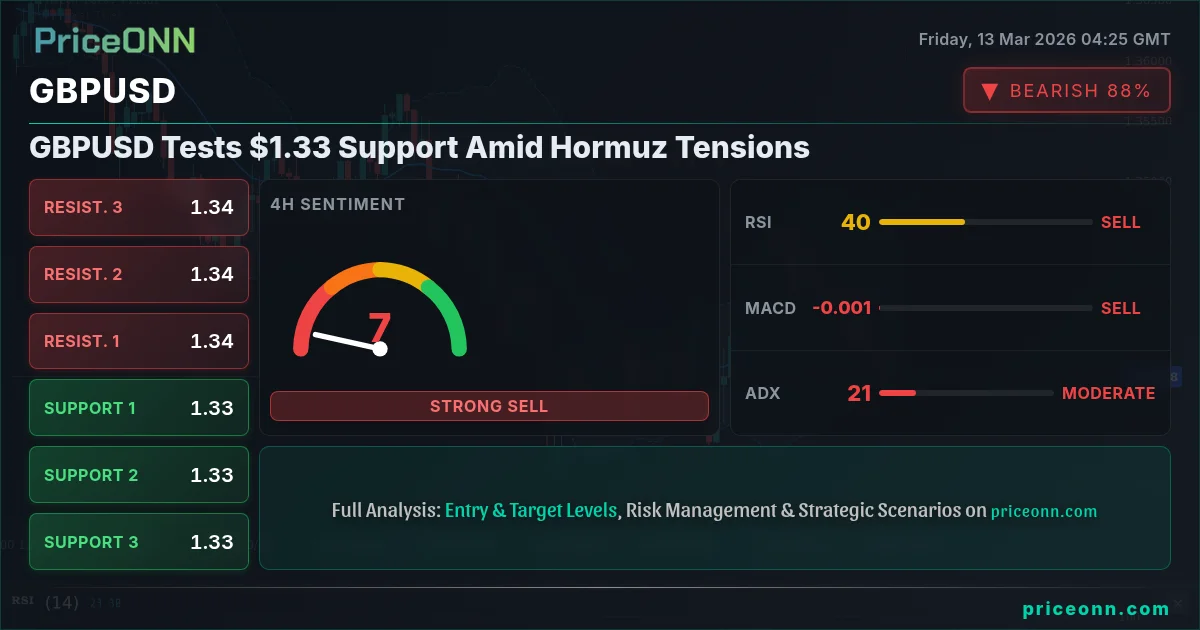
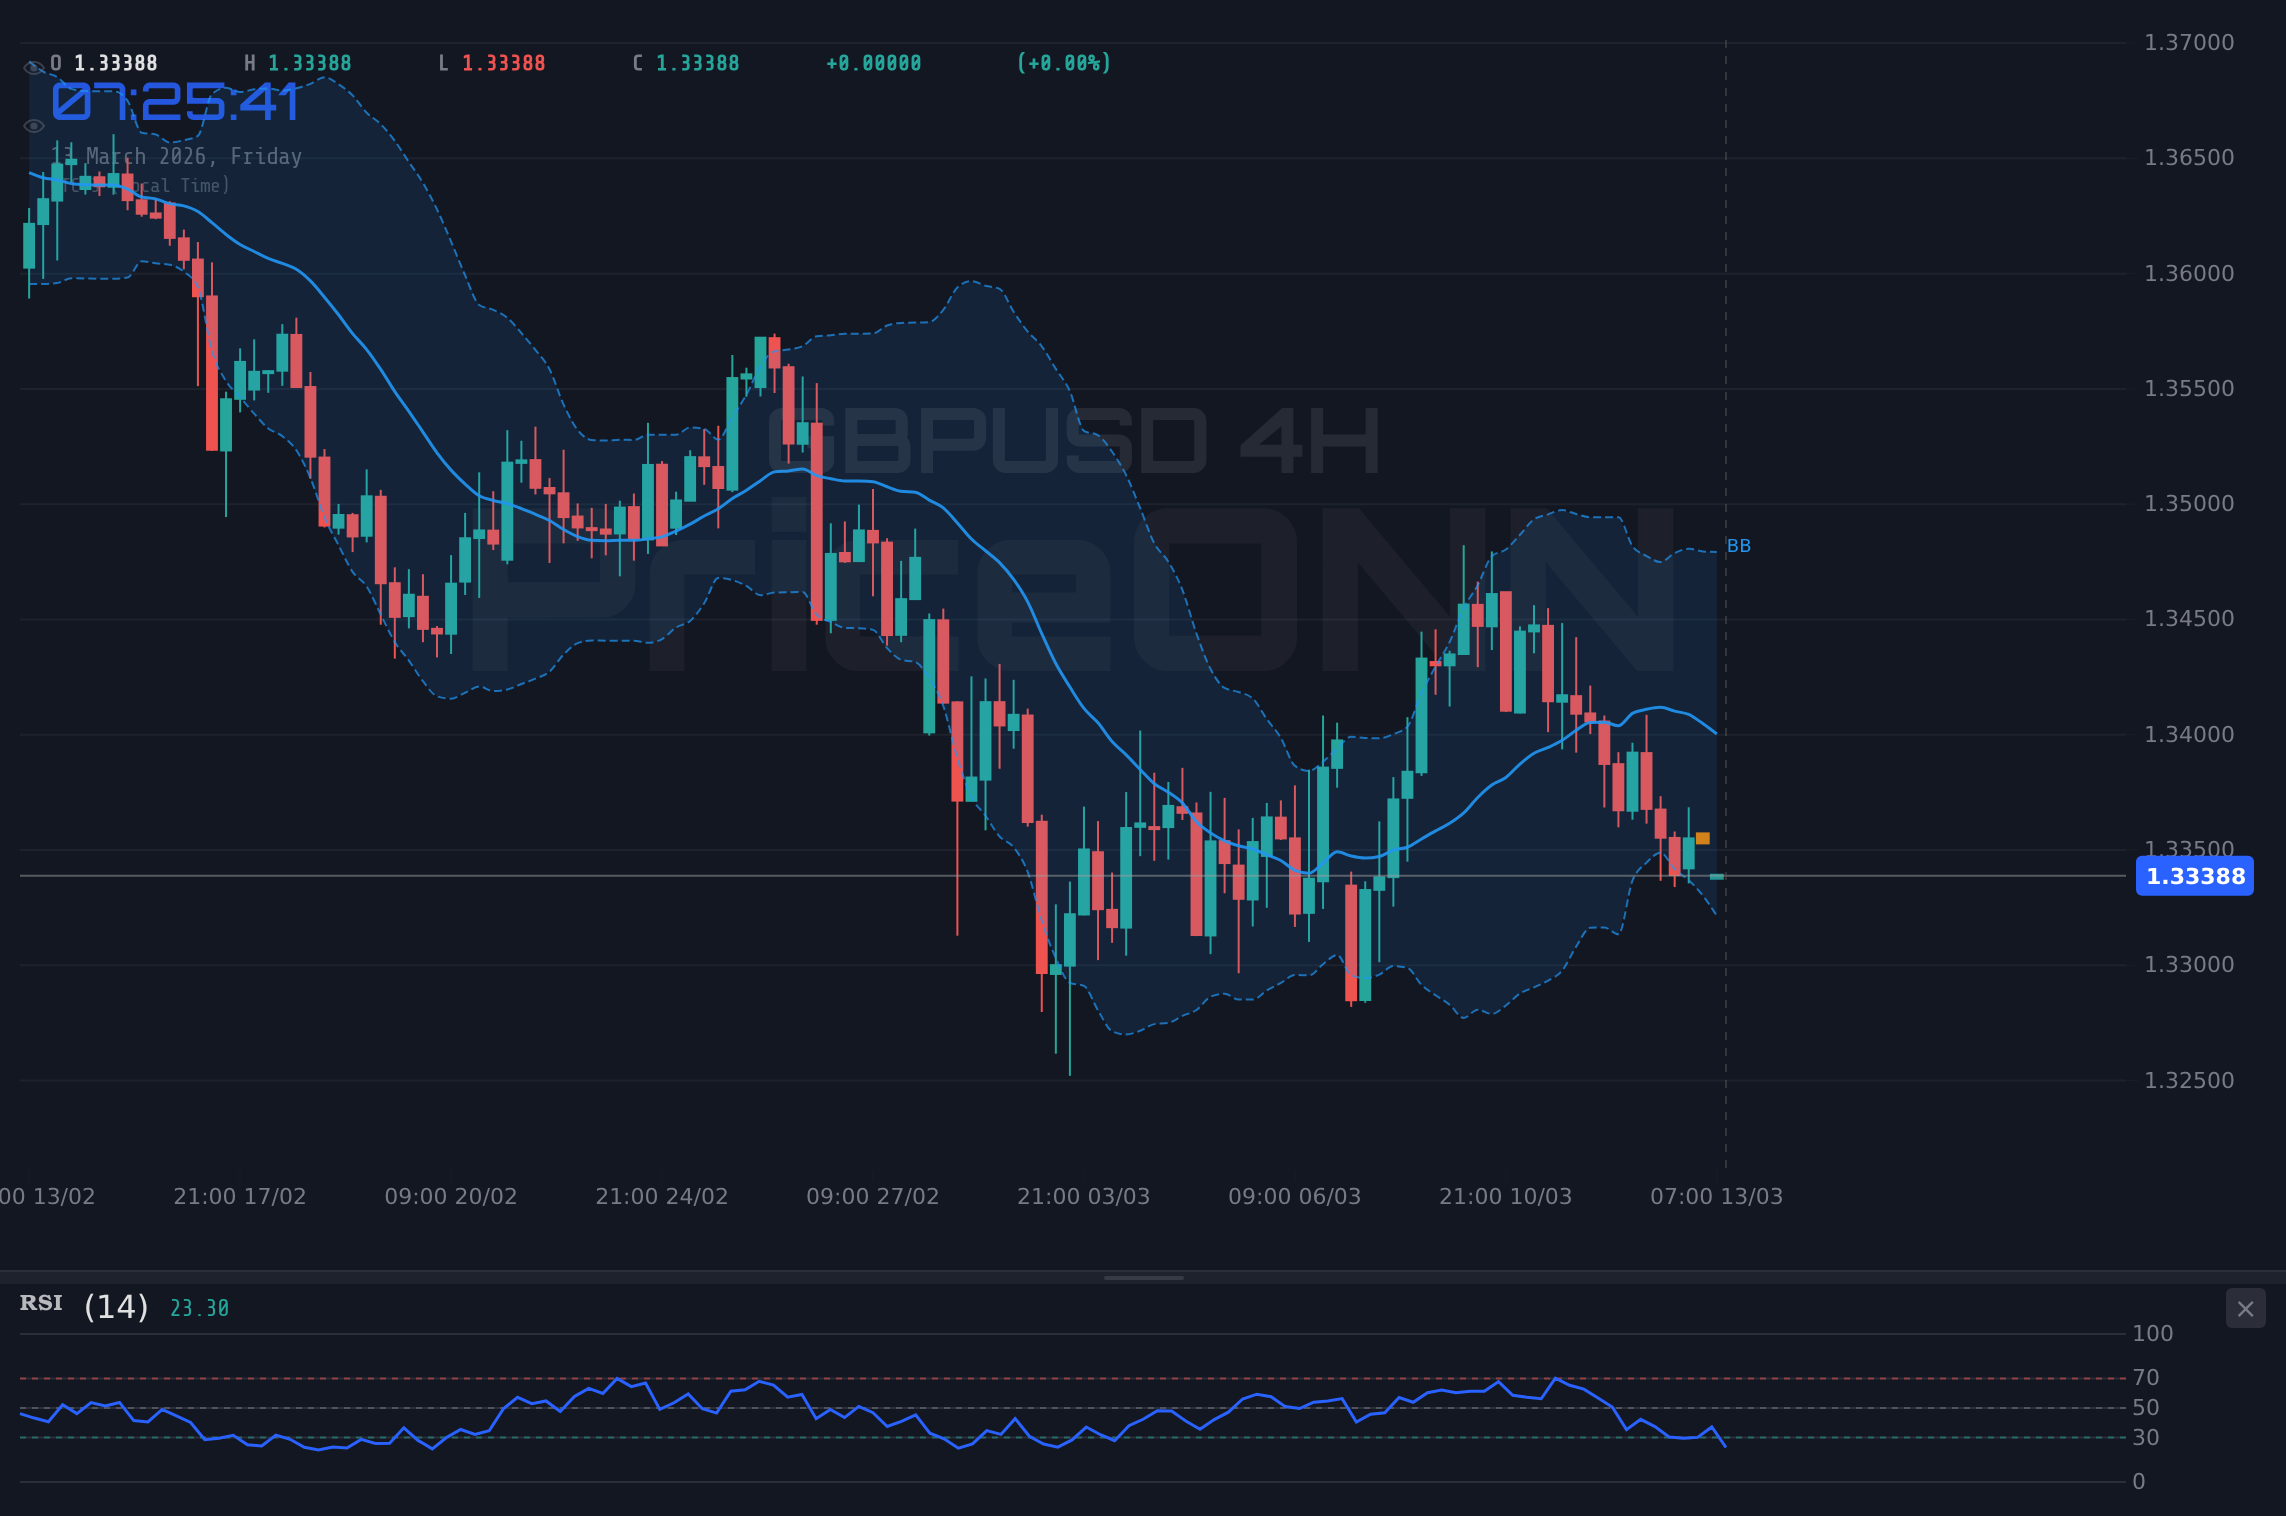
GBPUSD is currently testing support near $1.33 as escalating tensions in the Strait of Hormuz fuel a surge in oil prices and increase risk aversion. Traders are closely watching whether this key level will hold, or if a breakdown will trigger further downside.
The recent surge in oil prices, triggered by Iran's threat to blockade the Strait of Hormuz, has injected significant volatility into global markets. According to recent news, WTI crude oil is eyeing $100 as these tensions escalate. This geopolitical uncertainty is driving safe-haven demand for the US Dollar, putting pressure on GBPUSD. Macroeconomic factors such as interest rate differentials and overall market sentiment are also contributing to the pair's bearish momentum. GBPUSD today analysis reveals a confluence of technical and fundamental factors pointing to further downside potential.
The Bear's Grip: Breakdown Below $1.33
The bearish scenario for GBPUSD hinges on a sustained break below the $1.33 level. On the 1-hour chart, the RSI sits at 40.44, indicating that there is still room for further downside before the pair becomes oversold. The ADX at 26.98 suggests a strong bearish trend is in play. If GBPUSD breaks below the immediate support at 1.33439, the next target would be 1.3337, followed by 1.33285. A breach of these levels could open the door for a move towards the daily support at 1.33125. This scenario is likely if risk aversion continues to dominate market sentiment and the dollar index remains elevated.
The Bull's Defense: Holding Above $1.33
The bullish scenario depends on GBPUSD successfully defending the $1.33 support level. A bounce from this level could signal a potential short-term reversal. The Stochastic indicator on the 1H chart currently shows K=47.78, D=49.73, indicating a potential oversold condition. If GBPUSD can hold above 1.33, the initial target would be the resistance at 1.33593, followed by 1.33678. A successful break above these levels could pave the way for a test of the daily resistance at 1.33872. However, this scenario is less likely given the current geopolitical climate and dollar strength.
The Waiting Game: Consolidation at $1.33
A neutral scenario involves GBPUSD consolidating around the $1.33 level. This could occur if market participants await further clarity on the Middle East situation or upcoming economic data releases. The ADX on the 1D chart is at 28.22, signalling a strong downtrend. A period of consolidation could see the pair trade within a tight range between the immediate support at 1.33439 and the resistance at 1.33593. This scenario is possible if there is a temporary lull in geopolitical tensions or if economic data releases provide mixed signals.
Most Likely Scenario: Bearish Breakdown (60% Probability)
Given the current geopolitical landscape and the strength of the US Dollar, the bearish scenario appears to be the most likely outcome. The escalating tensions in the Strait of Hormuz are fueling risk aversion, driving safe-haven demand for the dollar and putting pressure on GBPUSD. Technically, the pair is trading below its 200-day moving average, and the RSI on the daily chart is trending downwards. The Stochastic indicator on the 1H chart also confirms the bearish momentum.
If GBPUSD holds above $1.33, look for a move towards $1.33593, then $1.33678. A break above $1.33872 targets $1.34352 this week.
A break below $1.33439 triggers a move towards $1.3337, then $1.33285. A daily close below $1.33125 targets $1.32858 this week.
Trade Plan: Short GBPUSD
Based on the bearish outlook, a short trade on GBPUSD is recommended.
Upcoming USD releases on Friday could significantly impact GBPUSD. Manage risk accordingly.
Key Levels to Watch
Traders should closely monitor the following levels:
- Immediate Support: 1.33439
- Strong Support: 1.33125
- Immediate Resistance: 1.33593
- Strong Resistance: 1.33872
Key Levels
Support Levels
Resistance Levels
Technical Outlook
A multi-timeframe analysis reveals a mixed picture for GBPUSD. The 1-hour and 4-hour charts show bearish momentum, while the daily chart indicates potential for a reversal. Traders should exercise caution and wait for confirmation before entering new positions. The ADX on the 1H chart is at 26.98, reinforcing the bearish trend. The Stochastic indicator on the 1H chart, however, shows K=47.78 and D=49.73, suggesting the pair may be oversold. The RSI on the 1D chart is at 38.04, signaling that the pair is approaching oversold conditions, but further downside is still possible.
Technical Outlook Summary
| Indicator | Value | Signal |
|---|---|---|
| RSI (14) - 1H | 40.44 | Bearish |
| MACD Histogram - 1H | Positive | Bullish |
| Stochastic - 1H | K=47.78, D=49.73 | Neutral |
| ADX - 1H | 26.98 | Strong Downtrend |
| RSI (14) - 1D | 38.04 | Bearish |
If GBPUSD holds above $1.33, look for a move towards $1.33593, then $1.33678. A break above $1.33872 targets $1.34352 this week.
A break below $1.33439 triggers a move towards $1.3337, then $1.33285. A daily close below $1.33125 targets $1.32858 this week.
Trade Plan: Short GBPUSD
Based on the bearish outlook, a short trade on GBPUSD is recommended.
GBPUSD Short Trade Setup
Entry Trigger: Break and close below 1.33439 on the 1H chart
Target 1: 1.3337
Target 2: 1.33285
Stop/Invalidation: 1.33593
Probability: 60%
Upcoming USD releases on Friday could significantly impact GBPUSD. Manage risk accordingly.
Frequently Asked Questions: GBPUSD Analysis
What happens if GBPUSD breaks below $1.33439 support?
If GBPUSD breaks below the $1.33439 support, it could trigger a move towards the next support levels at 1.3337 and 1.33285, according to the 1H chart analysis. This scenario is more likely given the current geopolitical tensions and dollar strength.
Should I sell GBPUSD at current levels of $1.33 given the RSI at 40.44?
With the RSI at 40.44 on the 1H chart, there is still room for further downside before GBPUSD becomes oversold. A short trade is recommended if the pair breaks below 1.33439, targeting 1.3337 and 1.33285, with a stop-loss at 1.33593.
Is the ADX at 26.98 a strong enough signal to short GBPUSD?
The ADX at 26.98 on the 1H chart signals a strong downtrend, supporting the bearish outlook for GBPUSD. However, traders should also consider other indicators and potential catalysts before entering a short position.
How will the upcoming USD releases on Friday affect GBPUSD this week?
Upcoming USD releases on Friday could inject significant volatility into GBPUSD. Stronger-than-expected data could further strengthen the dollar, putting additional pressure on GBPUSD, while weaker-than-expected data could provide a temporary respite for the pair.
What I'm Watching
Key triggers to watch this week include:
- Geopolitical developments in the Middle East
- USD releases on Friday
- GBPUSD price action around the $1.33 level
Track markets in real-time
AI-powered analysis, technical indicators and real-time price data.
Join Our Telegram Channel
Breaking market news, AI analysis and trading signals instantly.
Join Channel