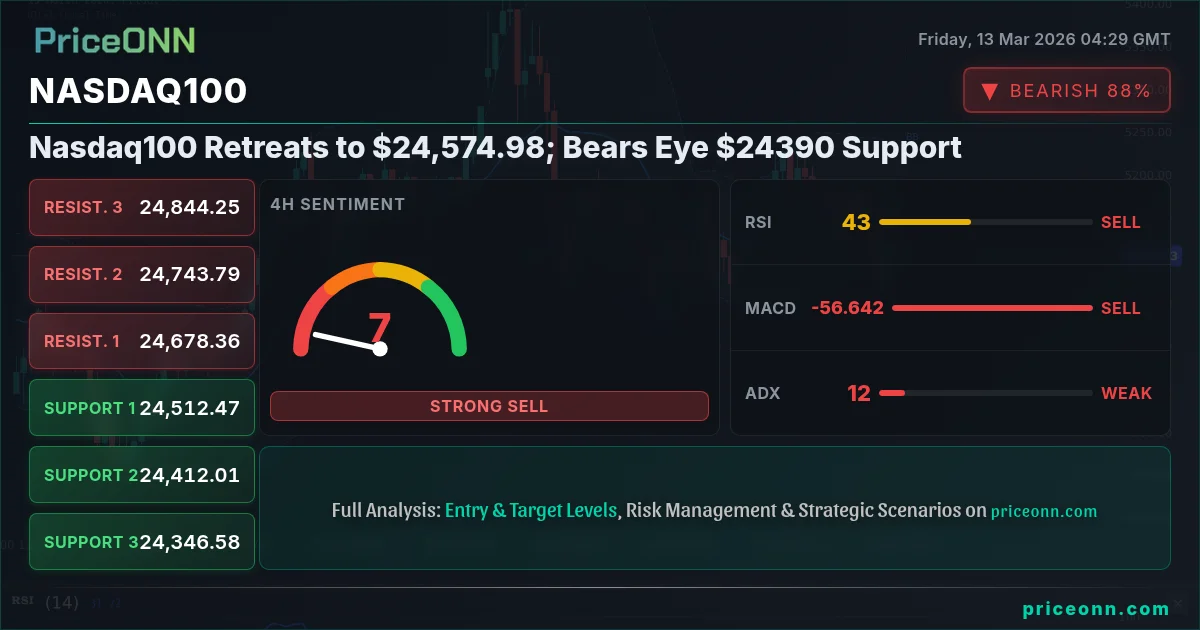
The Nasdaq100 is currently navigating choppy waters, hovering around $24,574.98, as bears test the critical $24390 support level. This level is crucial for determining the short-term direction of the index. A break below could signal further declines, while a hold could pave the way for a rebound. The market's overall risk sentiment, influenced by geopolitical tensions and upcoming economic data, adds another layer of complexity to the analysis.
- The Nasdaq100 is currently trading at $24,574.98, facing pressure at the $24390 support level.
- RSI at 39.44 on the 1H chart suggests potential for further downside before oversold conditions are reached.
- A daily close above $24630.93 resistance could trigger a bullish reversal towards $24805.31.
- Geopolitical tensions and upcoming USD economic data are key drivers impacting Nasdaq100's correlation with DXY.
The Battleground: $24390 Support
The $24390 level is more than just a price point; it's a battleground where bulls and bears are fiercely contesting control. This support has been tested multiple times, and each test weakens its integrity. The daily chart reveals a descending triangle pattern, with the $24390 level acting as the horizontal base. A decisive break below this base would confirm the pattern and potentially trigger a significant sell-off. The key question is whether the bulls can muster enough strength to defend this crucial level.
The Bull's Roadmap: A Rebound Scenario
For the bulls to regain control, several conditions need to align. First and foremost, they must defend the $24390 support level. A failure to do so would embolden the bears and open the door for further declines. If the bulls can hold this level, the next step is to break above the immediate resistance at $24630.93. This level represents the upper boundary of the recent trading range and a significant hurdle for the bulls to overcome. A sustained break above $24630.93, confirmed by increased volume, could signal a shift in momentum and pave the way for a rally towards $24805.31. The 1H chart shows Stochastic at 54.38, indicating upward momentum, which could help the bulls in the short term.
Where Bears Take Control: The Downside Risks
The bearish scenario unfolds if the $24390 support fails to hold. A decisive break below this level would confirm the descending triangle pattern and trigger a potential sell-off. The initial target for the bears would be the $24235.4 support level, followed by $23975.09. The daily RSI at 43.25 suggests there's room for further downside before the index reaches oversold conditions. Furthermore, the daily MACD shows negative momentum, reinforcing the bearish outlook. The escalating geopolitical tensions, particularly the threats in the Strait of Hormuz, could also fuel risk aversion and exacerbate the sell-off in equities. Reuters reported that Fed officials are closely watching inflation, so a higher-than-expected USD inflation reading could also negatively impact the Nasdaq100.
The Waiting Game: A Range-Bound Scenario
The third scenario involves a continuation of the current range-bound trading. In this scenario, the Nasdaq100 remains trapped between the $24390 support and the $24630.93 resistance. The weak trend indicated by the ADX at 11.98 on the 4H chart supports this possibility. A range-bound market is characterized by sideways price action, with neither the bulls nor the bears able to establish a clear dominance. This scenario is often frustrating for traders, as breakouts are often followed by false starts. Patience and disciplined risk management are crucial in such an environment. The key is to wait for a decisive break above resistance or below support before committing to a directional trade.
Scenario Probabilities and Key Triggers
Considering the current technical and fundamental factors, the bearish scenario appears to be the most likely, with an estimated probability of 45%. The descending triangle pattern and the negative momentum indicators suggest that the bears have a slight edge. The bullish scenario is assigned a probability of 30%, contingent on the bulls successfully defending the $24390 support and breaking above the $24630.93 resistance. The range-bound scenario is given a probability of 25%, reflecting the possibility of continued indecision in the market.
Key Triggers to Watch This Week
Several key triggers could influence the direction of the Nasdaq100 this week. First, keep a close eye on the $24390 support level. A decisive break below this level would confirm the bearish scenario. Second, monitor the $24630.93 resistance. A sustained break above this level could signal a bullish reversal. Third, pay attention to any escalations in geopolitical tensions, particularly in the Middle East, as these could fuel risk aversion and weigh on equities. Finally, USD economic data on Friday will be watched closely by investors.
Trading involves risk. Always use stop-loss orders and manage your risk appropriately. The information provided in this analysis is for informational purposes only and should not be considered financial advice.
Technical Outlook Summary
Technical Outlook Summary
| Indicator | Value | Signal |
|---|---|---|
| RSI (14) | 39.44 | Bearish |
| MACD Histogram | Negative | Bearish |
| Stochastic | 54.38 | Neutral |
| ADX (4H) | 11.98 | Weak Trend |
| Bollinger | Middle Band | Bearish |
Key Levels
Key Levels
Support Levels
Resistance Levels
Frequently Asked Questions: Nasdaq100 Analysis
What happens if Nasdaq100 breaks below $24390 support?
If Nasdaq100 decisively breaks below the $24390 support level, it would confirm the descending triangle pattern and likely trigger a sell-off. The next support levels to watch would be $24235.4 and then $23975.09, based on the provided market data.
Should I buy Nasdaq100 at current levels of $24,574.98 given RSI at 39.44?
Given the current price of $24,574.98 and an RSI of 39.44 on the 1H chart, it's not advisable to buy aggressively. The RSI suggests there's still room for further downside before the index reaches oversold conditions. It's better to wait for confirmation of a reversal or a break above resistance before entering a long position.
Is the MACD signal bearish for Nasdaq100 on the daily chart?
Yes, the daily MACD shows negative momentum, indicating a bearish signal for Nasdaq100. This suggests that the downward trend is likely to continue, at least in the short term. Traders should be cautious and consider potential shorting opportunities or wait for a confirmed bullish reversal before buying.
How will the upcoming USD economic data affect Nasdaq100 this week?
Upcoming USD economic data could significantly impact Nasdaq100. Stronger-than-expected data could lead to a stronger dollar and potentially weigh on Nasdaq100, while weaker-than-expected data could have the opposite effect. Traders should closely monitor the data releases and adjust their positions accordingly.
Track markets in real-time
AI-powered analysis, technical indicators and real-time price data.
Join Our Telegram Channel
Breaking market news, AI analysis and trading signals instantly.
Join Channel