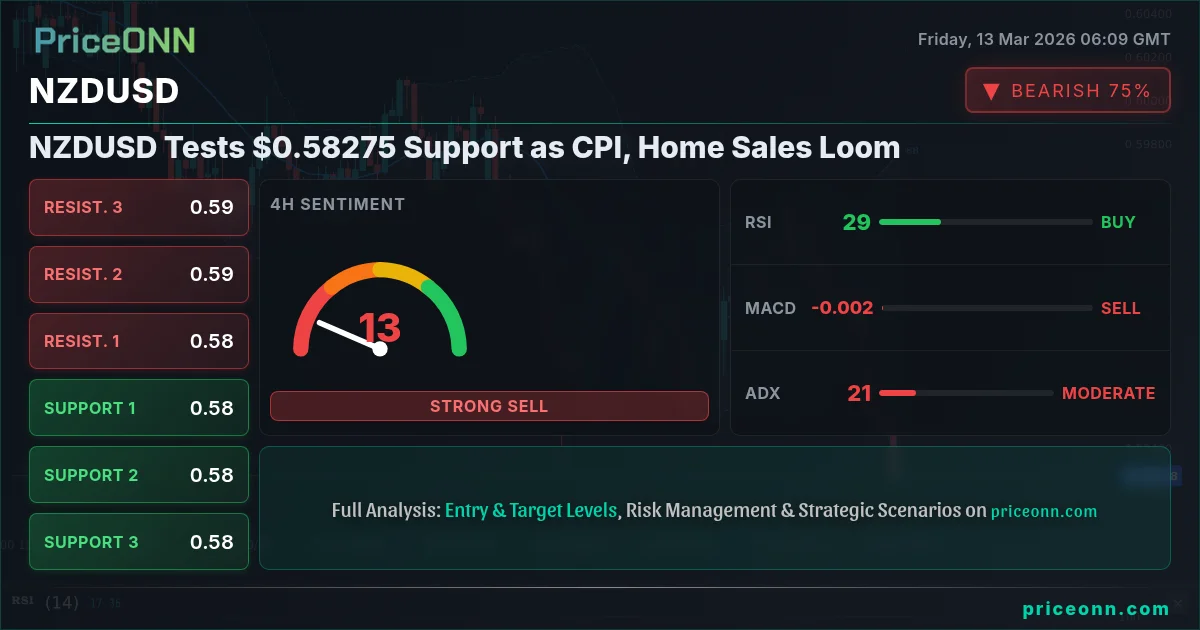
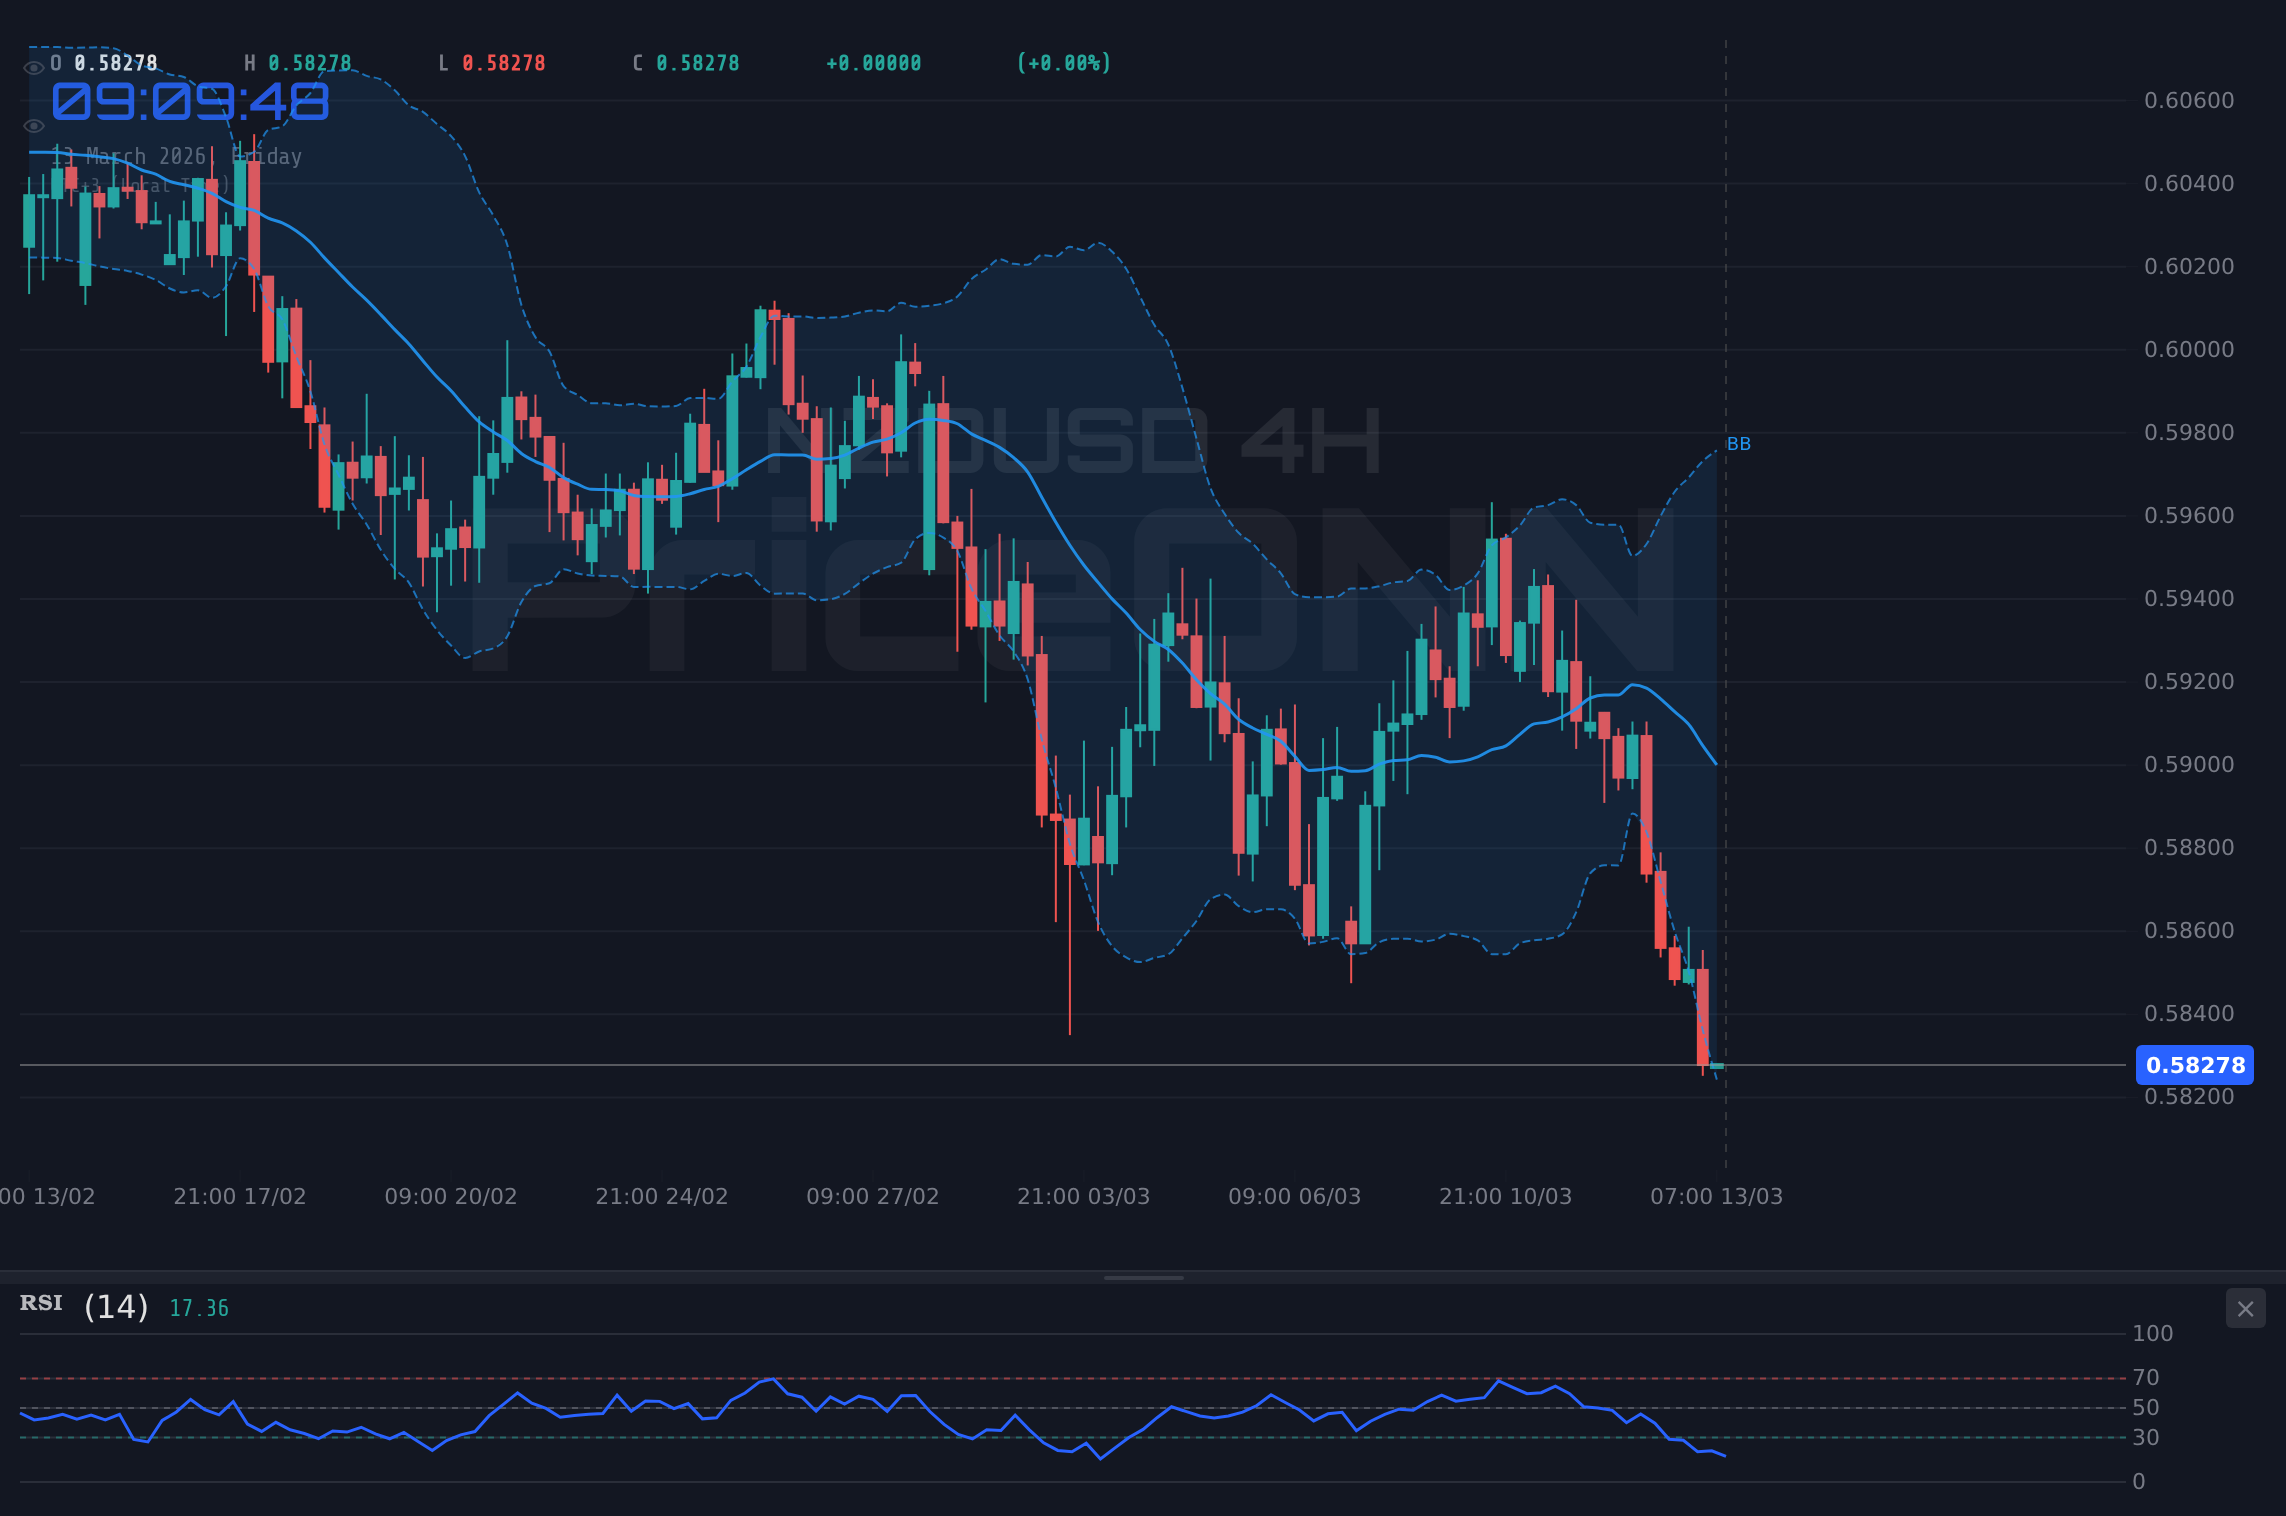
NZDUSD is currently trading at $0.58275, a level that is being closely watched by traders. The kiwi is under pressure amid a strengthening US dollar and risk-off sentiment in global markets. The key question now is whether this support will hold, or if the pair is poised for a further decline.
- RSI at 36.29 on the daily chart signals potential for further downside pressure.
- Critical support level sits at $0.5826, a break below could trigger a sell-off.
- MACD histogram shows negative momentum, indicating bearish sentiment is building.
- Upcoming CPI and home sales data from the US driving NZDUSD correlation with DXY.
Having tracked NZDUSD through the 2024 rate cycle, it's clear that the pair is highly sensitive to shifts in global risk sentiment and US dollar strength. The current environment favors the dollar, with the DXY index at 99.61, showing a 0.21% daily increase. This puts direct pressure on NZDUSD.
The Bull's Roadmap: A Recovery Scenario
Despite the current bearish pressure, a bullish scenario remains possible. If NZDUSD can hold above the immediate support at $0.58238 on the 1-hour chart, a recovery could be in the cards. A sustained break above the 1-hour resistance at $0.58394 would signal renewed bullish momentum. The first target for the bulls would be $0.58498, followed by $0.5855. This scenario is contingent on a weakening US dollar and improved risk appetite in global markets. A positive surprise in upcoming economic data, such as a weaker-than-expected CPI print, could provide the catalyst for such a move. However, given the current market conditions, this scenario has a lower probability.
A key trigger for this bullish scenario would be a break above the 20-day EMA, which currently sits near $0.5840. This level has acted as a significant resistance in recent days, and a successful breach could attract further buying interest.
Where Bears Take Control: The Downside Case
The bearish scenario appears more likely given the current technical and fundamental backdrop. The 1-hour chart shows a strong downtrend with an ADX of 43.22, indicating significant bearish momentum. If NZDUSD breaks below the immediate support at $0.58238, the next target for the bears would be $0.58186, followed by $0.58082. A sustained break below $0.58082 could trigger a more significant sell-off, potentially pushing the pair towards the daily support level at $0.5826. The RSI on the 1-hour chart is currently in oversold territory at 18.2, which suggests that the pair may be due for a short-term bounce. However, the overall trend remains bearish, and any such bounce is likely to be short-lived.
A key trigger for the bearish scenario would be a negative surprise in the upcoming home sales data. This could further fuel concerns about the US economy and strengthen the US dollar, putting additional pressure on NZDUSD.
The Waiting Game: A Range-Bound Scenario
A third, less likely, scenario is a period of consolidation within a defined range. This could occur if the market awaits further clarity from upcoming economic data releases. In this scenario, NZDUSD would likely trade between the 1-hour support at $0.58238 and the 1-hour resistance at $0.58394. The ADX at 18.85 reinforces this potential for range-bound movement as such a reading suggests a weak trend.
For this scenario to play out, we would need to see a period of relative calm in global markets, with no major surprises from economic data releases or geopolitical events. However, given the current level of uncertainty, this scenario appears less probable.
The Most Probable Scenario: A Bearish Outlook (60% Probability)
Considering the technical and fundamental factors, the bearish scenario appears most likely with an estimated probability of 60%. The strong downtrend on the 1-hour chart, the strengthening US dollar, and the upcoming economic data releases all point towards further downside pressure on NZDUSD. The 1-hour RSI is in oversold territory at 18.2, however this doesn't necessarily mean a reversal is imminent. It simply suggests that the pair is due for a short-term bounce. The overall trend remains bearish, and any such bounce is likely to be short-lived.
The bullish scenario has an estimated probability of 25%, while the range-bound scenario has a probability of 15%. These probabilities are based on a comprehensive analysis of the technical indicators, fundamental drivers, and market sentiment.
Key Triggers to Watch This Week
Several key triggers could influence the direction of NZDUSD this week:
- US CPI data: A stronger-than-expected CPI print could further fuel concerns about inflation and strengthen the US dollar, putting additional pressure on NZDUSD.
- US home sales data: A weaker-than-expected home sales print could signal a slowdown in the US economy and weaken the US dollar, providing some support for NZDUSD.
- Geopolitical developments: Escalating tensions in the Middle East could lead to a flight to safety, benefiting the US dollar and putting pressure on riskier assets like NZDUSD. According to Reuters, tensions remain high following recent events.
Key Levels
Support Levels
Resistance Levels
Technical Outlook Summary
| Indicator | Value | Signal |
|---|---|---|
| RSI (14) | 36.29 | Bearish |
| MACD Histogram | Negative | Bearish |
| Stochastic | 11.23 | Bearish |
| ADX | 43.22 | Strong Downtrend |
| Bollinger | Middle Band | Below |
Frequently Asked Questions: NZDUSD Analysis
What happens if NZDUSD breaks below $0.58238 support?
If NZDUSD breaks below the $0.58238 support, we could see a move down to $0.58186 and then $0.58082. The 1-hour chart shows a strong downtrend, so a break of this support could trigger further selling.
Should I sell NZDUSD at current $0.58275 levels given RSI at 36.29?
While the RSI at 36.29 suggests oversold conditions, it's not necessarily a buy signal. The overall trend is bearish, so selling into strength might be the more prudent approach, with a stop loss above $0.58394.
Is ADX at 43.22 a strong signal for a downtrend in NZDUSD?
Yes, an ADX of 43.22 indicates a strong downtrend on the 1-hour chart. This suggests that the bearish momentum is likely to continue, and traders should be cautious about buying into any short-term rallies.
How will the US CPI data affect NZDUSD this week?
If the US CPI data comes in stronger than expected, it could fuel concerns about inflation and strengthen the US dollar. This would likely put further downward pressure on NZDUSD. A weaker CPI print could provide some relief for the kiwi.
Track markets in real-time
AI-powered analysis, technical indicators and real-time price data.
Join Our Telegram Channel
Breaking market news, AI analysis and trading signals instantly.
Join Channel