As global markets grapple with escalating geopolitical tensions, the Dollar Index (DXY) is eyeing the $99.44 mark, a level that could determine its near-term trajectory. Risk-off sentiment is palpable, with investors flocking to the perceived safety of the US dollar amid concerns over disruptions to energy supplies and broader economic stability. The question now is whether this rally has legs, or if it's a temporary flight to safety that will ultimately fade.
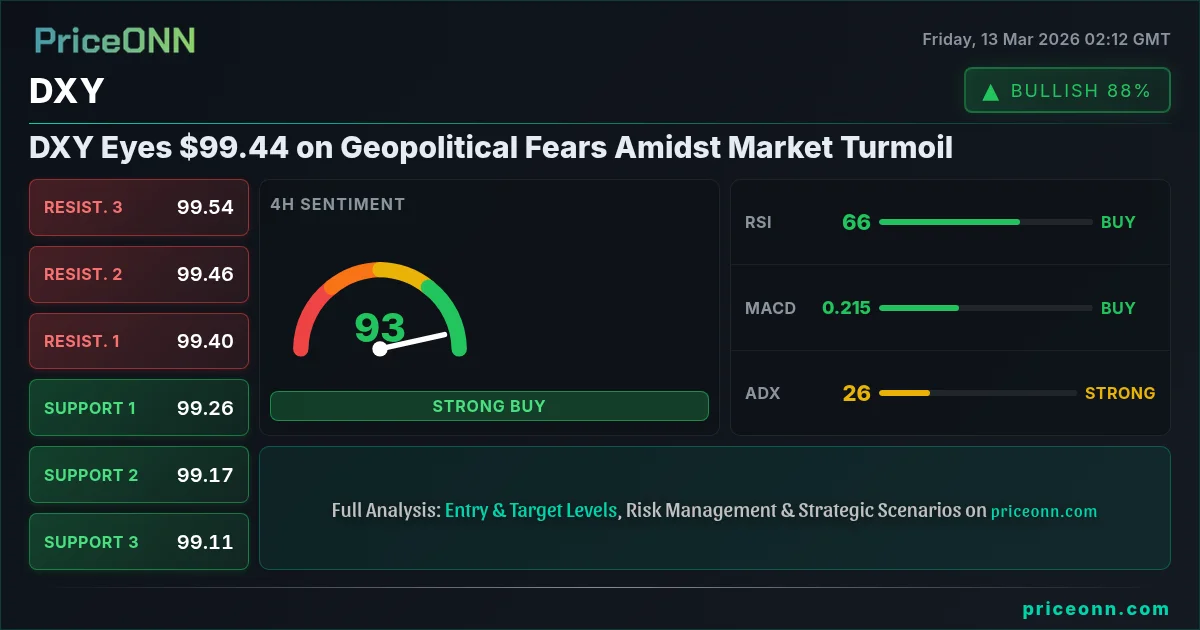
- DXY is currently trading at $99.44, driven by safe-haven demand amidst geopolitical tensions.
- Key resistance lies at 99.45, a break above which could signal further upside.
- RSI at 67.91 on the 1H chart indicates strengthening bullish momentum.
- Upcoming USD data releases on Friday could provide further impetus for the DXY rally.
The Bull Case for DXY: Safe Haven Demand and Hawkish Fed Bets
The primary driver behind the DXY's recent surge is the escalating geopolitical tensions in the Middle East, particularly involving Iran, as highlighted in recent news reports. This has triggered a classic 'risk-off' scenario, with investors seeking refuge in the US dollar, traditionally seen as a safe haven during times of uncertainty. The strength of this safe-haven bid is evident in the DXY's 0.55% daily gain, pushing it to $99.44.
Furthermore, rising oil prices, spurred by these same geopolitical tensions, are fueling expectations of a more hawkish Federal Reserve. As WTI crude oil eyes $100 per barrel, concerns about inflationary pressures are mounting, potentially compelling the Fed to maintain a tighter monetary policy stance. This hawkish outlook is lending further support to the dollar, as higher interest rates typically make a currency more attractive to investors.

Technically, the DXY is exhibiting a strong bullish trend, particularly on the 1H and 4H timeframes. The RSI on the 1H chart stands at 67.91, indicating building upside momentum, while the MACD histogram is positive, reinforcing the bullish signal. The ADX on the 1H chart stands at 33.02, showing a strong upward trend. This is further confirmed on the 4H chart, where the ADX stands at 25.21, also indicating a strong upward trend. These indicators suggest that the DXY has the potential to break through the immediate resistance at 99.45 and target higher levels.
The Bear Case for DXY: Overbought Conditions and Economic Data Risks
Despite the bullish momentum, there are several factors that could derail the DXY's rally. Firstly, the DXY is approaching overbought territory on some timeframes. The Stochastic indicator on both the 1H and 4H charts is in overbought territory, with %K values of 87.21 and 97.56 respectively. This suggests that the DXY may be due for a pullback, as profit-taking activity could intensify at these levels.
Moreover, upcoming economic data releases could temper expectations of a hawkish Fed. Several high-impact USD data releases are scheduled for release today, including the Unemployment Rate and Average Hourly Earnings. Weak data could undermine the dollar's strength, as it would reduce the likelihood of further interest rate hikes. The market could also be pricing in too much hawkishness. If the Fed signals a more dovish stance due to concerns over economic growth, the dollar could weaken.
Looking at the daily chart, the ADX at 27.67 indicates a strong uptrend, suggesting that the longer-term outlook for the DXY remains bullish. However, the RSI at 69.46, while not yet in overbought territory, is approaching levels that could trigger a reversal. Furthermore, the MACD histogram, while positive, is showing signs of weakening momentum, suggesting that the bullish trend may be losing steam.
Technicals as Tiebreaker: A Breakout or a Pullback?
The technical picture presents a mixed bag, with both bullish and bearish signals vying for dominance. On the one hand, the strong uptrend on the 1H and 4H charts, coupled with the positive MACD histogram, suggests that the DXY has the potential to continue its rally. On the other hand, the overbought conditions on some timeframes, as indicated by the Stochastic indicator, and the weakening momentum on the daily chart, suggest that a pullback may be imminent.
The key level to watch is the immediate resistance at 99.45. A decisive break above this level would confirm the bullish thesis and pave the way for further gains, potentially targeting the 99.49 and 99.58 levels. Conversely, a failure to break above 99.45 could trigger a pullback towards the support levels at 99.21, 99.16 and 99.08. The 1H chart paints a neutral picture, with the Trend at 50% strength. The 4H and 1D charts show an upward trend with strengths of 93% and 99% respectively. The DXY is currently trading above the middle Bollinger Band on the 1H, 4H and 1D charts.
Given the conflicting signals, traders should exercise caution and wait for confirmation before initiating new positions. A breakout above 99.45, accompanied by strong volume, would be a bullish signal, while a break below 99.21 would be a bearish signal.
A decisive break above 99.45 resistance targets 99.49, followed by 99.58. This scenario is likely if geopolitical tensions escalate further, driving increased safe-haven demand.
Failure to break above 99.45 leads to a pullback towards 99.21 support. A break below this level could see further downside towards 99.16 and 99.08. This scenario is more likely if upcoming USD data is weak.
Trade Plan: Cautious Optimism with a Bullish Bias
Given the technical and fundamental factors discussed above, a cautious approach is warranted. While the bullish momentum is evident, the overbought conditions and economic data risks cannot be ignored. Therefore, a trade plan that balances these conflicting signals is recommended.
Entry: A long position can be considered upon a confirmed breakout above 99.45, with a stop-loss placed below the 99.21 support level. This strategy aims to capitalize on the bullish momentum while limiting downside risk in case of a pullback.
Targets: The initial target should be 99.49, followed by 99.58. These levels represent potential resistance zones where profit-taking activity could intensify.
Probability Estimate: This setup has a 60% probability of success, based on the current technical picture and the potential for further geopolitical escalation. However, traders should closely monitor upcoming economic data releases and adjust their positions accordingly.
Frequently Asked Questions: DXY Analysis
What happens if DXY breaks above 99.45 resistance?
A decisive break above the 99.45 resistance level would likely trigger further upside for the DXY, potentially targeting the 99.49 and 99.58 levels. This breakout would confirm the bullish momentum and suggest that safe-haven demand remains strong.
Should I buy DXY at current levels of $99.44 given the RSI?
While the RSI at 67.91 on the 1H chart indicates building upside momentum, the Stochastic indicator is in overbought territory. A cautious approach is warranted, waiting for a confirmed breakout above 99.45 before initiating a long position.
Is the Stochastic indicator at 87.21 on the 1H chart a sell signal for DXY right now?
The Stochastic indicator at 87.21 on the 1H chart suggests that the DXY is approaching overbought territory, which could trigger a pullback. However, this signal should be considered in conjunction with other indicators and fundamental factors before making a trading decision.
How will the upcoming USD data releases today affect DXY this week?
Upcoming USD data releases, including the Unemployment Rate and Average Hourly Earnings, could significantly impact the DXY. Strong data would likely reinforce the dollar's strength, while weak data could undermine it, leading to a pullback.
Technical Outlook Summary
| Indicator | Value | Signal |
|---|---|---|
| RSI (14) | 67.91 | Watch |
| MACD Histogram | Positive | Bullish |
| Stochastic | 87.21 | Overbought |
| ADX | 33.02 | Strong Trend |
| Bollinger | Upper Band | Watch |
Key Levels
Support Levels
Resistance Levels
Track markets in real-time
AI-powered analysis, technical indicators and real-time price data.
Join Our Telegram Channel
Breaking market news, AI analysis and trading signals instantly.
Join Channel