Brent Crude Tests $103.82 Resistance Amid Middle East Tensions
Brent crude is testing the $103.82 resistance level, fueled by rising geopolitical tensions in the Middle East. Will the bullish trend continue?
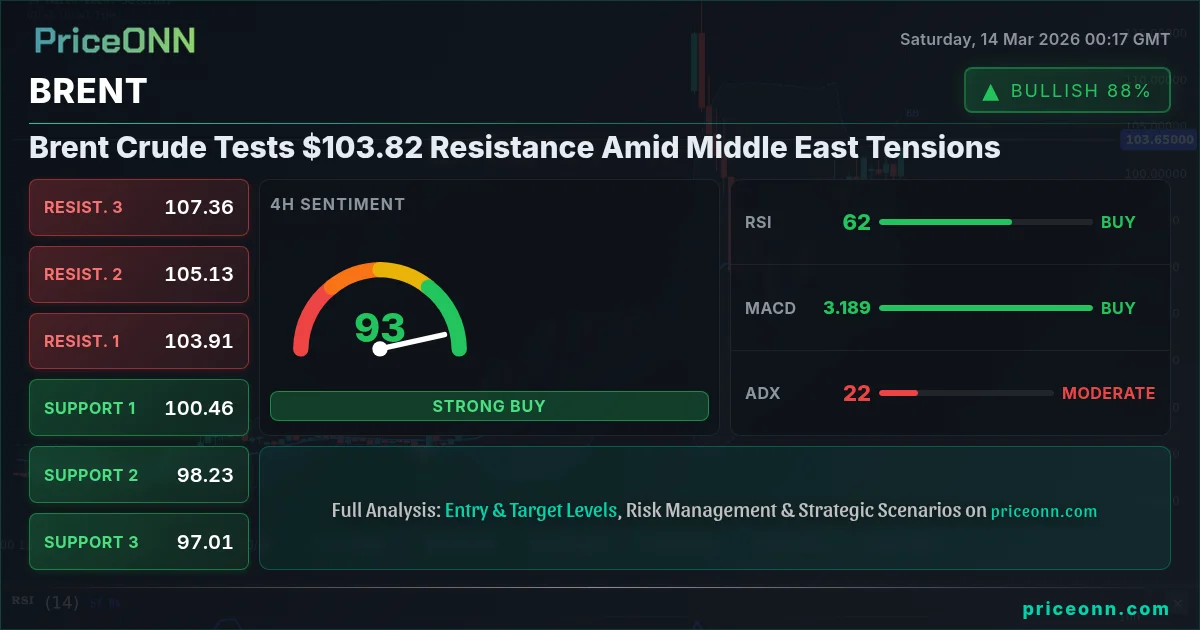
Brent crude oil is currently challenging the $103.82 resistance, a level not seen in years, as escalating geopolitical risks in the Middle East disrupt global supply chains. The question now is whether this rally has legs, or if it's a temporary spike before a correction.
- RSI on the daily chart at 87.44 signals overbought conditions, suggesting a potential pullback.
- Key resistance at $103.90, a break above which could trigger further upside.
- ADX at 55.9 on the daily timeframe indicates a very strong uptrend.
- Geopolitical tensions in the Middle East and potential supply disruptions are driving BRENT's correlation with DXY.
Having tracked BRENT through the 2024 rate cycle, the current environment feels distinctly different. The combination of supply concerns and a weaker dollar has created a perfect storm for oil bulls. The dollar index (DXY) currently sits at 100.2, which is putting upward pressure on oil prices. It's important to note that the rise in BRENT is happening despite the SP500's 0.81% decline, suggesting that safe-haven demand may be playing a role.
Geopolitical Tensions Fuel Bullish Sentiment
The primary driver behind BRENT's recent surge is the escalating conflict in the Middle East. News outlets are reporting increased tensions in the Strait of Hormuz, a critical chokepoint for global oil shipments. According to PriceONN Market News on March 13, "Brent Crude Eyes $100 as Strait of Hormuz Tensions Escalate." Any disruption to supply through this region could have a significant impact on global oil prices. The market is reacting to these concerns, driving BRENT towards the $103.82 mark.
Adding fuel to the fire, Saudi Arabia has reportedly cut oil production by 20% due to the ongoing conflict, as reported by PriceONN Market News on March 13. This supply reduction further exacerbates concerns about potential shortages, pushing prices higher. The market is pricing in a significant risk premium due to these geopolitical factors.
Technical Analysis: Overbought Conditions Loom
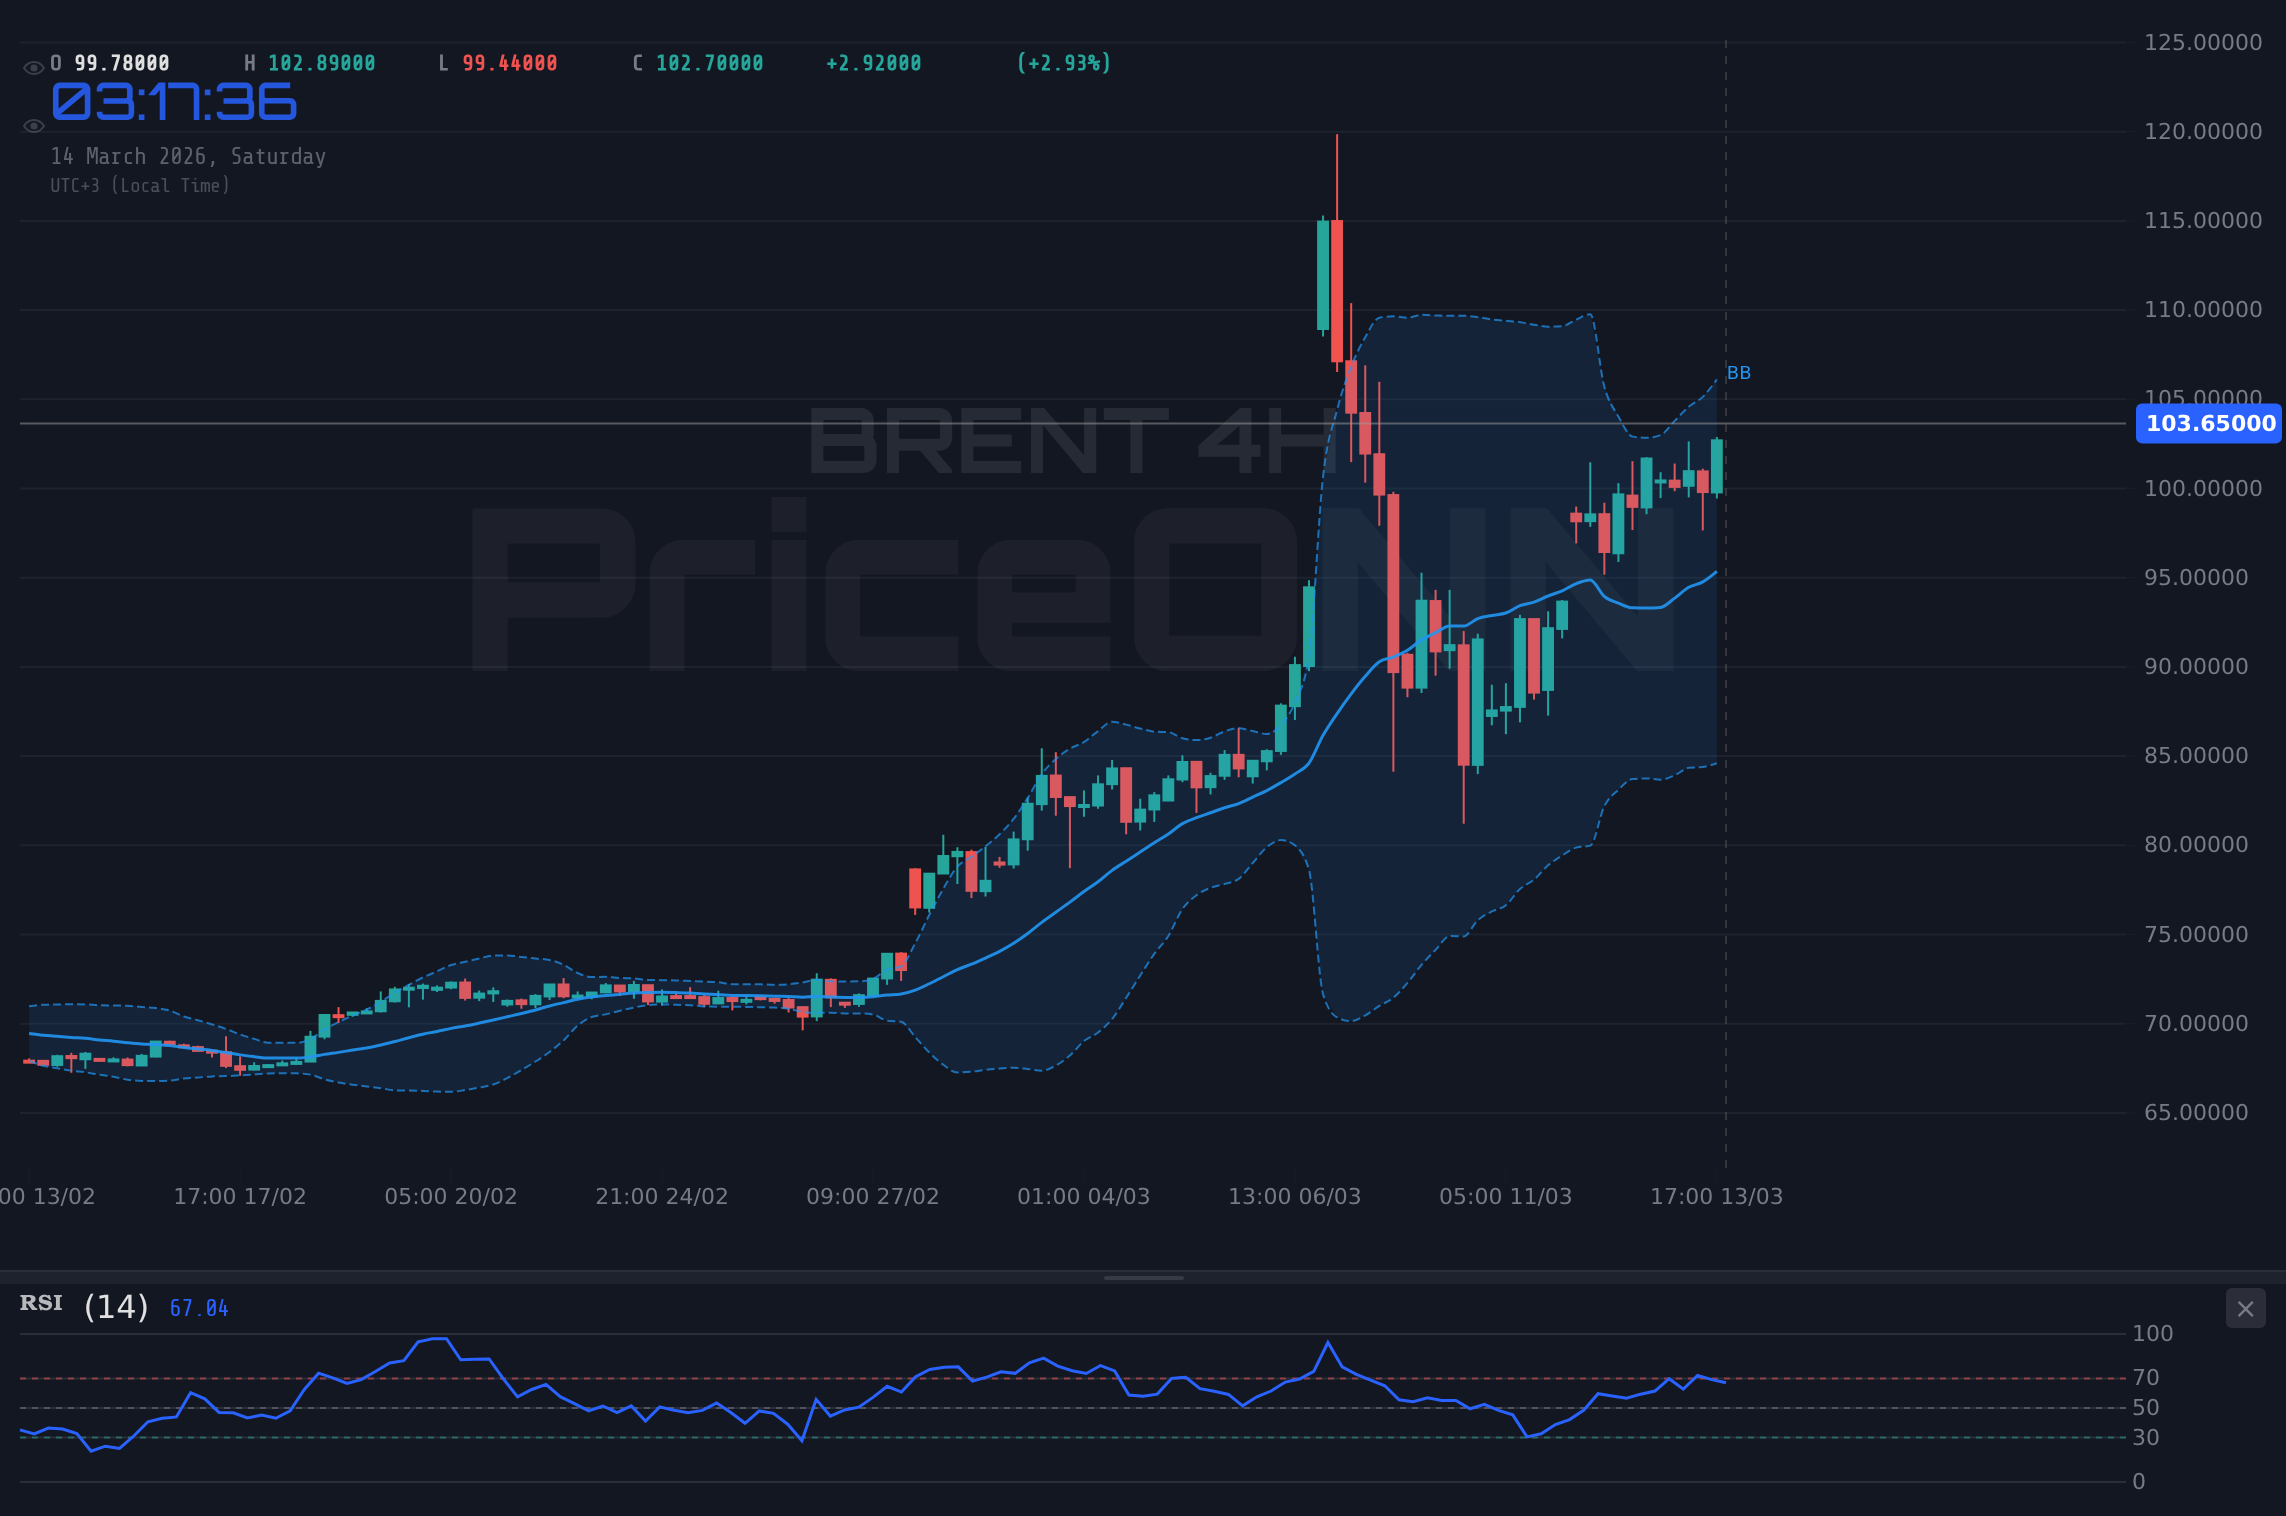
From a technical perspective, BRENT is exhibiting several conflicting signals. On the one hand, the daily chart shows a very strong uptrend, with the ADX at 55.9. This suggests that the bullish momentum is likely to continue. However, the RSI on the daily chart is at 87.44, indicating that BRENT is significantly overbought. Historically, when the RSI reaches this level, a pullback is often imminent. This suggests caution is warranted.
Looking at the 4-hour timeframe, the RSI is at 61.96, still in neutral territory but trending upwards. The MACD histogram is positive, indicating continued bullish momentum. However, the stochastic oscillator is showing a bearish crossover, suggesting that the rally may be losing steam. The conflicting signals make it difficult to predict BRENT's next move with certainty.
The 1-hour chart presents a similar picture. The RSI is at 65.64, still neutral, but the stochastic oscillator is overbought, suggesting a potential pullback. The MACD histogram is positive, but the ADX is only at 18.03, indicating a weak trend. This suggests that the rally is losing momentum, and a correction may be on the horizon.
Key Levels to Watch
The key level to watch is the $103.90 resistance. A decisive break above this level could trigger further upside, potentially targeting the $106.13 resistance. However, given the overbought conditions, a pullback is more likely in the near term. Key support sits at $101.29, a break below which could lead to a deeper correction towards $97.31.
It's important to consider the emerging query “brent prognose.” While we cannot provide a definitive prognosis, the current technical picture suggests that a period of consolidation or correction is likely before another leg higher. Traders should be prepared for increased volatility in the coming days.
The Impact of Economic Data
While geopolitical tensions are the primary driver, economic data could also play a role in BRENT's price action. The economic calendar shows that US economic data was released on Wednesday, March 11, and Friday, March 13. It is important to monitor these releases, as stronger-than-expected data could lead to a stronger dollar, putting downward pressure on BRENT. Conversely, weaker-than-expected data could support higher oil prices.
Having tracked BRENT through the 2024 rate cycle, I've observed that unexpected economic data often triggers sharp reversals. Traders should be prepared for potential volatility following these releases. The key is to manage risk and avoid chasing momentum.
Trade Recommendation: Cautious Bullish Outlook
Given the conflicting signals, a cautious bullish outlook is warranted. While the long-term trend remains upward, the overbought conditions suggest that a pullback is likely in the near term. Traders should wait for a correction before entering new long positions.
A decisive break above the $103.90 resistance could trigger further upside, targeting the $106.13 resistance. This scenario is contingent on continued geopolitical tensions and a weaker dollar.
A break below the $101.29 support could lead to a deeper correction towards $97.31. This scenario is contingent on easing geopolitical tensions and a stronger dollar.
Trade Plan: BRENT Long Setup
Here’s a trade plan for those looking to capitalize on potential BRENT upside. This setup has an estimated 60% probability, given the overbought conditions and geopolitical risks. Remember, manage your risk!
- Entry Trigger: Wait for a pullback to the $101.29 support level and a subsequent bullish reversal candlestick pattern on the 1-hour chart.
- Target 1: $103.90 (previous high)
- Target 2: $106.13 (next resistance level)
- Stop Loss/Invalidation: $99.20 (below the key support level)
- Position Sizing: Risk no more than 1% of your trading capital on this trade.
This strategy works best in a risk-on environment where geopolitical tensions remain elevated. Avoid using this strategy if tensions ease or if economic data points to a stronger dollar.
Frequently Asked Questions: BRENT Analysis
What happens if BRENT breaks above $103.90 resistance?
A decisive break above the $103.90 resistance could trigger further upside, potentially targeting the $106.13 resistance. This is contingent on continued geopolitical tensions and a weaker dollar.
Should I buy BRENT at current levels of $103.82 given RSI at 87.44?
Given the overbought conditions indicated by the RSI at 87.44 on the daily chart, it is prudent to wait for a pullback before entering new long positions. Consider waiting for a bullish reversal pattern at the $101.29 support level for a lower-risk entry.
Is the stochastic oscillator’s bearish crossover a reliable sell signal for BRENT?
The stochastic oscillator’s bearish crossover on the 1-hour and 4-hour charts suggests that the rally may be losing steam, but it should not be used in isolation. Confirmation from other indicators, such as a break below support, is needed before considering a short position.
How will US economic data releases affect BRENT this week?
Stronger-than-expected US economic data could lead to a stronger dollar, putting downward pressure on BRENT. Conversely, weaker-than-expected data could support higher oil prices. Traders should monitor these releases closely and be prepared for potential volatility.
The Bottom Line
BRENT's surge to $103.82 is primarily driven by geopolitical tensions in the Middle East and potential supply disruptions. While the long-term trend remains upward, the overbought conditions suggest that a pullback is likely in the near term. Traders should exercise caution and wait for a lower-risk entry point before entering new long positions.
Track markets in real-time
AI-powered analysis, technical indicators and real-time price data.
Join Our Telegram Channel
Breaking market news, AI analysis and trading signals instantly.
Join Channel