WTI Approaches $99.18 Resistance Amid Geopolitical Tensions
WTI crude oil is trading near $99.18, facing resistance as escalating tensions in the Middle East and potential supply disruptions fuel market volatility.
WTI crude oil is currently navigating a complex landscape, trading near $99.18 as bulls and bears grapple for control amidst a confluence of geopolitical uncertainties and evolving supply-demand dynamics. The market tension is palpable, with traders closely monitoring developments in the Middle East alongside key economic data releases that could sway the near-term trajectory of oil prices. A decisive break above this level could signal further upside, while failure to overcome this hurdle may pave the way for a deeper retracement.
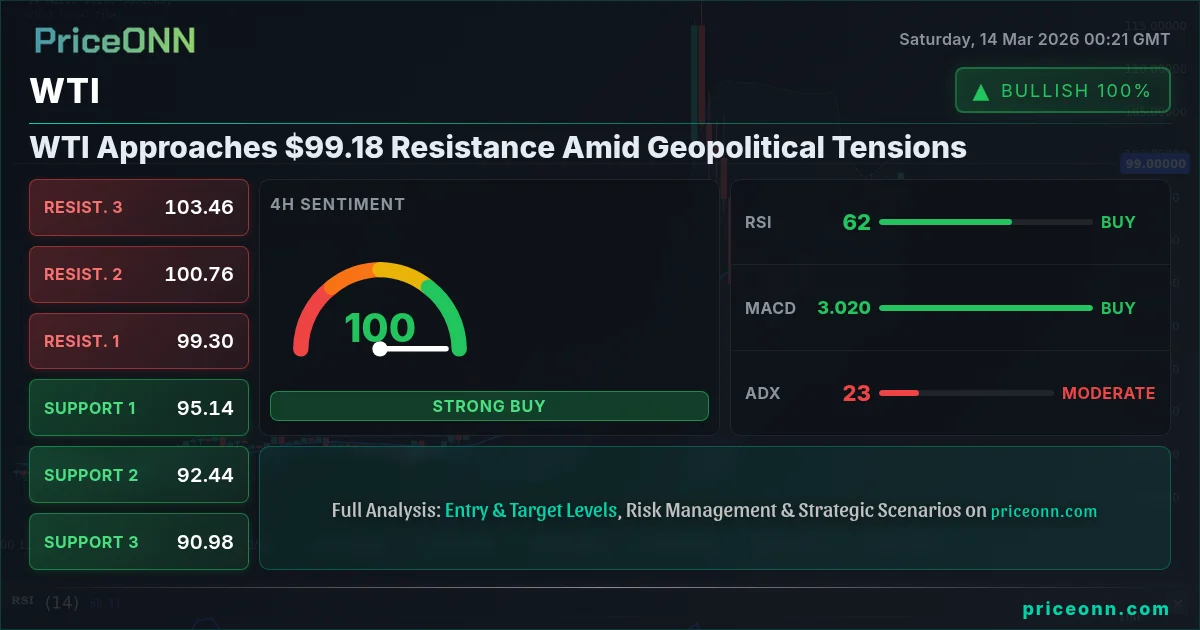
- WTI is testing resistance around $99.18, a critical level for near-term direction.
- Strong bullish momentum seen on the 1D timeframe, with RSI at 82.87 indicating overbought conditions.
- Geopolitical tensions in the Middle East, particularly around the Strait of Hormuz, are adding a risk premium to oil prices.
- Next week's CPI data will be crucial in determining the Federal Reserve's policy outlook and its impact on the dollar and commodity prices.
The Bull Case for WTI: Supply-Side Risks and Geopolitical Premiums
The bullish argument for WTI centers on the escalating geopolitical risks in the Middle East. According to recent news reports, the ongoing conflict in the Persian Gulf has led to concerns about potential disruptions to oil supplies, particularly through the Strait of Hormuz, a critical chokepoint for global oil flows. As Reuters reported, heightened tensions have already prompted Saudi Arabia to cut production by 20%, exacerbating supply concerns. This supply-side risk is further compounded by the potential for further escalation, which could lead to even more significant disruptions and a surge in oil prices. The bullish momentum is also supported by strong technical indicators. The 1D timeframe shows a powerful uptrend, with the ADX at 49.88 indicating a robust trend strength. While the RSI at 82.87 suggests overbought conditions, it also reflects the underlying buying pressure in the market. A sustained break above the $99.25 resistance level could open the door for a test of higher targets, potentially reaching $102.3 or even $107.56 in the coming weeks.
Furthermore, the recent decision by Australia and Japan to release crude reserves, as reported by PriceONN market news, has done little to quell bullish sentiment, indicating the strength of underlying demand and geopolitical anxieties. The market appears to be shrugging off these efforts to increase supply, suggesting that the geopolitical risk premium is outweighing the impact of reserve releases. This is a classic example of how geopolitical factors can override fundamental supply-demand dynamics, creating opportunities for traders who are attuned to these shifts. Swing traders might look for pullbacks to key support levels, such as $97.31, to initiate long positions, while long-term investors may view this as an opportunity to add to their holdings, betting on continued geopolitical instability and supply constraints.
The Bear Case for WTI: Demand Concerns and Overbought Conditions
Conversely, the bearish argument for WTI focuses on potential demand concerns and overbought technical conditions. The recent strength in the U.S. Dollar Index (DXY), currently trading around 100.2, is putting downward pressure on commodity prices, including WTI. A stronger dollar makes oil more expensive for international buyers, potentially dampening demand. Moreover, with the RSI on the daily chart hovering near 82.87, WTI is technically overbought, suggesting that a correction may be imminent. This overbought condition could trigger profit-taking, leading to a pullback towards key support levels. The SP500 and Nasdaq are also showing signs of weakness, with both indices experiencing daily declines. This risk-off sentiment could further weigh on oil prices, as investors seek safe-haven assets and reduce exposure to riskier commodities. The negative momentum in the stock market could spill over into the oil market, exacerbating the downside pressure.
The bearish case also considers the potential for increased oil production from other sources. While OPEC+ has maintained its current production policy, there is always the possibility of a change in strategy, particularly if prices continue to rise. Increased production from non-OPEC sources, such as the United States, could also alleviate supply concerns and put downward pressure on prices. Scalpers and day traders might look for shorting opportunities on rallies, targeting intraday support levels, while swing traders may wait for a confirmed break below key support levels, such as $97.31, before initiating short positions. Long-term investors should closely monitor global economic growth data and potential shifts in OPEC+ policy, as these factors could significantly impact the long-term outlook for oil prices.
Technicals as the Tiebreaker: Examining WTI's Key Levels and Indicators
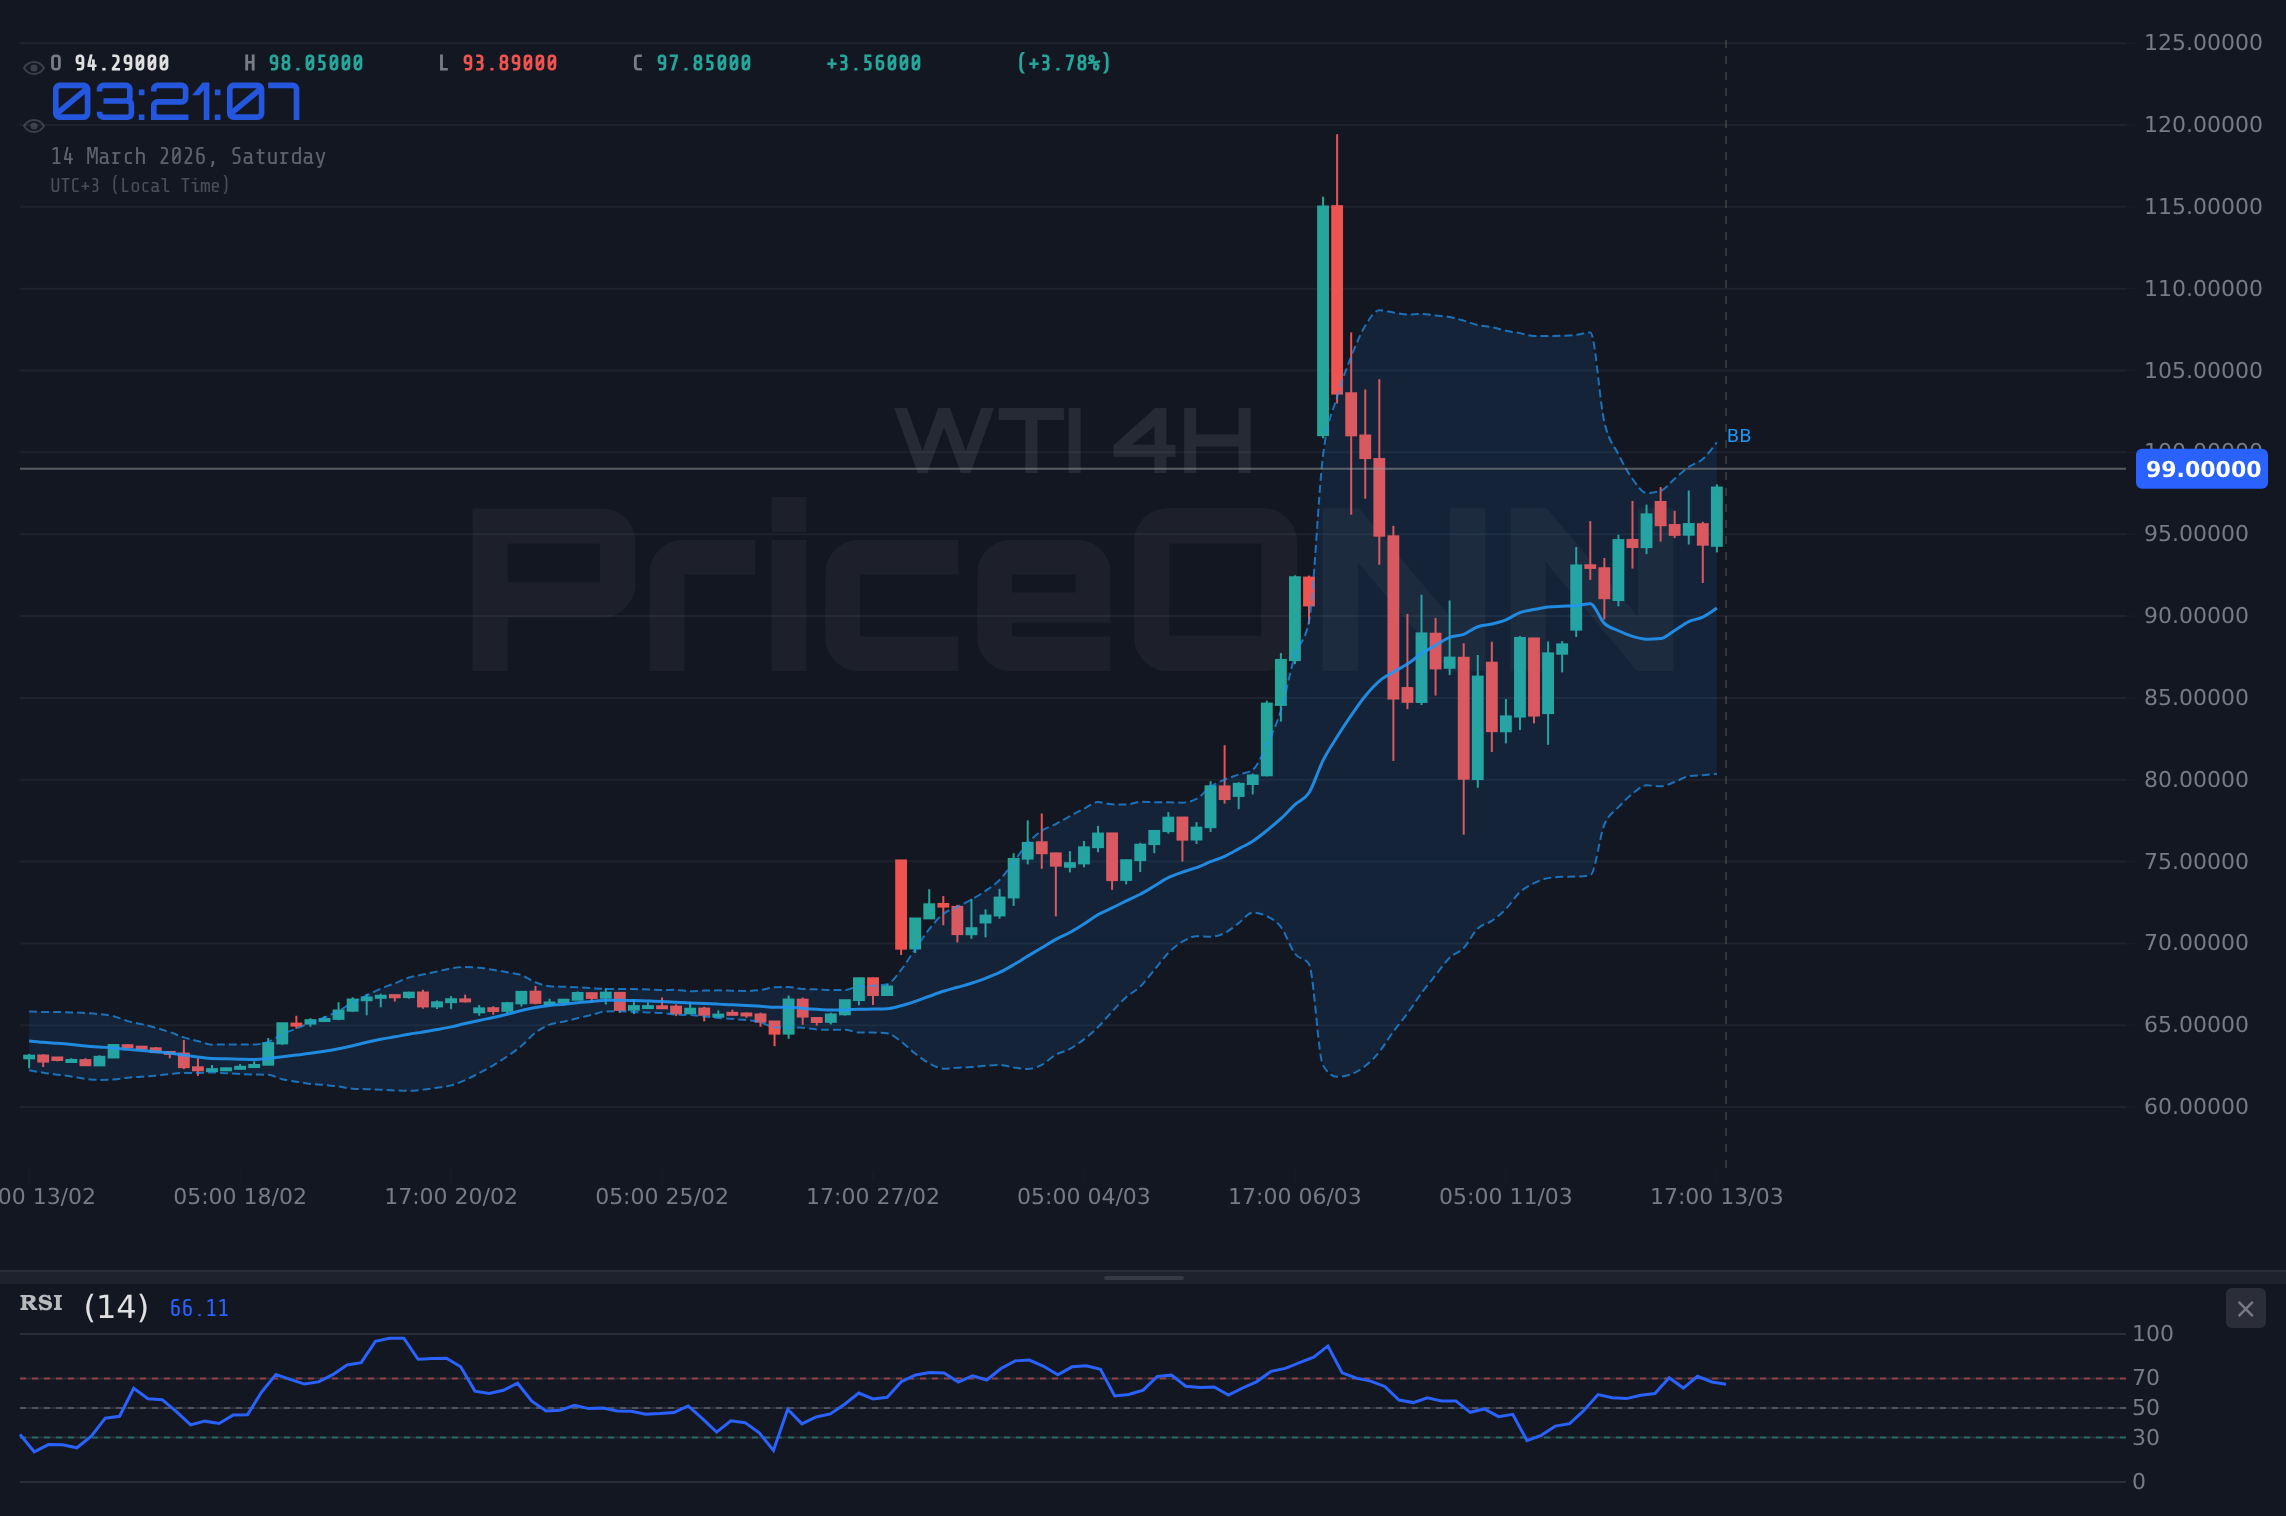
From a technical perspective, WTI's near-term direction hinges on its ability to overcome the $99.25 resistance level. A sustained break above this level, confirmed by strong volume, would likely invalidate the bearish thesis and pave the way for further upside. Conversely, failure to break above $99.25 and a subsequent break below the $97.31 support level could trigger a deeper retracement towards $92.95. The MACD on the daily chart is currently positive, indicating bullish momentum, but a potential crossover below the signal line could signal a shift in momentum and favor the bears. The stochastic oscillator, currently at 51.72, is trending downwards, suggesting that the bullish momentum may be waning.
Analyzing WTI across multiple timeframes reveals a mixed picture. On the 1-hour chart, the RSI at 66.96 suggests neutral conditions, while the ADX at 19.71 indicates a weak trend. This suggests that the near-term direction is uncertain, and traders should exercise caution. On the 4-hour chart, the RSI at 61.89 also indicates neutral conditions, while the ADX at 23.08 suggests a moderate uptrend. This suggests that the medium-term trend is still bullish, but momentum may be slowing. The key for traders is to watch for confirmation signals on both the upside and downside, and to adjust their strategies accordingly. Scalpers can use the shorter-term timeframes to identify intraday trading opportunities, while swing traders should focus on the longer-term charts to identify potential trend reversals.
The recent WTI price action has been influenced by several factors. The IEA's reserve release initially put downward pressure on prices, but escalating geopolitical tensions quickly reversed this trend. The market's reaction to these events highlights the importance of staying nimble and adapting to changing market conditions. Traders should closely monitor news headlines and economic data releases, as these events can trigger significant price swings. The upcoming CPI data next week will be particularly important, as it could influence the Federal Reserve's policy outlook and its impact on the dollar and commodity prices. If the CPI data comes in higher than expected, it could lead to a more hawkish Fed stance, strengthening the dollar and putting downward pressure on WTI. Conversely, weaker-than-expected CPI data could lead to a more dovish Fed stance, weakening the dollar and supporting WTI prices.
WTI Trade Plan: Bullish Breakout Scenario
Considering the technical and fundamental factors, a bullish trade plan seems more probable. However, it's crucial to manage risk and wait for confirmation before initiating a position. A potential trade setup involves waiting for a confirmed breakout above the $99.25 resistance level, with a stop-loss order placed below the $97.31 support level. The first price target would be $102.3, with a second target at $107.56. This setup offers a favorable risk-reward ratio, with the potential for significant upside if the bullish momentum continues. The probability of this scenario playing out is estimated at 60%, given the strong bullish momentum and geopolitical risks.
WTI breaks above $99.25 resistance and sustains the move, targeting $102.3 and then $107.56. Continued geopolitical tensions and supply disruptions support the upside.
WTI fails to break above $99.25 and falls below $97.31 support, targeting $92.95. Demand concerns and a stronger dollar weigh on prices.
It's crucial to acknowledge that the upcoming CPI data and any surprise news headlines could significantly impact the market. Therefore, traders should closely monitor these events and be prepared to adjust their positions accordingly. A higher-than-expected CPI print could trigger a sharp sell-off in WTI, while a weaker-than-expected print could fuel a rally. Risk management is paramount in this volatile environment. Always use stop-loss orders and avoid over-leveraging your positions. Patience is key – wait for your setup to materialize before entering a trade.
Frequently Asked Questions: WTI Analysis
What happens if WTI breaks above $99.25 resistance?
If WTI decisively breaks above the $99.25 resistance, it would likely signal a continuation of the bullish trend, with potential targets at $102.3 and $107.56. This scenario would be supported by strong volume and continued geopolitical tensions.
Should I buy WTI at current levels of $99.18 given the RSI at 82.87?
Given the overbought RSI reading of 82.87 on the daily chart, it may be prudent to wait for a pullback before initiating a long position. A potential entry point could be around the $97.31 support level, which would offer a more favorable risk-reward ratio. Be cautious as the CPI data is coming up.
Is the positive MACD signal a reliable indicator of continued upside for WTI?
While the MACD is currently positive, traders should watch for a potential crossover below the signal line, which could signal a shift in momentum and favor the bears. Confirmation from other indicators, such as a break below the $97.31 support level, would strengthen this bearish signal.
How will the upcoming CPI data affect WTI this week?
The upcoming CPI data will be crucial in determining the Federal Reserve's policy outlook and its impact on the dollar and commodity prices. Higher-than-expected CPI could lead to a more hawkish Fed stance, strengthening the dollar and putting downward pressure on WTI, while weaker-than-expected data could have the opposite effect.
The WTI market is currently caught in a tug-of-war between bullish and bearish forces. Geopolitical tensions and supply-side risks are supporting the upside, while demand concerns and overbought technical conditions are weighing on prices. The near-term direction will likely depend on the outcome of the battle around the $99.25 resistance level and the impact of next week's CPI data.
Technical Outlook Summary
| Indicator | Value | Signal |
|---|---|---|
| RSI (14) | 82.87 | Overbought |
| MACD Histogram | Positive | Bullish |
| Stochastic | 51.72 | Neutral |
| ADX | 49.88 | Strong Trend |
| Bollinger | Upper Band | Watch |
Key Levels
Support Levels
Resistance Levels
Track markets in real-time
AI-powered analysis, technical indicators and real-time price data.
Join Our Telegram Channel
Breaking market news, AI analysis and trading signals instantly.
Join Channel