The Dollar Index (DXY) is currently trading near $100.20, marking a significant continuation of its bullish trend. Last Friday close at $100.20 reflects the culmination of a week driven by geopolitical tensions and anticipation surrounding upcoming economic data releases. The question now is whether the DXY can sustain this momentum, especially with high-impact CPI data on the horizon.
- The Dollar Index (DXY) closed last Friday at $100.20, signaling continued bullish momentum.
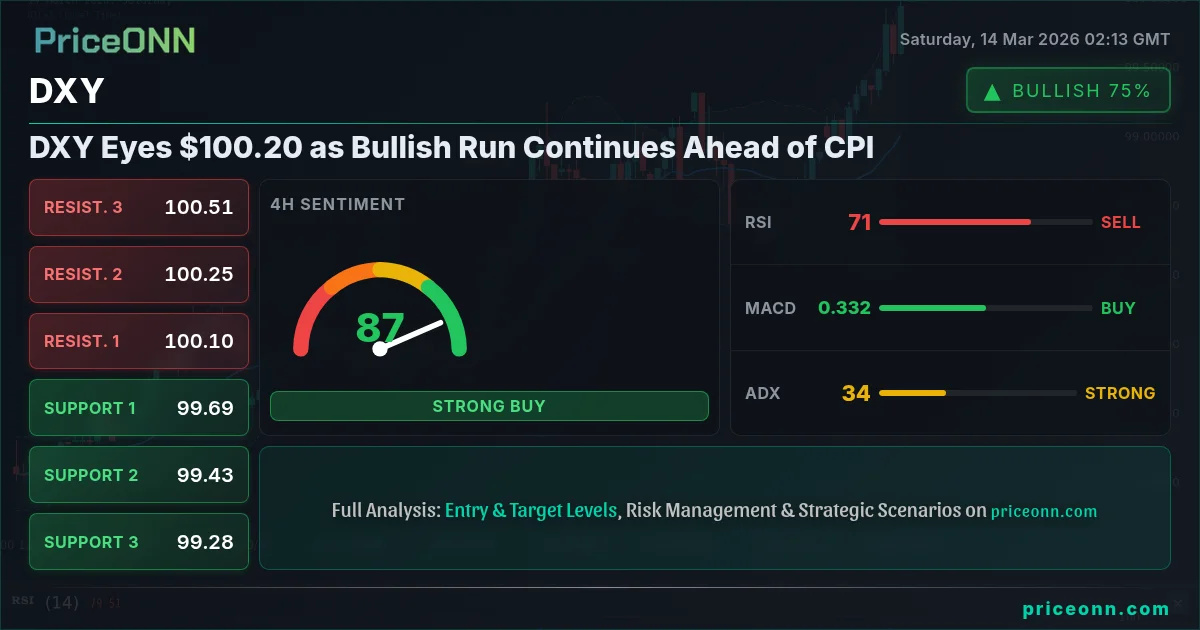
- RSI at 74.69 on the daily timeframe suggests overbought conditions, warranting caution for aggressive bullish positions.
- Immediate resistance lies at 100.1, a key level to watch for potential breakout or pullback.
- Upcoming CPI data and geopolitical tensions will likely drive DXY's direction in the coming week.
Technical Deep-Dive: Navigating the Bullish Channel
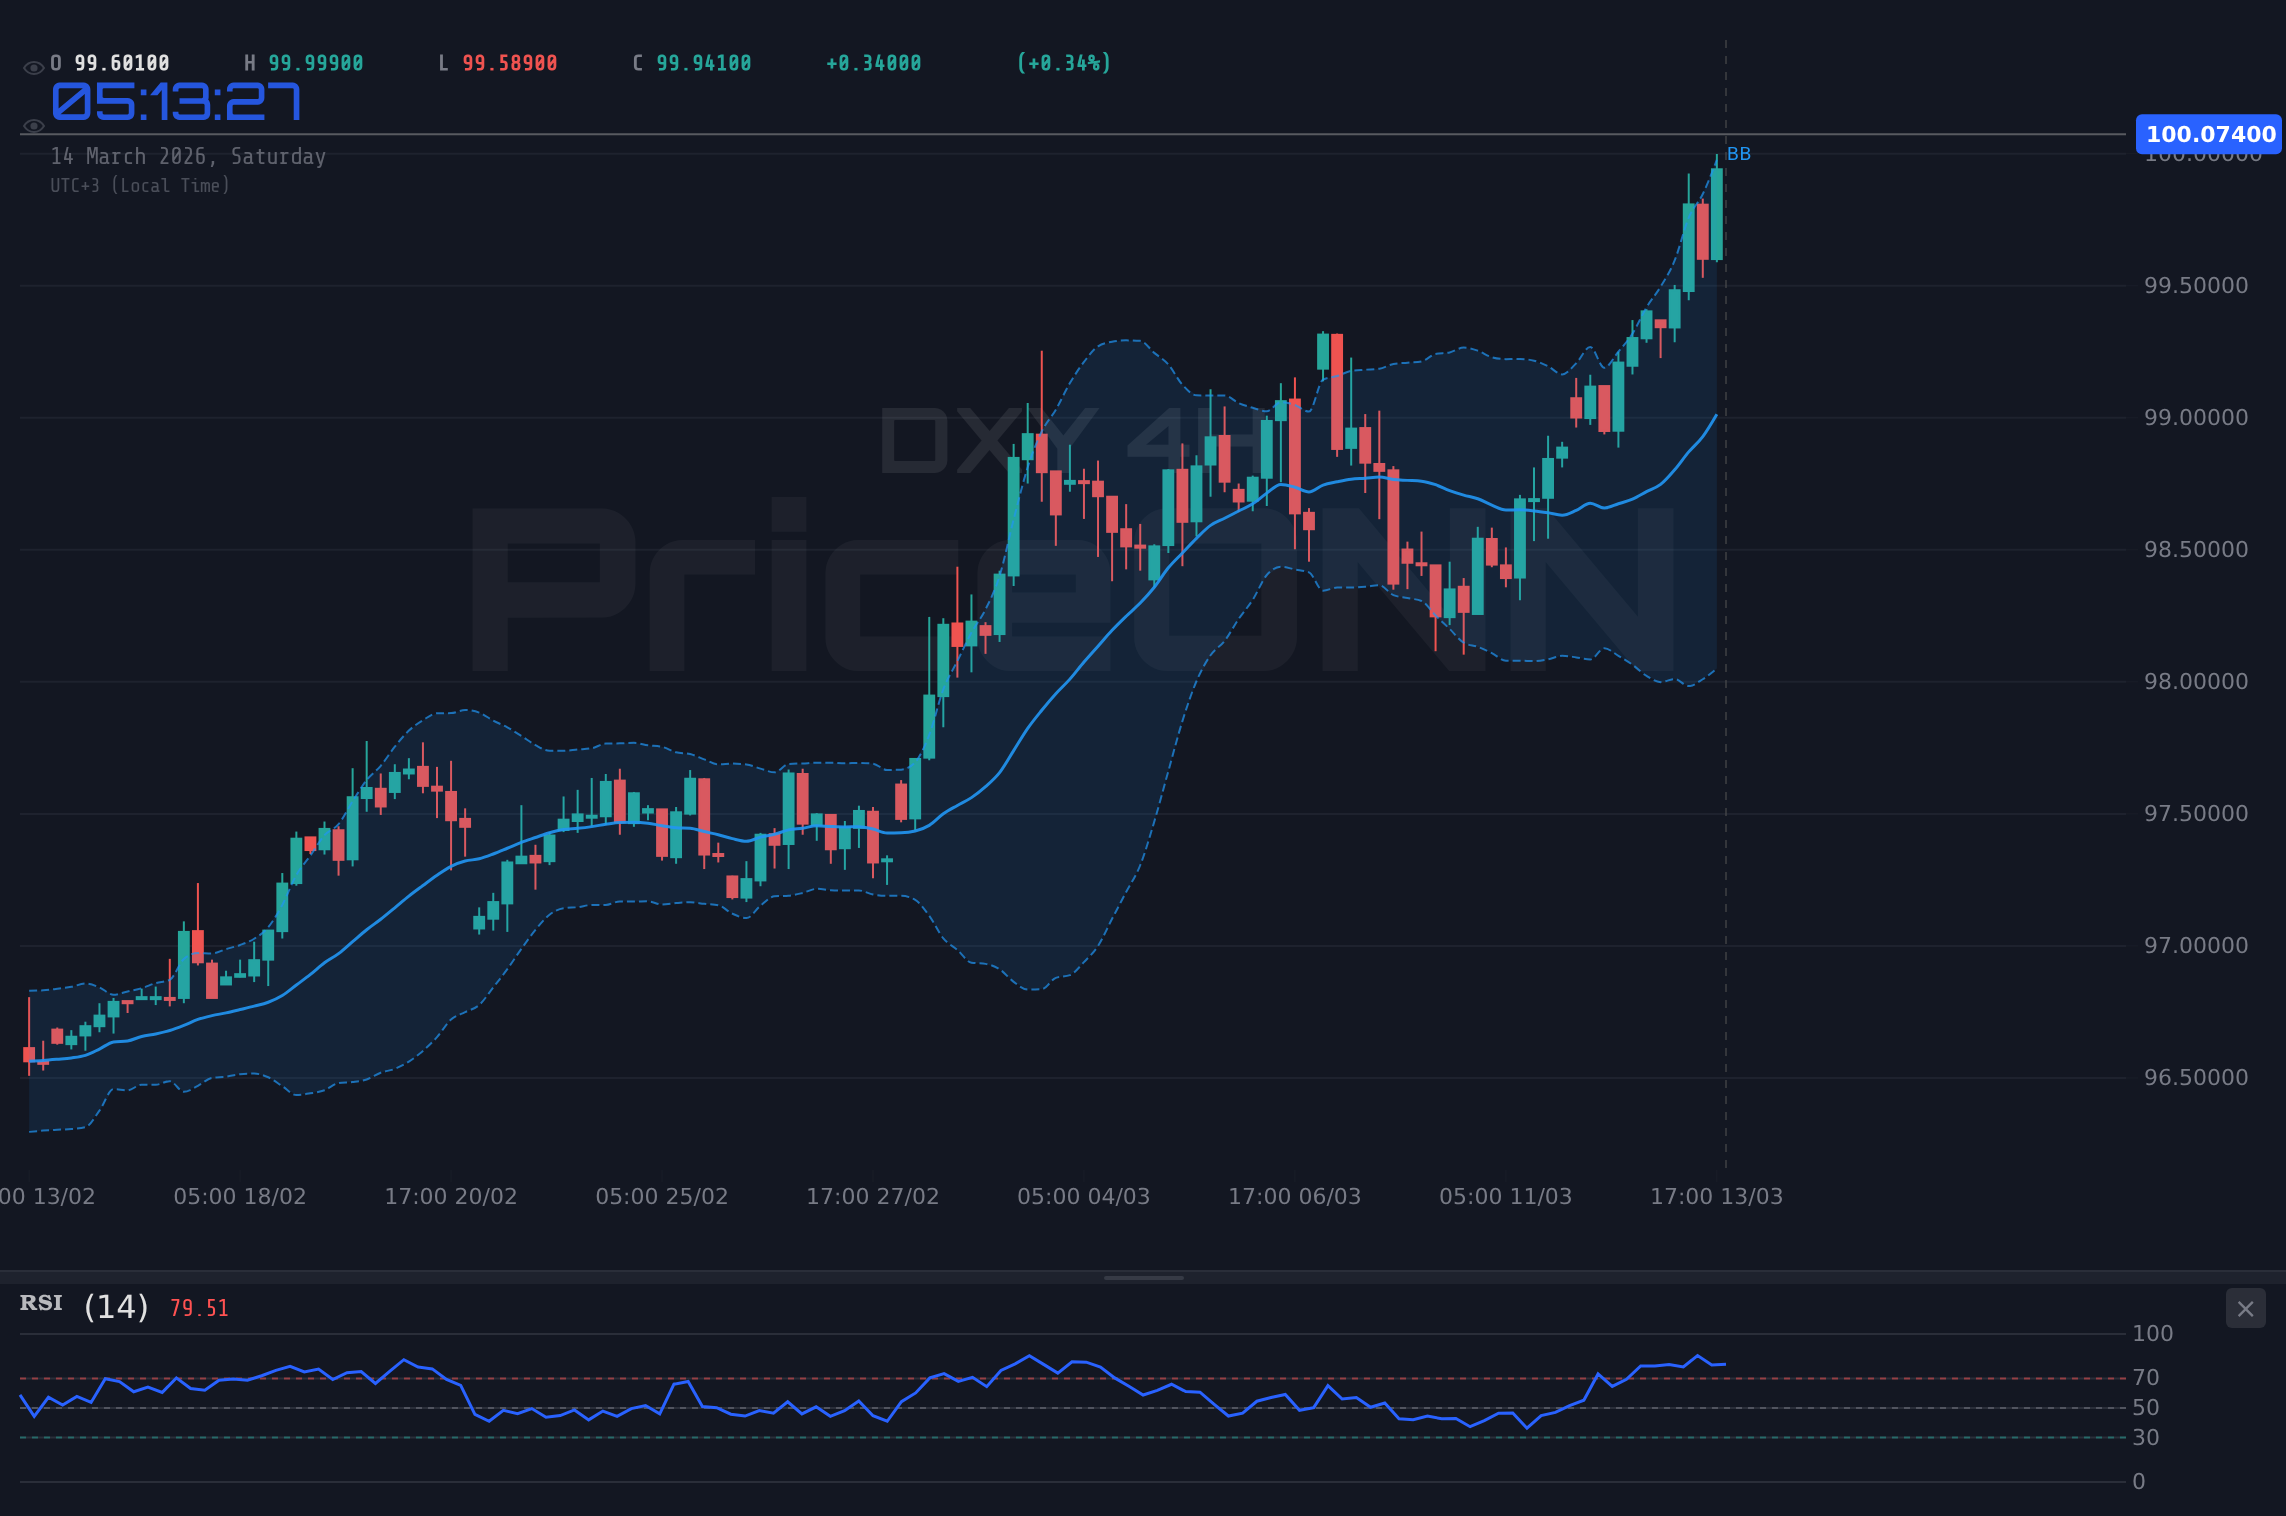
The DXY's rise has been underpinned by a strong bullish trend, evident across multiple timeframes. On the daily chart, the RSI stands at 74.69, flirting with overbought territory, indicating that the bulls may be losing steam. However, the ADX at 29.83 confirms the presence of a strong uptrend, suggesting that any pullback may be temporary. The MACD histogram is positive, further supporting the bullish narrative, but traders should be wary of potential divergence as the index approaches key resistance levels.
Zooming into the 4-hour timeframe, the RSI at 72.7 also signals overbought conditions, while the ADX at 32.13 reinforces the strength of the ongoing uptrend. The Stochastic indicator, with K at 85.87 and D at 91.77, further confirms the overbought status, suggesting a potential near-term correction. Key support levels to watch include 99.9 and 99.86, representing potential areas where buyers may step in to defend the bullish trend. Conversely, immediate resistance lies at 100.1, a level that, if breached, could pave the way for further upside.
Examining the 1-hour chart, the RSI at 78.75 further emphasizes the overbought conditions. The ADX at 40.64 continues to indicate a strong uptrend. This confluence of signals suggests that the DXY may be poised for a short-term pullback before resuming its upward trajectory. The Stochastic, with K at 92.32 and D at 72.9, signals overbought conditions. Key support levels on this timeframe include 99.9 and 99.86, while resistance is found at 100.04. A break above this level could trigger another leg higher.
DXY's Correlation with Global Markets
The DXY's strength has a direct impact on other asset classes. As the dollar index strengthens, it typically puts pressure on gold (XAUUSD) and major currency pairs like EURUSD, GBPUSD, AUDUSD, and NZDUSD. Currently, EURUSD is trading at 1.14174, GBPUSD at 1.32218, AUDUSD at 0.69811, and NZDUSD at 0.5775, all reflecting the downward pressure exerted by the stronger dollar. Conversely, USDJPY is trading at 159.742, benefiting from the dollar's strength.
The SP500 and Nasdaq are also showing signs of weakness, with the SP500 at 6625.3 and the Nasdaq at 24337.41. This correlation suggests that risk appetite is declining, potentially driving further safe-haven demand for the dollar. Oil prices, however, are showing resilience, with Brent Crude at $103.82 and WTI Crude at $99.18, reflecting ongoing geopolitical tensions and supply concerns.
Economic Calendar and News Catalysts
The economic calendar is light today, but looking back, Wednesday's releases provided crucial context for the DXY's recent movements. The upcoming CPI data will be a key driver for the DXY next week. Traders should also monitor geopolitical developments, particularly tensions in the Middle East, as these events can significantly impact market sentiment and safe-haven flows. As Reuters reported, Middle East tensions are fueling dollar demand, pushing USD/JPY towards 160.00.
Last Friday, multiple USD high-impact events occurred, providing context for the current DXY price. The market will be looking forward to the next announcements to see how the dollar will react.
Trade Plan: Riding the DXY Wave
Given the technical picture and fundamental backdrop, a cautious bullish approach appears warranted for the DXY. The strong uptrend, as confirmed by the ADX, suggests that the index is likely to continue its upward trajectory. However, the overbought conditions, as indicated by the RSI and Stochastic, call for careful entry and risk management.
If DXY breaks above 100.1 resistance, it could target 100.5 and 100.8. Confirmation would be a sustained move above 100.1 on strong volume.
If DXY fails to break above 100.1 and pulls back, it could test support at 99.9 and 99.86. A break below 99.86 would invalidate the bullish thesis.
Risk Management
Given the upcoming CPI data and geopolitical uncertainties, risk management is paramount. Traders should consider using stop-loss orders to protect their capital and avoid overleveraging their positions. A break below 99.9 could signal a shift in momentum, warranting a reassessment of the bullish outlook. A stop-loss order placed just below this level would help mitigate potential losses.
Furthermore, traders should be prepared for increased volatility in the coming week. The CPI data could trigger significant market movements, and geopolitical events could exacerbate the volatility. Therefore, it is essential to stay informed and adjust trading strategies accordingly.
Frequently Asked Questions: DXY Analysis
What happens if DXY breaks above 100.1 resistance?
If DXY successfully breaches the 100.1 resistance level, it could potentially pave the way for further upside, targeting subsequent resistance levels at 100.5 and 100.8. This breakout would confirm the strength of the bullish trend and attract additional buyers into the market.
Should I buy DXY at current levels of $100.20 given the overbought RSI?
While the DXY exhibits a strong uptrend, the overbought RSI at 74.69 suggests caution. A more prudent approach would be to wait for a pullback towards support at 99.9 before initiating a long position, allowing for a better risk-reward ratio.
Is the positive MACD signal a reliable indicator of continued DXY strength?
The positive MACD histogram supports the bullish narrative, but traders should be wary of potential divergence. If the MACD starts to weaken while price continues to rise, it could signal a loss of momentum and a potential trend reversal.
How will the upcoming CPI data affect DXY this week?
The upcoming CPI data is a key catalyst for the DXY. Stronger-than-expected inflation figures could strengthen the dollar, as it would reinforce expectations of further interest rate hikes by the Federal Reserve. Conversely, weaker-than-expected data could weaken the dollar, as it would suggest that the Fed may be more cautious in its approach to monetary policy.
Technical Outlook Summary
| Indicator | Value | Signal |
|---|---|---|
| RSI (14) | 4 | Neutral |
| MACD Histogram | Positive | Bullish |
| Stochastic | 92.85 | Bearish |
| ADX | 29.83 | Strong Trend |
| Bollinger | Upper Band | Watch |
Key Levels
Support Levels
Resistance Levels
Track markets in real-time
AI-powered analysis, technical indicators and real-time price data.
Join Our Telegram Channel
Breaking market news, AI analysis and trading signals instantly.
Join Channel