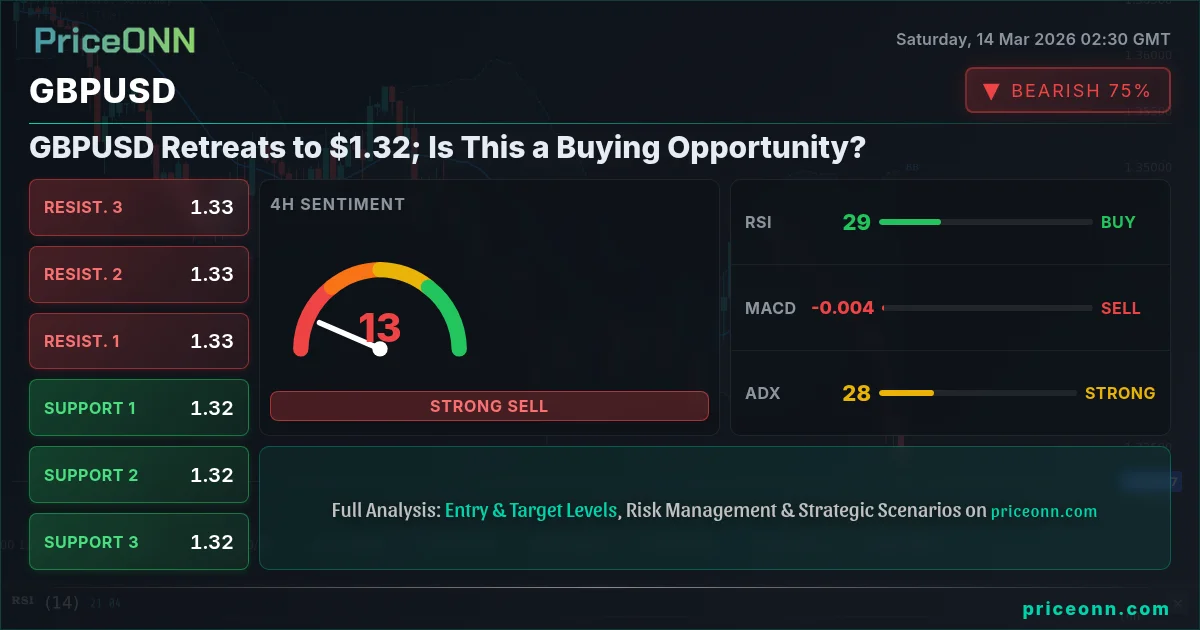
GBPUSD is caught in a tug-of-war near $1.32, as bulls and bears battle for control. The pair has been under persistent selling pressure, but oversold conditions are starting to emerge. The question is- can the bulls stage a comeback, or will the bears extend their dominance?
- RSI at 25.27 on the 1H chart signals oversold conditions, potentially leading to a short-term bounce.
- Key support level at 1.32202 on the 1H timeframe could provide a platform for bullish reversal.
- ADX at 44.45 indicates a strong downtrend, suggesting bears are still in control overall.
- Upcoming CPI data could be a major catalyst, potentially triggering a significant move in either direction.
The Bullish Case for GBPUSD
Despite the prevailing bearish sentiment, there are several arguments in favor of a potential bullish reversal. The most compelling is the oversold condition signaled by the Relative Strength Index (RSI). On the 1-hour chart, the RSI sits at 25.27, well below the 30 threshold that typically indicates oversold territory. This suggests that the pair may be ripe for a correction, as sellers begin to take profits and buyers step in to capitalize on discounted prices. Another factor supporting the bull case is the presence of a key support level at 1.32202 on the 1H timeframe. This level has acted as a floor in the past, and a successful defense could signal renewed buying interest.
Furthermore, the recent strength in Brent crude oil, which is currently trading at $103.82, could provide a tailwind for the British Pound. As reported by Reuters, rising oil prices often correlate with increased inflation expectations, which can lead to a more hawkish stance from the Bank of England (BoE). A more hawkish BoE, in turn, could support the Pound against the US Dollar. This is a key macroeconomic factor that GBPUSD traders should carefully consider in March 2026. The GBPUSD macroeconomic factors march 2026 are important to consider.
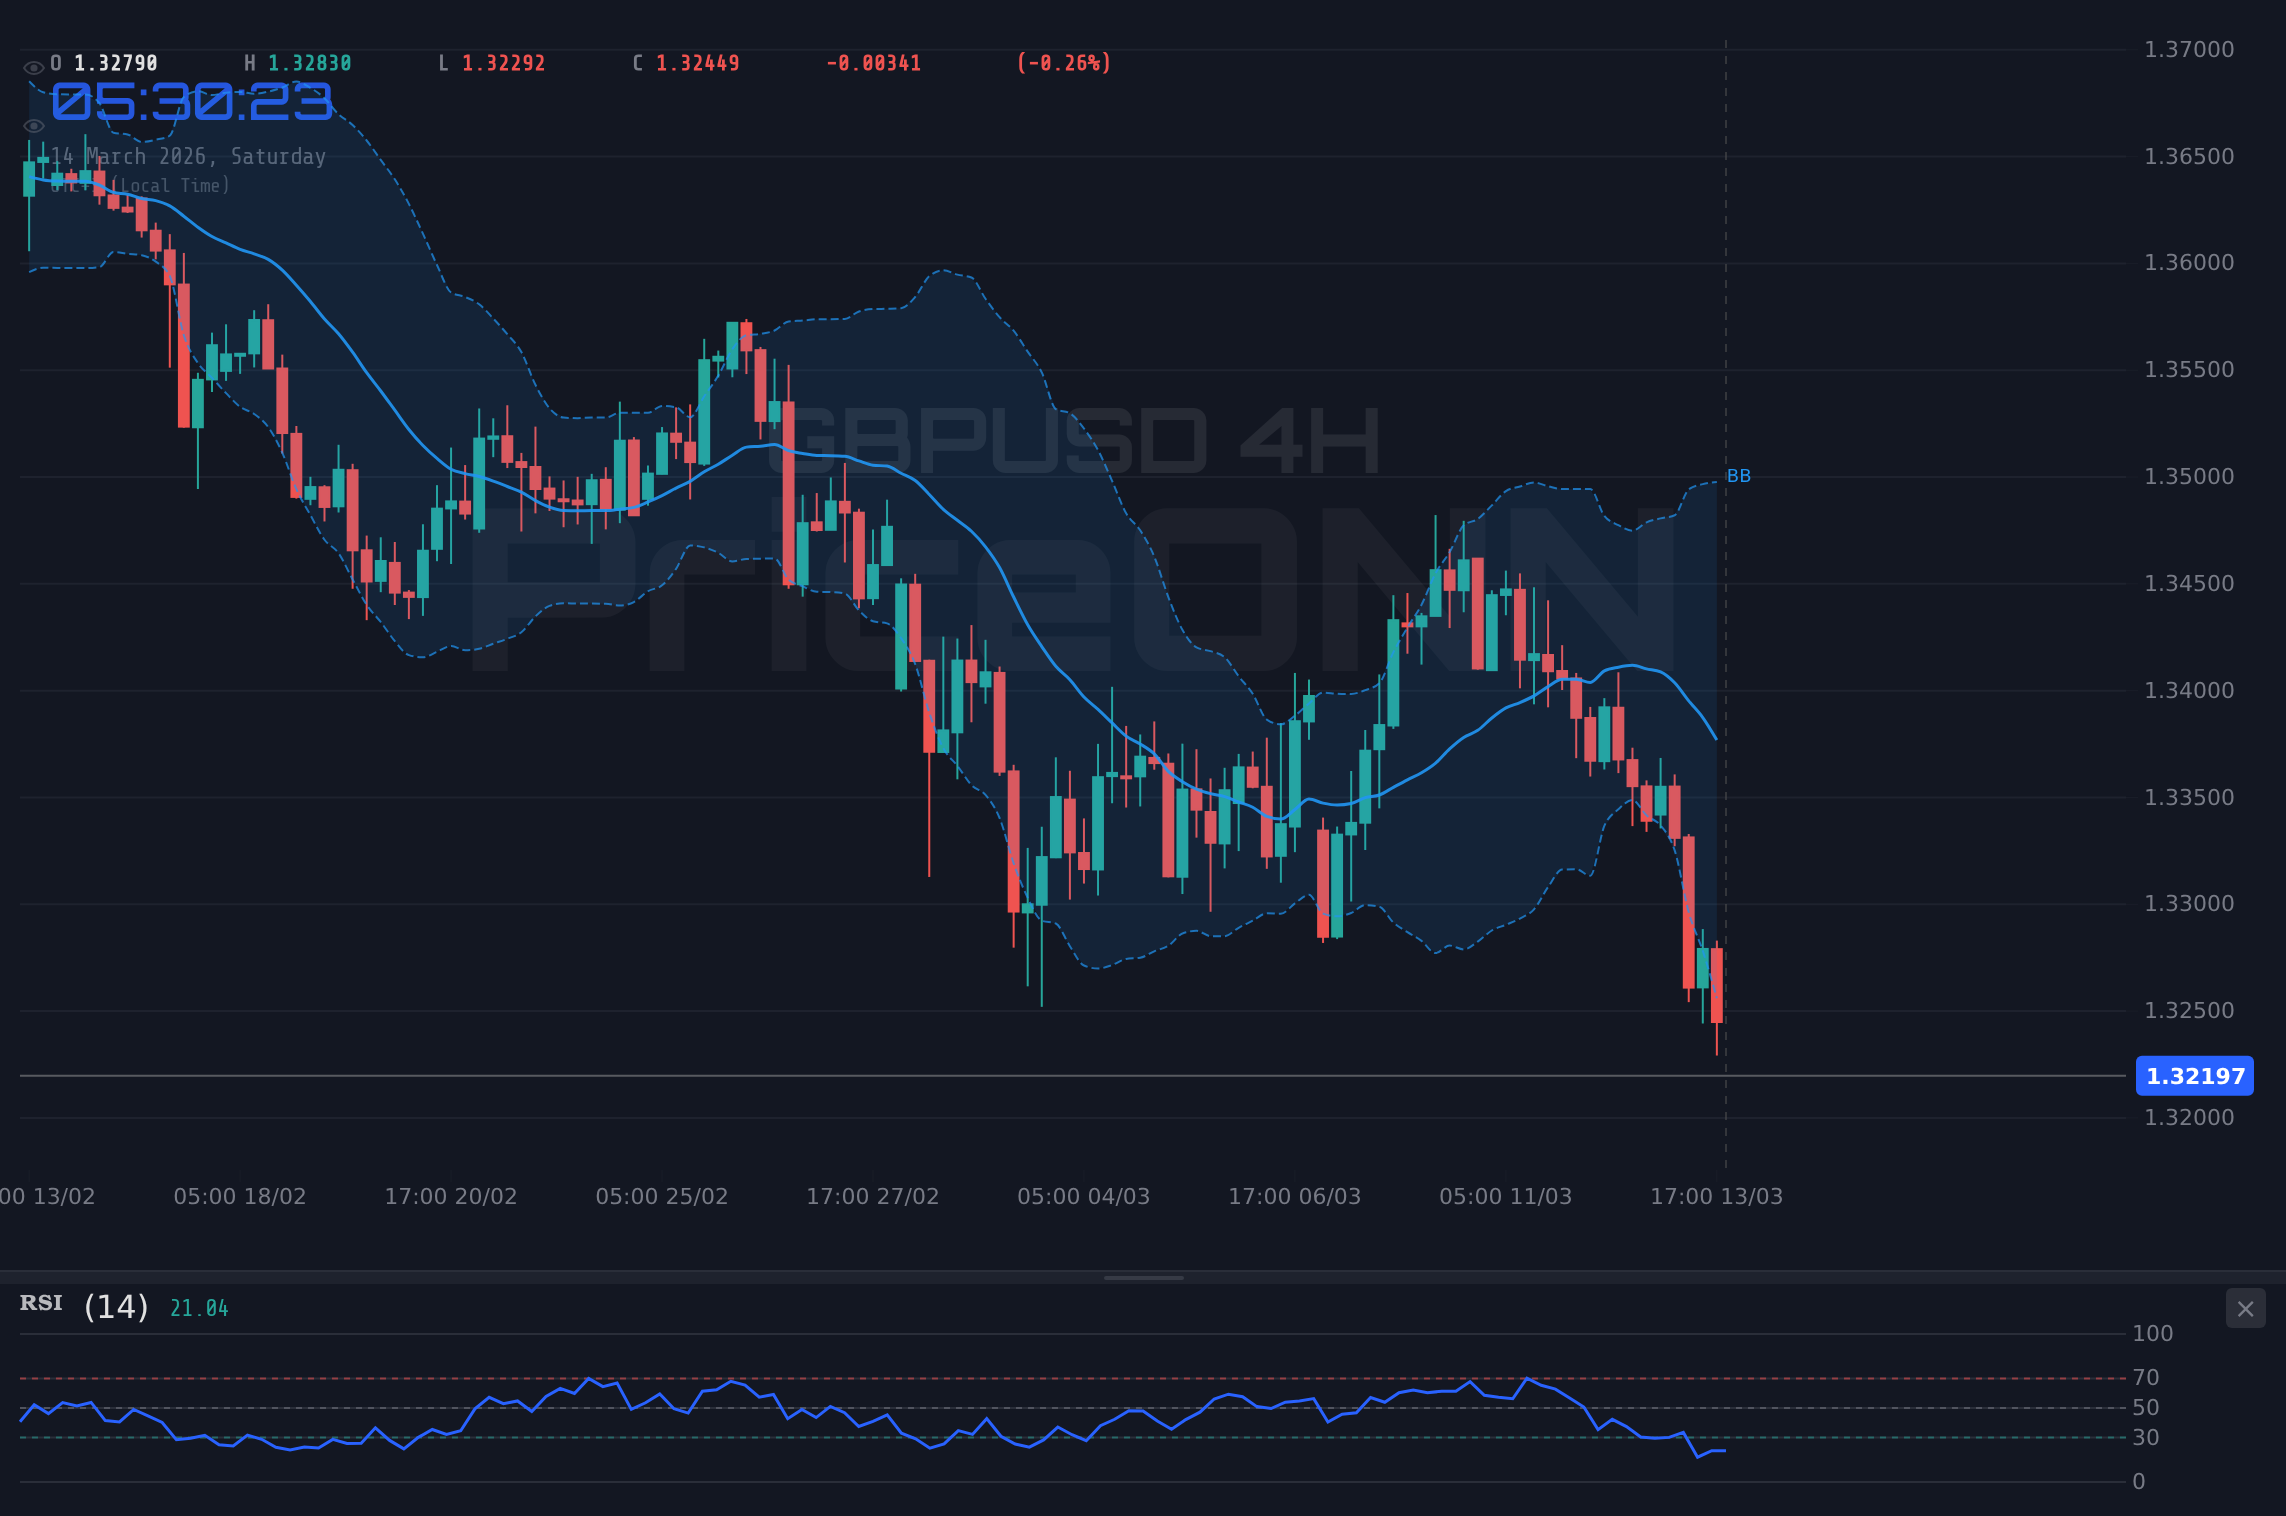
Technically, the Stochastic oscillator on the 4-hour chart paints an interesting picture. With %K at 11.46 and %D at 10.49, it's deeply entrenched in oversold territory. This adds weight to the argument that a reversal could be brewing. A decisive break above the 1.3249 resistance level on the 1H chart could trigger a short-covering rally, potentially pushing the pair towards higher targets.
The Bearish Case for GBPUSD
However, the bears have a strong grip on GBPUSD, and there are plenty of reasons to believe that the downtrend will persist. The most obvious is the strength of the US Dollar, as indicated by the Dollar Index (DXY). The DXY is currently trading at 100.2, having gained 0.8% today. As the dollar index strengthens by 0.8%, GBPUSD is under pressure. As tensions in the Middle East escalate, the dollar index nears 10-month highs, according to recent reports. This safe-haven demand for the greenback is weighing heavily on pairs like GBPUSD.
Adding to the bearish narrative is the strong downtrend confirmed by several technical indicators. The Average Directional Index (ADX) on the 1-hour chart sits at 44.45, indicating a powerful downtrend. The MACD histogram is also firmly in negative territory, confirming bearish momentum. Moreover, the GBPUSD has broken below several key support levels in recent days, suggesting that the bears are firmly in control. The GBPUSD today analysis shows that the trend is down.
A look at broader risk sentiment is also revealing. The SP500 is down 0.81% today, trading at 6625.3. Risk appetite is declining, safe-haven demand may increase, benefiting the USD. According to Bloomberg, investors are flocking to the safety of the US Dollar as global growth concerns mount.
Technicals as Tiebreaker: Which Way Will GBPUSD Break?
Given the conflicting signals, technical analysis can provide valuable insights into the likely direction of GBPUSD. Looking at the 1-hour chart, the pair is trading below its 200-period moving average, which is a bearish sign. However, the oversold RSI suggests that the downtrend may be nearing exhaustion. A decisive break above the 1.3249 resistance level on the 1H chart could trigger a short-covering rally, potentially pushing the pair towards higher targets, perhaps even testing the 1.32969 resistance on the 4H timeframe. The GBPUSD weekly outlook is bearish.
However, a failure to break above 1.3249 could open the door for further downside. In this scenario, the bears could target the 1.32202 support level on the 1H timeframe. A break below this level could pave the way for a test of the 1.32 support level on the 1D timeframe.
The GBPUSD RSI is at 30.58 on the 1D timeframe, indicating that there is still room for further downside before the pair becomes deeply oversold. The MACD histogram is also in negative territory, suggesting that bearish momentum is still in play.
Trade Plan: GBPUSD Bearish Continuation
Based on the technical and fundamental picture, a bearish continuation appears to be the most likely scenario for GBPUSD. The strong US Dollar, combined with the prevailing downtrend, suggests that the bears are likely to maintain control. The current GBPUSD price forecast is bearish.
If GBPUSD breaks above 1.3249, the pair could rally towards 1.32969 and potentially test 1.33411. This scenario requires a weakening dollar and improved risk sentiment.
If GBPUSD fails to break above 1.3249, the pair could decline towards 1.32202 and potentially test 1.32. This scenario is supported by a strong dollar and continued risk aversion.
Trade Recommendation
Recommendation: Short GBPUSD
- Entry Trigger: Break and close below 1.32202
- Target 1: 1.32
- Target 2: 1.315 (hypothetical)
- Stop Loss/Invalidation: A close above 1.3249 invalidates the trade idea.
- Probability: 60%
Traders should be aware that the upcoming US CPI data on Wednesday could trigger a significant move in GBPUSD. Manage your risk accordingly.
GBPUSD Support and Resistance Levels
Key Levels
Support Levels
Resistance Levels
Technical Summary
Technical Outlook Summary
| Indicator | Value | Signal |
|---|---|---|
| RSI (14) | 25.27 | Oversold |
| MACD Histogram | Negative | Bearish |
| Stochastic | 11.46/10.49 | Oversold |
| ADX | 44.45 | Strong Downtrend |
Frequently Asked Questions: GBPUSD Analysis
What happens if GBPUSD breaks above 1.3249 resistance?
A break above the 1.3249 resistance level could trigger a short-covering rally, potentially pushing the pair towards higher targets like 1.32969. This scenario would require a weakening dollar and improved risk sentiment.
Should I sell at current $1.32 levels given RSI at 25.27?
While the oversold RSI suggests caution, the strong downtrend and dollar strength favor a bearish strategy. A break below 1.32202 would confirm the bearish bias and open the door for further downside.
Is RSI at 25.27 a buy signal for GBPUSD?
The oversold RSI alone is not a sufficient buy signal. Traders should look for additional confirmation, such as a break above 1.3249 or a weakening dollar, before initiating a long position.
How will the US CPI data affect GBPUSD this week?
Stronger-than-expected US CPI data could further strengthen the dollar and weigh on GBPUSD. Conversely, weaker-than-expected data could weaken the dollar and trigger a bullish reversal in GBPUSD.
Track markets in real-time
AI-powered analysis, technical indicators and real-time price data.
Join Our Telegram Channel
Breaking market news, AI analysis and trading signals instantly.
Join Channel