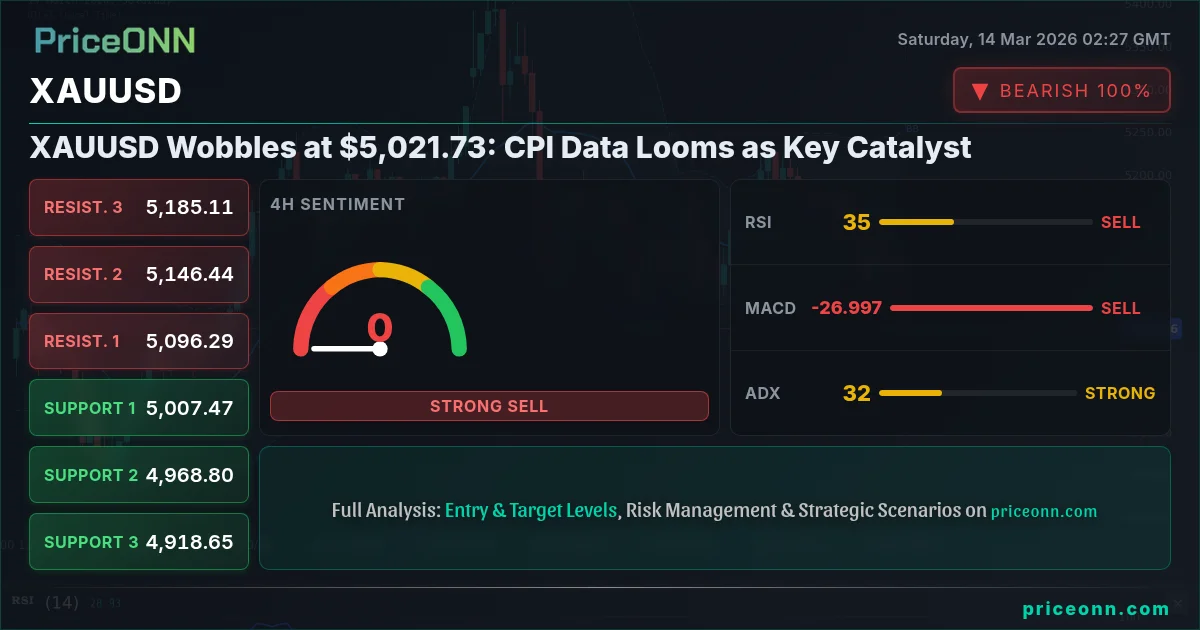
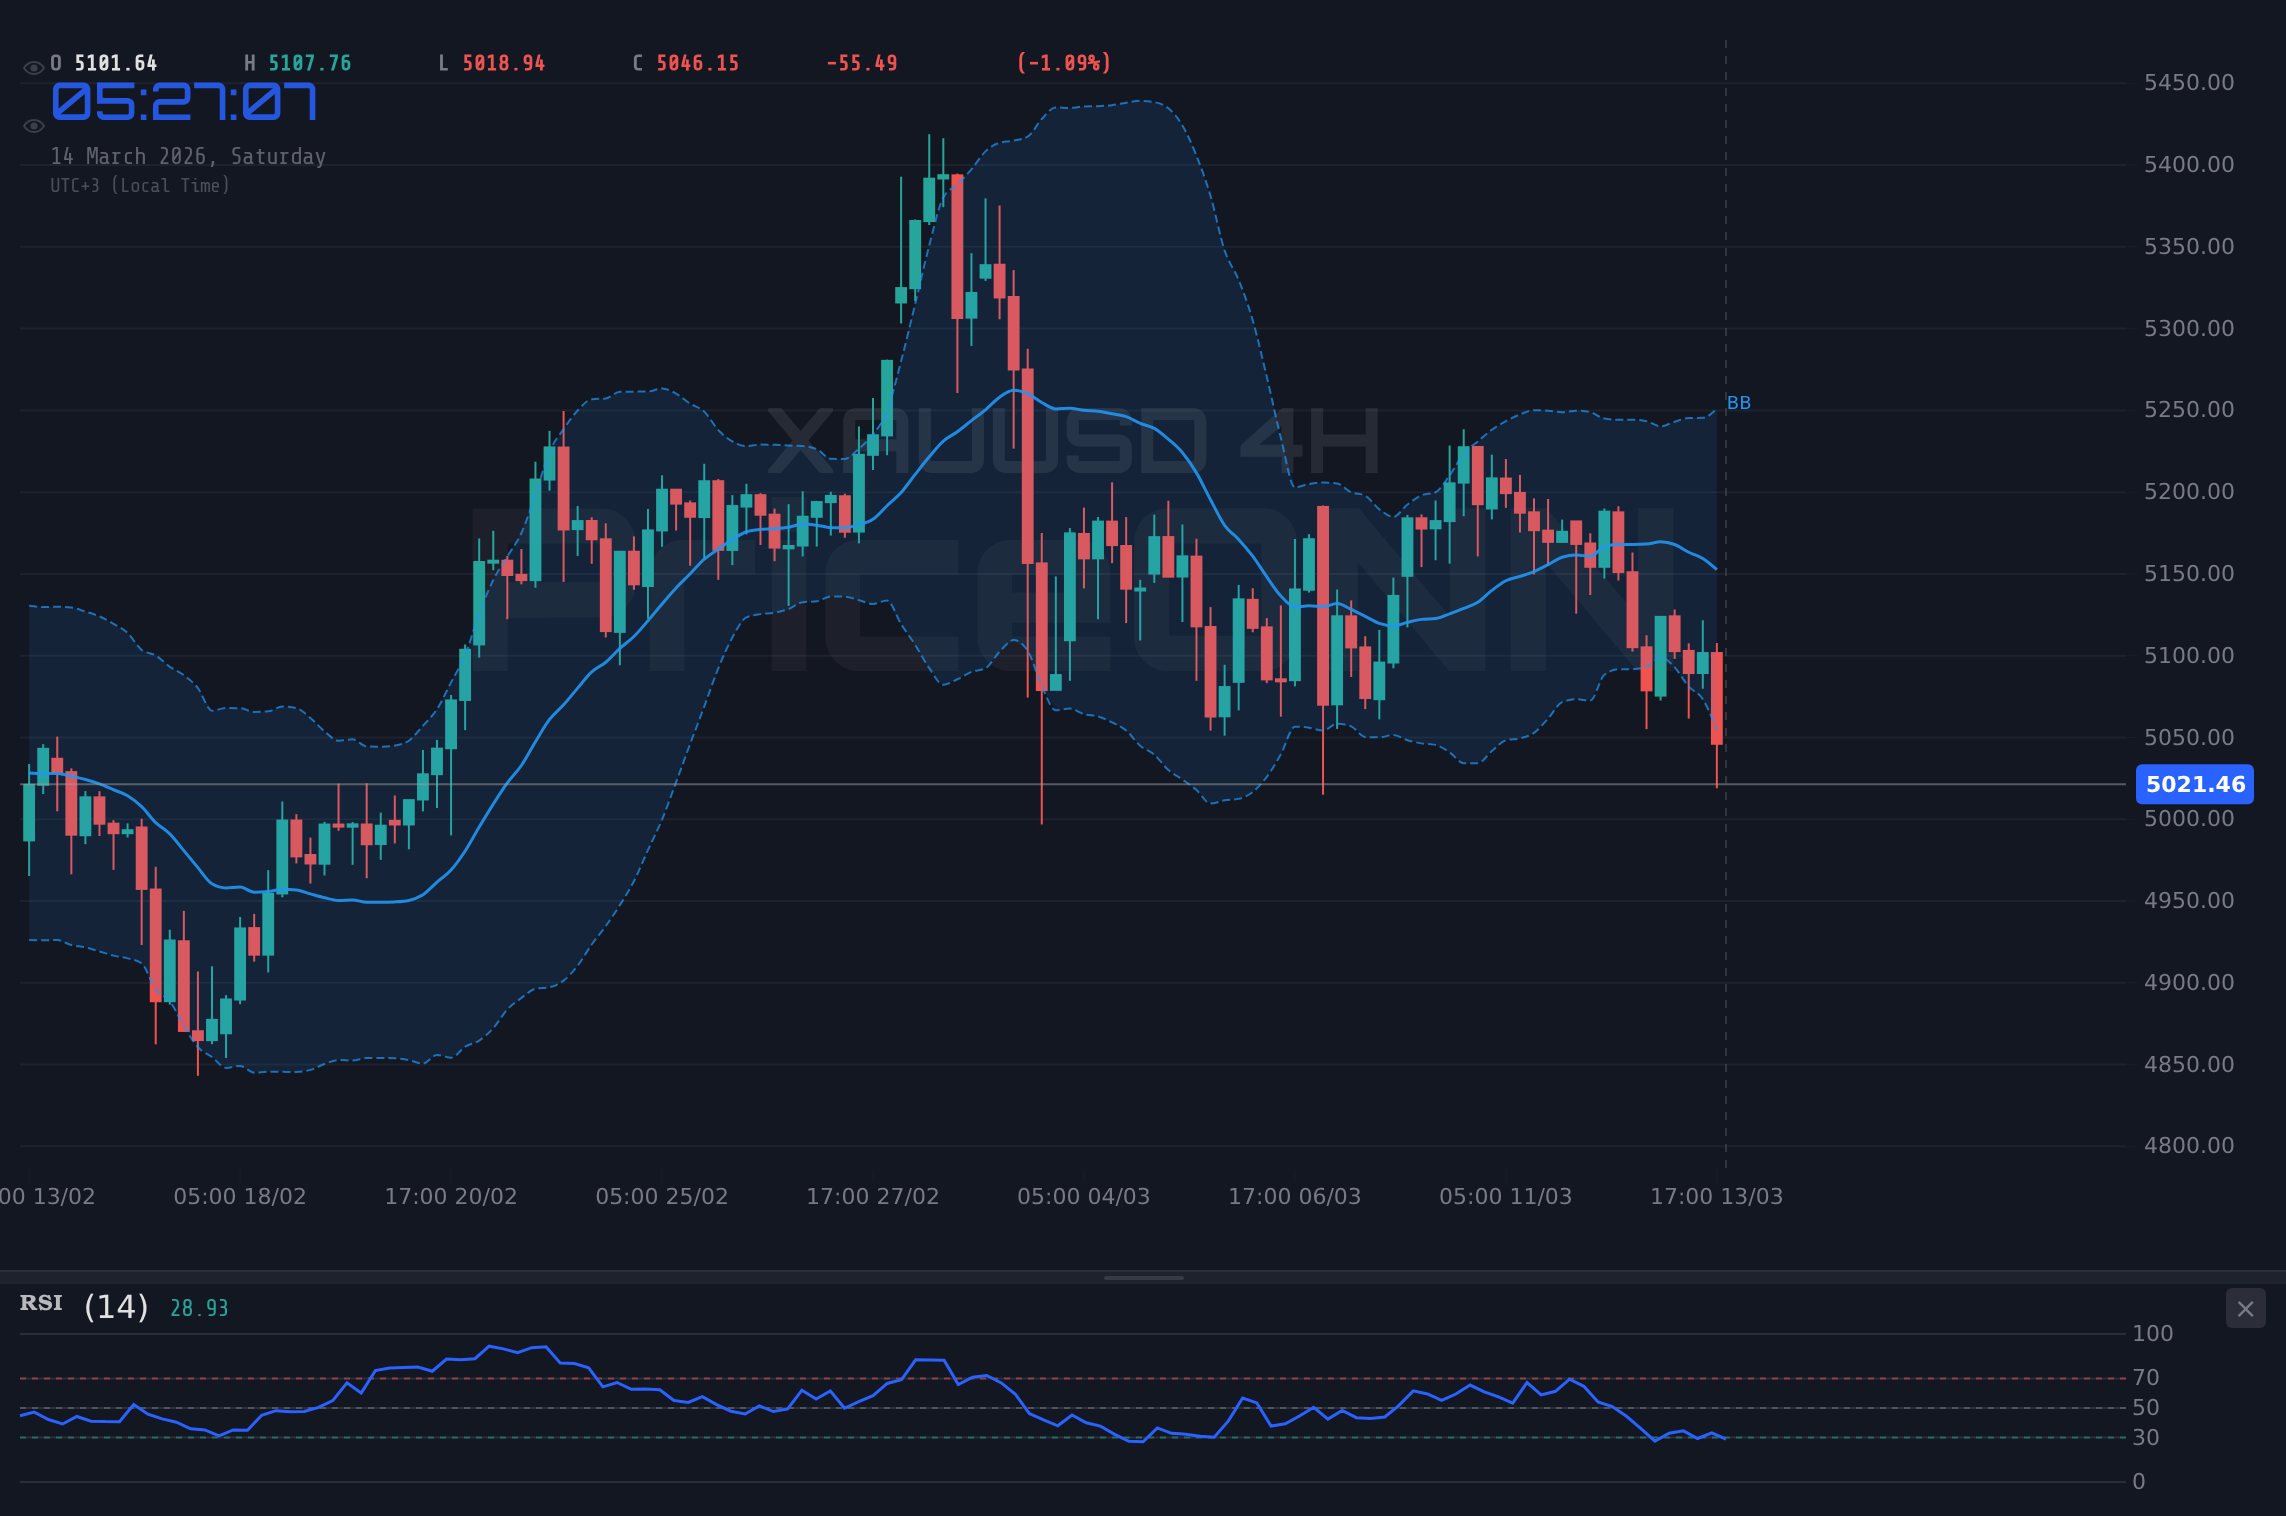
Gold is currently trading around $5,021.73, facing headwinds from a strengthening dollar. A tug-of-war is playing out between bulls hoping for a rebound and bears eyeing further declines. The upcoming CPI data will likely dictate the next major move.
- RSI at 28.53 on the 1H chart signals oversold conditions, potentially indicating a short-term bounce.
- Key resistance level to watch is $5,053.35, a break above which could trigger further upside.
- Stronger-than-expected CPI data could fuel further dollar strength, pressuring gold lower.
- Geopolitical tensions in the Middle East continue to provide underlying support for gold's safe-haven appeal.
The Bullish Case for XAUUSD
Despite the recent downturn, several factors support a bullish outlook for gold. The most immediate is the oversold condition on the 1H chart. With the RSI at 28.53, a technical bounce is plausible. Furthermore, geopolitical risks stemming from the Middle East provide a floor for gold prices. As tensions escalate, investors often flock to safe-haven assets like gold. According to Reuters, "escalating tensions in the Middle East are driving demand for safe-haven assets." This underlying demand can cushion gold from further downside.
Moreover, central bank buying remains a significant tailwind for gold. While specific data on central bank gold purchases wasn't provided in today's feed, it's crucial to remember that central banks, particularly from Russia and China, have been consistent accumulators of gold over the past decade. This long-term trend provides structural support to gold prices. Also, the SP500 is down -0.81% today, which may cause investors to move to safer assets like gold.
From a technical perspective, a break above the immediate resistance at $5,053.35 could signal a shift in momentum. This level corresponds with the 1H chart's R1 resistance. A successful breach could open the door for a test of the next resistance zone around $5,060.30. While the ADX on the 1H chart reads 41.71, indicating a strong downtrend, oversold conditions often precede trend reversals.
The Bearish Case for XAUUSD
Countering the bullish arguments is the persistent strength of the US dollar. The DXY is currently trading at 100.2, up 0.8% on the day. A stronger dollar makes gold more expensive for holders of other currencies, dampening demand. As PriceONN market news reported, "Gold price heads for weekly loss as DXY surges above 100.00." This inverse correlation between gold and the dollar is a key factor to watch.
Furthermore, rising oil prices are fueling inflation fears, potentially leading to more aggressive monetary tightening by central banks. Brent crude is currently at $103.82 and WTI at $99.18. If the Fed adopts a more hawkish stance, real interest rates could rise, diminishing gold's appeal as a non-yielding asset. As one analyst put it, "Gold struggles as Oil-driven inflation fears weigh on global interest rate outlook."
Technically, the 4H and 1D charts paint a bearish picture. The 4H trend is neutral, but the RSI at 34.73 suggests further downside potential. The MACD on both the 4H and 1D charts shows negative momentum, indicating that selling pressure remains. The stochastic on the 1D chart is showing a downward trend, which signals more negative price action to come. If gold breaks below the immediate support at $5,022.05, a move towards the next support level at $5,025.47 becomes likely.
Technicals as Tiebreaker: Which Way Will XAUUSD Break?
Given the conflicting signals, technical analysis can help determine the most probable direction for XAUUSD. The 1H chart suggests a potential short-term bounce from oversold conditions, but the broader trend remains bearish. The ADX readings across multiple timeframes confirm the strength of the downtrend. The 1D ADX is at 12.18, which suggests a weak trend, but the 4H is at 30.96 which indicates a strong downtrend.
A key level to watch is $5,022.05. A sustained break below this level would confirm the bearish thesis and open the door for a test of the next support at $4,972.12. Alternatively, a decisive move above $5,053.35 could trigger a short-covering rally towards $5,069. However, given the overall bearish sentiment and the strength of the dollar, the path of least resistance appears to be to the downside.
While the 1H stochastic shows a K value of 21.39 and a D value of 26.44, which indicates an upward trend, the 4H Stochastic shows a K value of 20.3 and a D value of 26.62 which indicates a downward trend. This conflict in the Stochastic trend could be an indication that the price is indecisive and will continue to consolidate in a tight range.
Trade Plan: Short XAUUSD on Confirmation
Based on the technical picture, a short trade in XAUUSD is warranted, but only upon confirmation of the bearish thesis. The most prudent approach is to wait for a clear break below $5,022.05 before initiating a short position.
If XAUUSD breaks above $5,053.35, expect a rally towards $5,060.3, potentially extending to $5,069. A sustained move above $5,069 could invalidate the bearish thesis.
A break below $5,022.05 opens the door for a move towards $5,025.47, with a potential extension to $4,972.12. This scenario gains strength if the DXY continues to rise.
Entry Trigger: Short XAUUSD at $5,021.73 on a confirmed break below $5,022.05.
Target 1: $5,025.47
Target 2: $4,972.12
Stop/Invalidation: $5,053.35 (a break above this level invalidates the short trade)
Probability: 60% (given the strength of the dollar and the overall bearish technical picture)
CPI data is due out next week. Stronger-than-expected data could trigger a sharp move lower in gold. Manage your risk accordingly.
XAUUSD Key Levels
Key Levels
Support Levels
Resistance Levels
Frequently Asked Questions: XAUUSD Analysis
What happens if XAUUSD breaks below $5,022.05?
A break below the $5,022.05 support level could trigger a further decline towards the next support at $5,025.47. This would confirm the bearish trend and increase the likelihood of further downside.
Should I short XAUUSD at current $5,021.73 levels given RSI at 28.53?
While the oversold RSI at 28.53 suggests a potential bounce, it's prudent to wait for confirmation before initiating a short position. A confirmed break below $5,022.05 would provide a higher probability entry.
Is the negative MACD signal on the 4H chart a reliable indicator for XAUUSD?
The negative MACD signal on the 4H chart indicates that bearish momentum is prevailing. However, it's essential to consider other factors, such as support levels and the strength of the dollar, before making a trading decision.
How will the upcoming CPI data affect XAUUSD this week?
Stronger-than-expected CPI data could fuel further dollar strength, putting downward pressure on gold. Conversely, weaker-than-expected data could weaken the dollar and provide a boost to gold prices.
Track markets in real-time
AI-powered analysis, technical indicators and real-time price data.
Join Our Telegram Channel
Breaking market news, AI analysis and trading signals instantly.
Join Channel