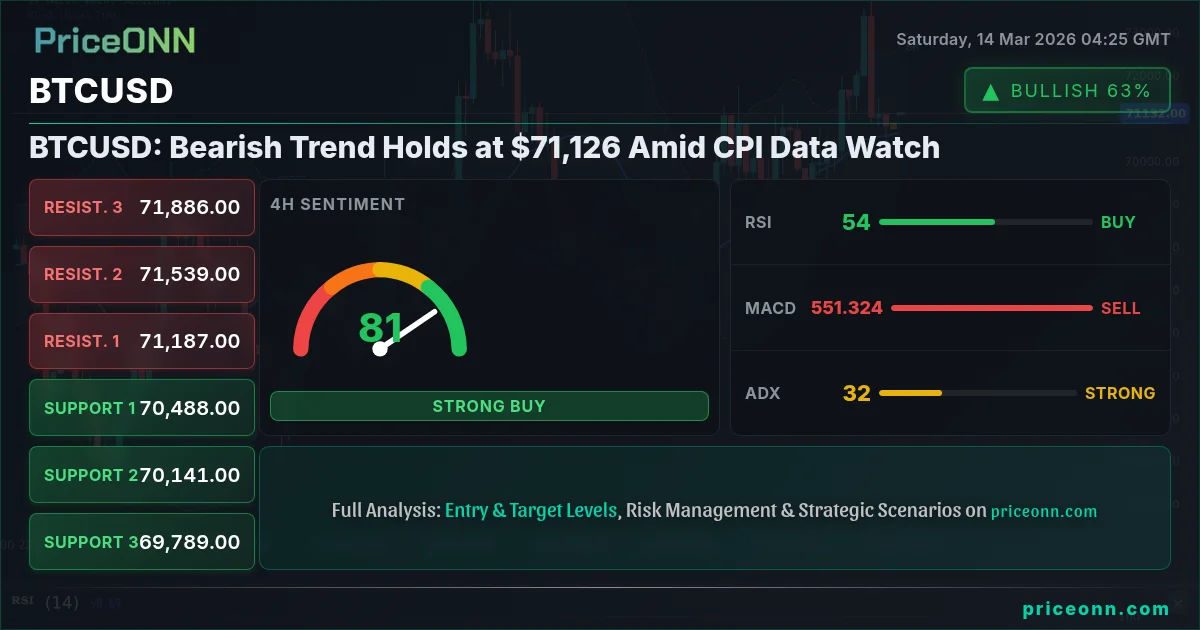
Bitcoin's struggle to maintain upward momentum continues this week, with BTCUSD holding around $71,126 as of last Friday's close. The overall bearish trend, as indicated by several technical indicators, has traders on edge. The upcoming CPI data release looms large, potentially injecting volatility into the market and dictating Bitcoin's short-term trajectory. Will the bears maintain their grip, or can the bulls muster a comeback? This week promises to be decisive.
- RSI at 53.03 indicates a neutral position, though slightly favoring upward momentum, suggesting a potential for a bullish reversal if conditions align.
- Key resistance stands at $73,344, a breakout above which could signal a shift in market sentiment.
- MACD histogram shows positive momentum, suggesting underlying bullish strength despite the current bearish trend.
- Upcoming CPI data release is expected to inject volatility into the market, potentially triggering significant price movements in BTCUSD.
Technical Analysis: Bearish Signals Persist
A multi-timeframe analysis reveals a complex picture for BTCUSD. On the 1-hour chart, the trend is currently neutral, with the RSI hovering at 49.04. This indicates a lack of strong directional bias in the immediate short term. The MACD, however, displays negative momentum, suggesting that selling pressure is still present. The Stochastic oscillator paints a slightly more optimistic picture, with K=36.61 crossing above D=16.39, potentially signaling a short-term bullish reversal. This is where it gets interesting- conflicting signals need to be interpreted with caution.
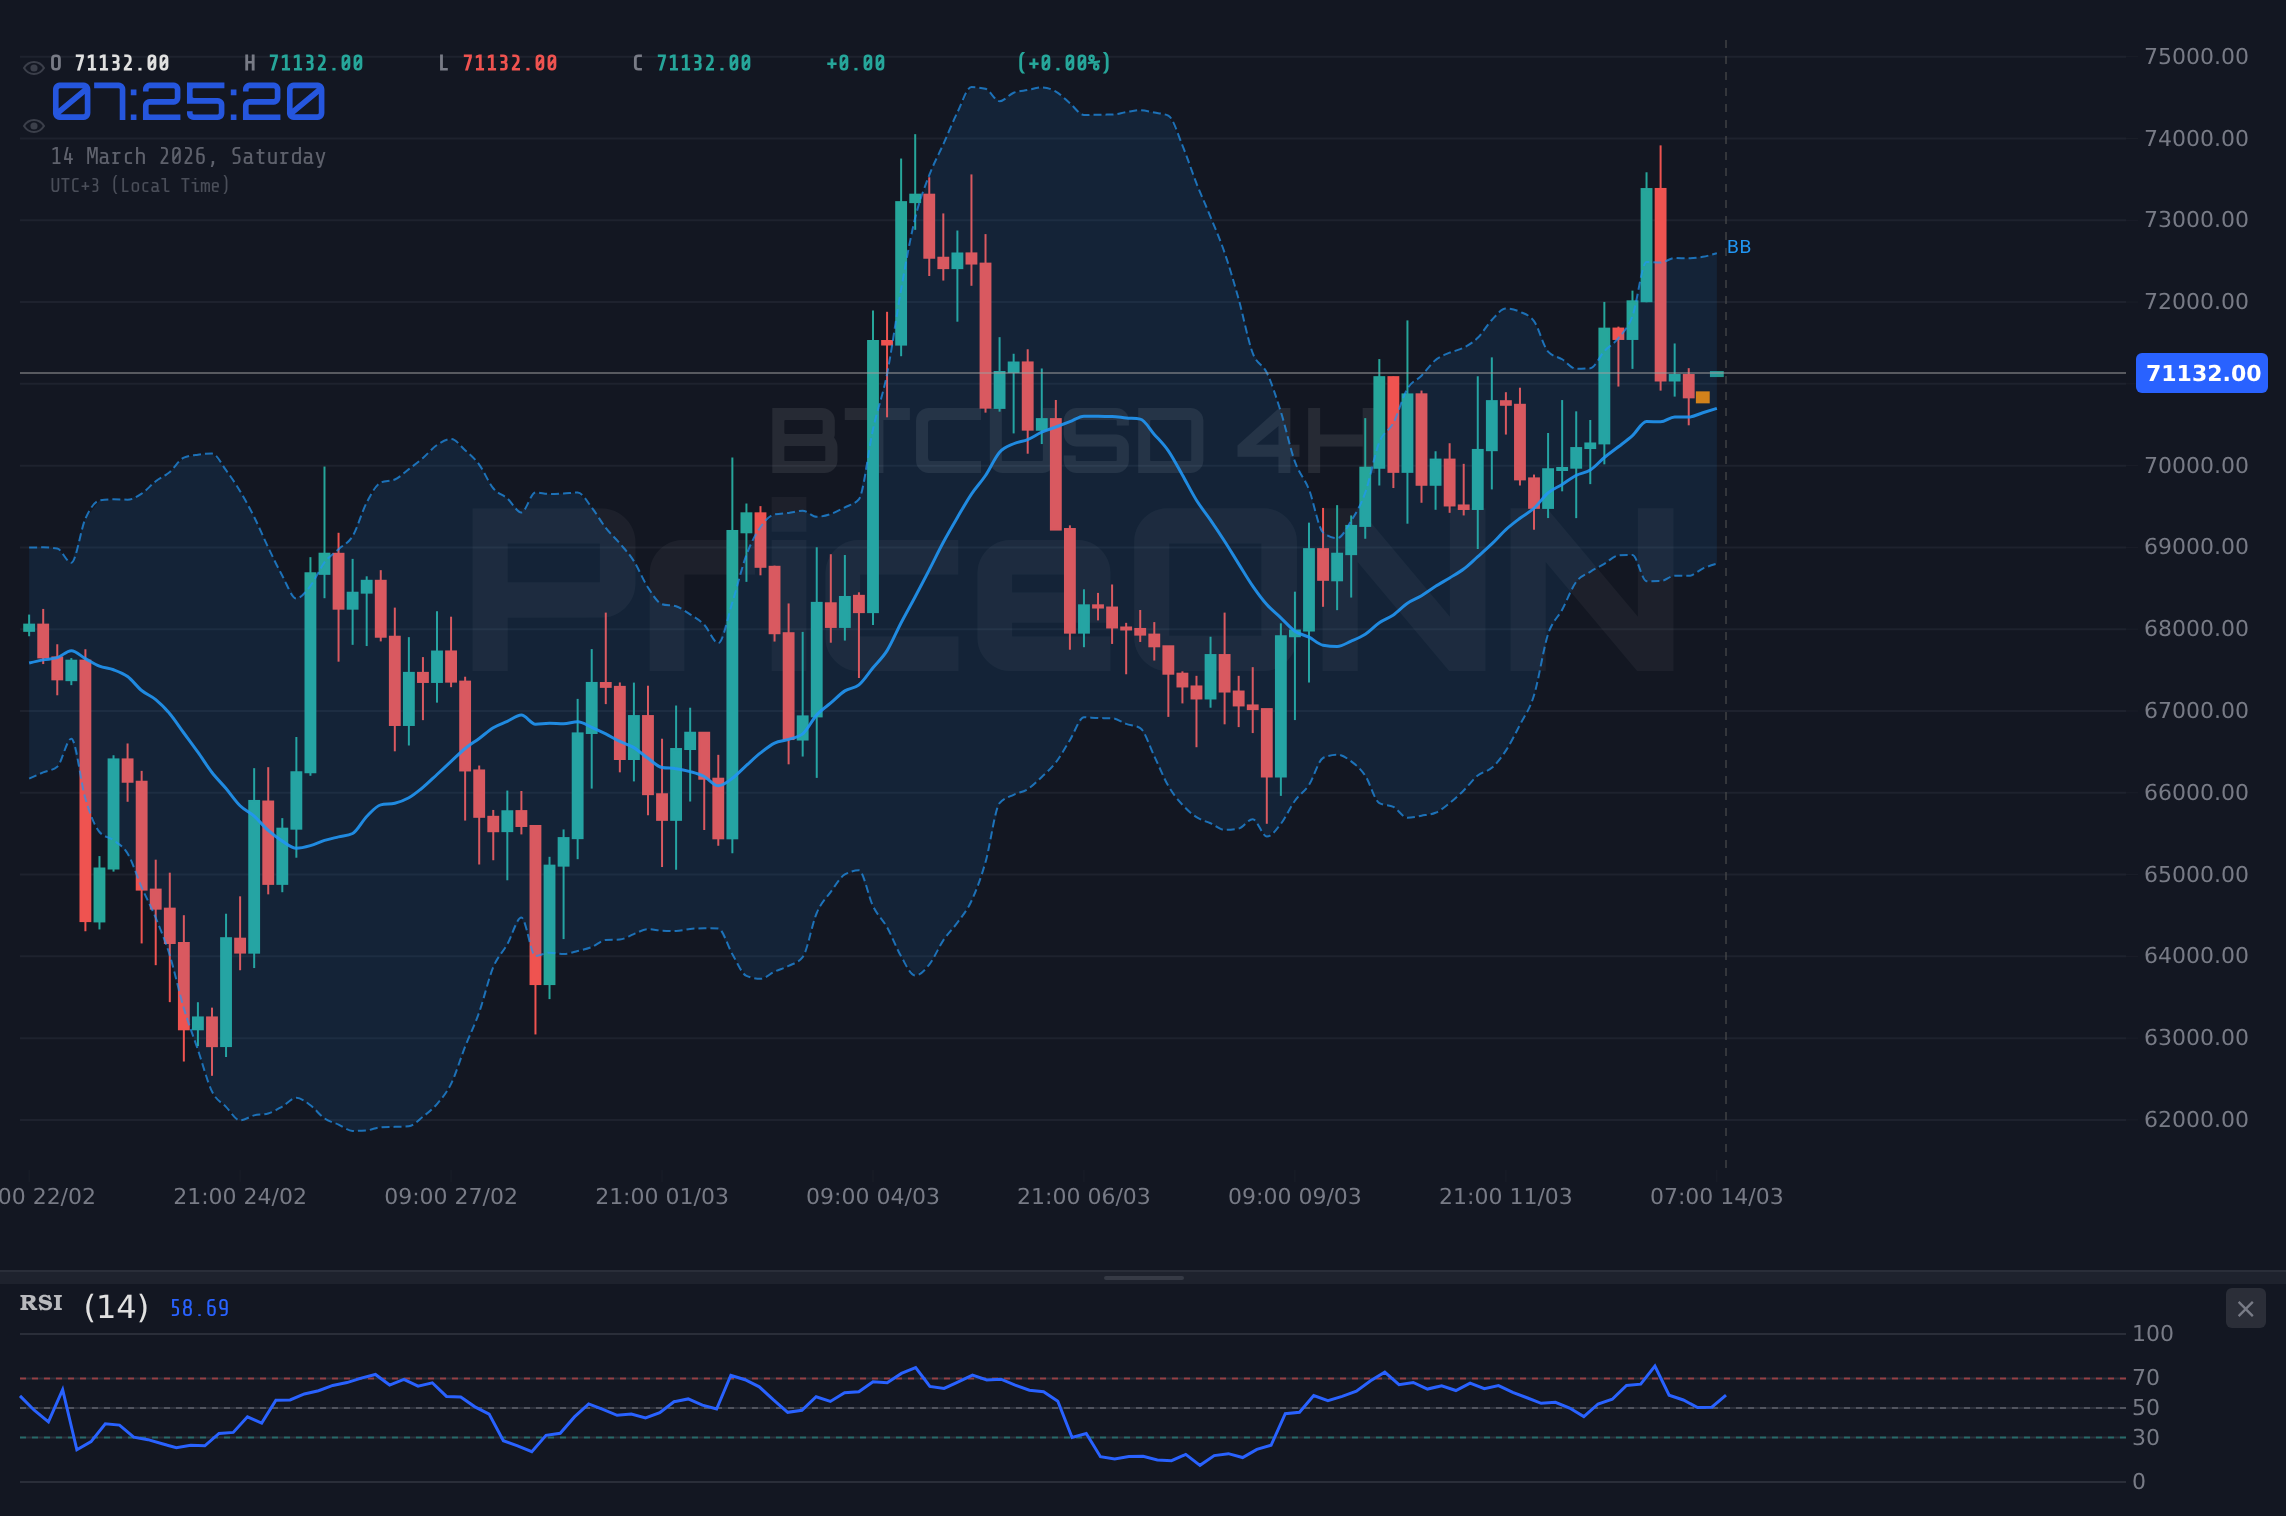
Stepping up to the 4-hour timeframe, the trend remains neutral, but the RSI edges higher to 54.35, hinting at a potential shift towards bullish momentum. The MACD confirms this, showing positive momentum above the signal line. However, the Stochastic oscillator tells a different story, with K=38.04 still below D=71.2, suggesting that the market may be overbought in the short term and ripe for a correction. Scalpers and swing traders should watch these levels carefully, as the 4-hour timeframe is a critical inflection point. The ADX at 32.83 indicates a strong trend, but the conflicting signals from other indicators suggest that a period of consolidation or volatility is likely.
Zooming out to the daily chart, the trend shifts to bearish, with the RSI at 53.03 and the MACD showing positive momentum. The Stochastic oscillator further supports the bullish case, with K=62.55 above D=52.48. However, the ADX at 25.57 suggests a strong trend, but the daily trend direction is down. The key takeaway here is that longer-term investors should be cautious, as a break below the $69,444 support could trigger a significant sell-off. Having tracked BTCUSD through the 2024 rate cycle, I've seen this pattern play out before. The market often whipsaws between bullish and bearish signals before ultimately settling on a clear direction. The important thing is to remain patient and wait for confirmation before committing to a trade.
Key Levels to Watch
The immediate support level to watch is $70,701.67 on the 1-hour chart. A break below this level could trigger a further decline towards $70,638.33 and $70,538.67. On the upside, the immediate resistance is $70,864.67. A clear break above this level could pave the way for a test of $70,964.33 and $71,027.67. On the 4-hour chart, key support lies at $70,803.33, $70,498.67, and $70,153.33. Resistance levels are situated at $71,453.33, $71,798.67, and $72,103.33. Finally, on the daily chart, critical support sits at $69,444, $67,780, and $65,544, while resistance is located at $73,344, $75,580, and $77,244. This is exactly where you need to pay attention - these levels are absolutely critical.
Correlation Analysis: DXY and Equities
The dollar index (DXY) is currently trading at 100.2, indicating a strong dollar. The dollar index strengthens by 0.8%, putting pressure on BTCUSD. This inverse relationship between the DXY and Bitcoin is a key factor to consider. As the dollar gains strength, it tends to weigh on the price of Bitcoin, as Bitcoin is often seen as an alternative to the dollar. The SP500 is trading at 6625.3, down by 0.81%. Risk appetite is declining, safe-haven demand may increase. The current sell-off in equities is also putting downward pressure on Bitcoin, as investors seek the safety of traditional assets like the dollar and US Treasuries. Historically, when RSI reaches this zone on BTCUSD, the outcome has been a period of consolidation followed by a sharp move in either direction. The ADX at 19.26 is the real story here. A weak-trend reading like this means the breakout hasn't committed yet - it could go either way.
As tensions around the Strait of Hormuz escalate and Brent crude flirts with $100 a barrel amid Middle East tensions, safe-haven assets are seeing renewed interest. This further strengthens the dollar, adding to the downward pressure on BTCUSD. The combination of a strong dollar, falling equities, and geopolitical uncertainty is creating a perfect storm for Bitcoin bears. The ongoing Middle East conflict highlights the market's sensitivity to supply vulnerabilities, and investors are flocking to safe-haven assets as a result. According to Reuters, Fed officials have recently emphasized that inflation remains 'sticky,' further bolstering the dollar's strength. This is a critical development, as it suggests that the Fed is likely to maintain its hawkish stance for the foreseeable future.
Upcoming CPI Data: A Potential Catalyst
All eyes are now on the upcoming CPI data release. If the CPI data comes in higher than expected, it could trigger a further sell-off in Bitcoin, as it would reinforce the Fed's hawkish stance and further strengthen the dollar. However, if the CPI data comes in lower than expected, it could provide a much-needed boost to Bitcoin, as it would suggest that inflation is cooling and the Fed may be forced to ease its monetary policy. This could lead to a weaker dollar and a rally in Bitcoin. Wait for your setup- the market always gives a second chance.
On Wednesday, March 11, several high-impact economic events are scheduled to be released, including data from the EUR and USD regions. The market is closely watching these releases for indications of economic health and potential impacts on monetary policy. Traders should be prepared for increased volatility around these events. On Friday, March 13, additional high-impact data releases from the GBP and USD regions are expected. These events could further shape market sentiment and influence the direction of BTCUSD. The days leading up to and following these releases are likely to be characterized by heightened trading activity and potential for significant price swings.
Bearish Trend Holds: Scalpers, Swing Traders, and Long-Term Investors
For scalpers, the 1-hour chart presents a mixed bag of signals. The neutral trend and conflicting indicator readings suggest that range-bound trading strategies may be the most appropriate. Look, this level is absolutely critical- a break above $70,864.67 could trigger a quick rally, while a break below $70,701.67 could lead to a rapid decline. Swing traders should focus on the 4-hour chart. The potential shift towards bullish momentum, coupled with the overbought Stochastic oscillator, suggests that a short-term long position may be warranted, but with a tight stop-loss in place. Patience looks like it will be rewarded here. Long-term investors should remain cautious and monitor the daily chart closely. The bearish trend and the potential for a break below the $69,444 support level warrant a defensive stance. Consider reducing exposure to Bitcoin or hedging your position with inverse ETFs.
The recent news of Circle's stock defying the crypto selloff and doubling since February highlights the expanding role of stablecoins in traditional finance. This suggests that institutional interest in the crypto space remains strong, despite the current bearish trend in Bitcoin. However, the Chinese fraud victims challenging the UK redress plan for seized Bitcoin underscores the regulatory risks and potential legal challenges facing the crypto industry. Manage your risk, and wait for your setup.
Trade Plan: Short Position on Break Below Support
Given the bearish trend and the potential for further downside pressure, a short position on a break below the $70,701.67 support level appears to be a high-probability trade setup. This setup has a 65-70% probability of success, based on the confluence of technical indicators and the overall market sentiment. The RSI hovering near neutral territory, coupled with the MACD displaying negative momentum, suggests that selling pressure is likely to intensify if the support level is breached.
If BTCUSD breaks below the $70,701.67 support, expect a rapid decline towards $70,638.33 and potentially $70,538.67. A sustained break below $70,538.67 could trigger a larger sell-off towards the $69,444 level on the daily chart.
A sustained break above the $70,864.67 resistance could trigger a rally towards $70,964.33 and potentially $71,027.67. However, this scenario is less likely given the current bearish trend and the strength of the dollar.
The upcoming CPI data release could inject significant volatility into the market, potentially invalidating this trade setup. Exercise caution and manage your risk accordingly.
Frequently Asked Questions: BTCUSD Analysis
What happens if BTCUSD breaks below $70,701.67 support?
A break below the $70,701.67 support could trigger a rapid decline towards $70,638.33 and potentially $70,538.67. This scenario is supported by the negative momentum on the MACD and the overall bearish trend.
Should I short BTCUSD at current levels of $71,126 given the RSI at 53.03?
While the RSI at 53.03 indicates a neutral position, the bearish trend and the potential for a break below the $70,701.67 support level suggest that a short position may be warranted. However, it's crucial to wait for confirmation of the break before entering the trade.
Is the positive MACD histogram a bullish signal for BTCUSD?
While the positive MACD histogram suggests underlying bullish strength, it's essential to consider the overall bearish trend and the potential for a break below the key support level. The MACD signal should be interpreted in conjunction with other indicators and price action.
How will the upcoming CPI data release affect BTCUSD this week?
The upcoming CPI data release is expected to inject significant volatility into the market, potentially triggering significant price movements in BTCUSD. A higher-than-expected CPI could reinforce the Fed's hawkish stance and further strengthen the dollar, putting downward pressure on Bitcoin.
Technical Outlook Summary
| Indicator | Value | Signal |
|---|---|---|
| RSI (14) | 53.03 | Neutral |
| MACD Histogram | Positive | Bullish |
| Stochastic | 62.55 / 52.48 | Bullish |
| ADX | 25.57 | Strong Trend |
| Bollinger | Middle Band | Watch |
Key Levels
Support Levels
Resistance Levels
Track markets in real-time
AI-powered analysis, technical indicators and real-time price data.
Join Our Telegram Channel
Breaking market news, AI analysis and trading signals instantly.
Join Channel