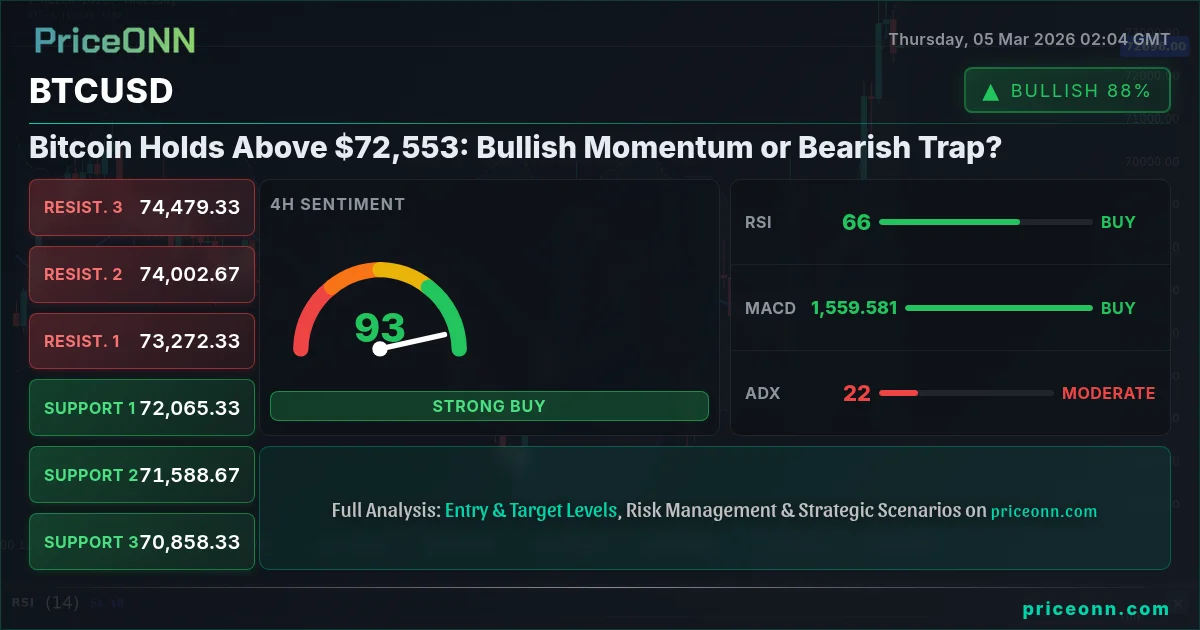
Bitcoin's price is currently hovering around $72,553, a level that has traders on high alert. After a 6.65% surge today, the question on everyone's mind is: can this bullish momentum be sustained, or is it a cleverly disguised bear trap? Today's BTCUSD analysis will explore both scenarios, weighing the technical indicators and market sentiment to provide a comprehensive bitcoin price forecast 2026.
- RSI at 62.15 on the 1H timeframe indicates increasing buying pressure, but not yet overbought.
- Critical support sits at $72,545 on the 1H chart, a level to watch for short-term pullbacks.
- MACD shows negative momentum on the 1H, suggesting a potential pullback despite the overall bullish trend.
- Strong daily ADX of 42.11 confirms the overall bullish trend, but short-term volatility persists.
The Bull Case: Bitcoin's Breakout Potential
The bullish narrative for Bitcoin hinges on several factors. First, the daily chart shows a strong ADX of 42.11, signaling a powerful uptrend. This is not a weak, hesitant move-this is a confident push higher. The current price of $72,553 is testing immediate resistance, and a successful break above the 1H resistance at $72,992 could open the door for a run towards the next target of $73,221. The 4H RSI at 66.59 also supports this view, indicating that there's still room for the rally to continue before reaching overbought conditions. Scalpers might look for quick entries above $72,553 targeting $72,992, while swing traders could eye $73,221 as a potential take-profit level. Long-term investors will see this as confirmation of the overall bullish trend, adding to their positions on any significant dips. The recent news of escalating tensions in the Middle East, as reported across various financial outlets, is also driving investors toward safe-haven assets, potentially benefiting Bitcoin.
Looking at the broader market context, the SP500 is up 0.76% today, indicating a risk-on sentiment that often benefits Bitcoin. The NZD/USD pair has seen a significant surge, driven by a weaker US Dollar, which could further bolster Bitcoin's appeal as an alternative asset. Historically, Bitcoin has shown resilience during periods of geopolitical instability. If the DXY (Dollar Index) continues its current downtrend, sitting at 98.53, this could provide further tailwinds for Bitcoin's price. The current bullish sentiment is also reflected in the ETHUSD price, which has surged by 7.53% today, indicating a broader crypto market rally. The bitcoin price forecast 2026 remains positive if these conditions hold.
The Bear Case: A Potential Bull Trap
Despite the bullish momentum, there are reasons to be cautious. The 1H chart shows a Stochastic reading of K=27.48, D=58.59, indicating a potential overbought condition and a possible pullback. The MACD on the same timeframe displays negative momentum, suggesting that the bullish trend might be losing steam. If Bitcoin fails to hold the 1H support at $72,545, we could see a retracement towards the next support level at $72,327. The ADX on the 1H chart, while showing a strong trend at 37.66, also suggests that the market might be due for a period of consolidation or a correction. Scalpers should be wary of fakeouts above $72,553, while swing traders might consider short positions if $72,545 is breached. Long-term investors should remain cautious and avoid adding to their positions until a clear consolidation pattern emerges.
Furthermore, the geopolitical situation, while potentially bullish for Bitcoin, also presents risks. A sudden de-escalation of tensions could lead to a reversal of safe-haven flows, negatively impacting Bitcoin's price. The DowJones30 shows a neutral trend in the 1H timeframe, suggesting that the broader market sentiment is not entirely risk-on. If the DXY starts to strengthen, this could put downward pressure on Bitcoin. The overall trend for SP500 is bearish, which is indicated by the overall rating of SAT. Traders should watch for a breakdown below $72,545 as a confirmation of the bearish scenario. Historically, Bitcoin has experienced sharp corrections after similar parabolic moves, making it essential to manage risk carefully.
Technicals as Tiebreaker: Multi-Timeframe Analysis
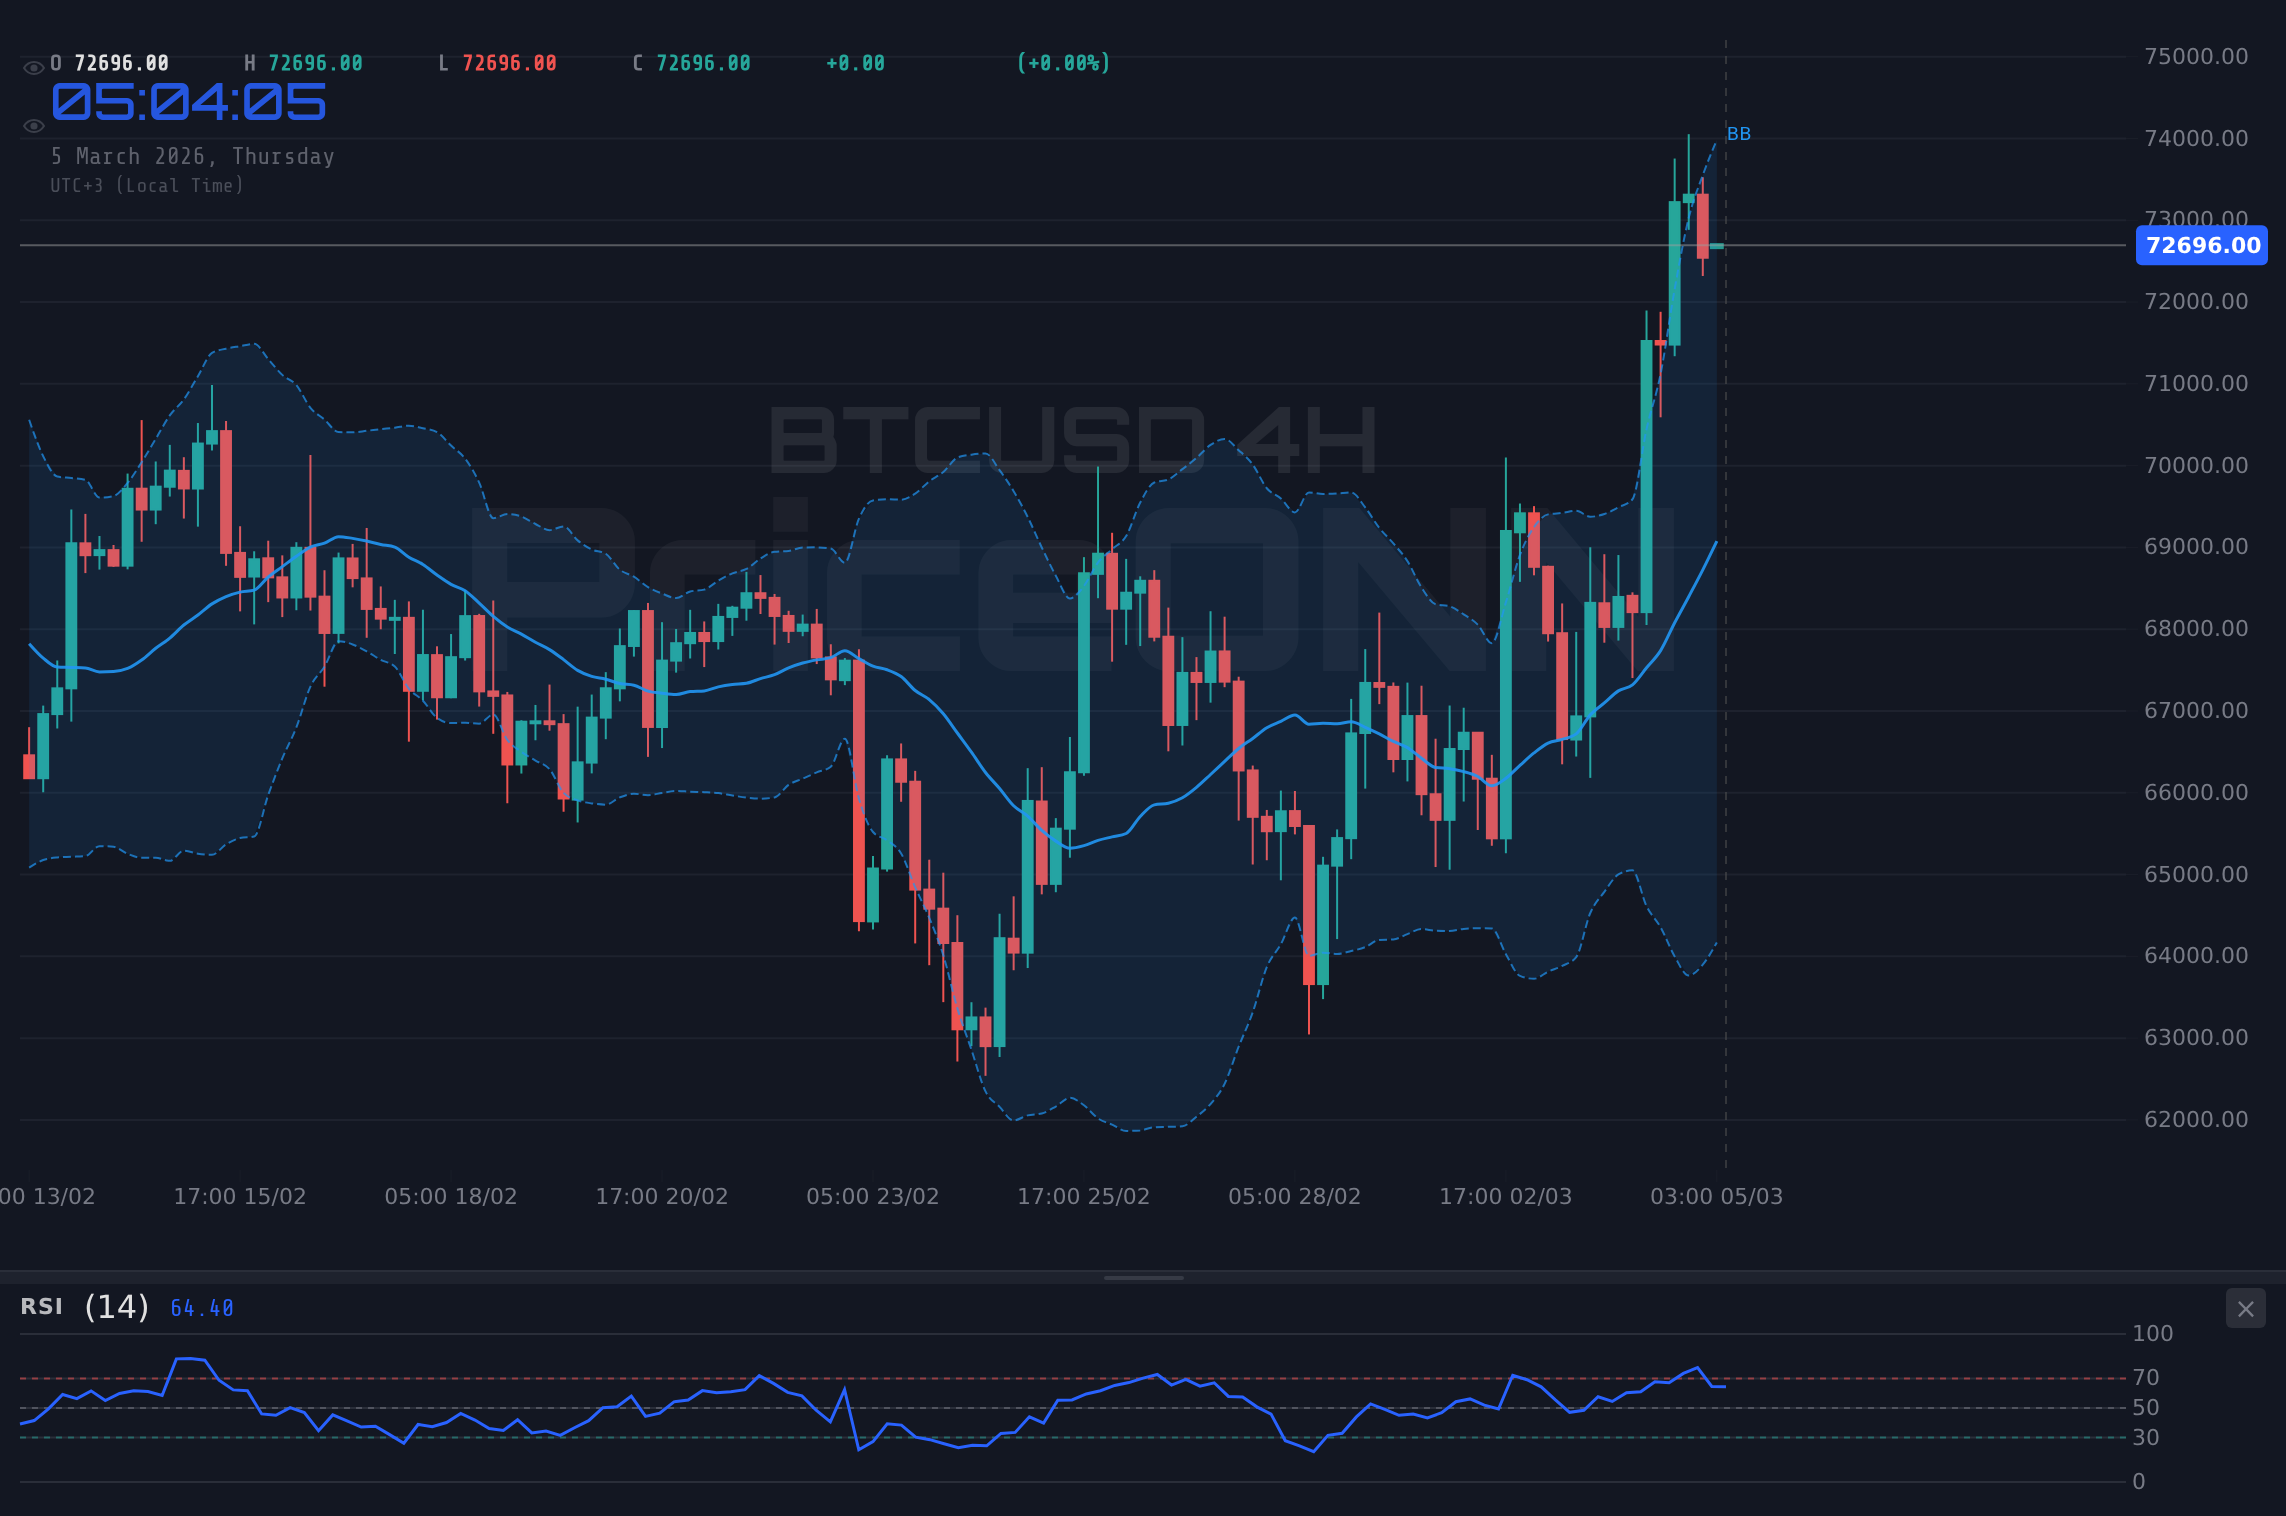
To gain a clearer picture, we need to analyze Bitcoin across multiple timeframes. On the 1D chart, the RSI is at 54.75, indicating neutral territory and suggesting that the market is neither overbought nor oversold. The MACD, however, shows positive momentum, providing some support to the bullish case. The Stochastic reading on the 1D chart is K=83.52, D=63.23, indicating overbought conditions and a potential pullback. The key level to watch on the daily timeframe is $72,992, which represents the 1H resistance level. A sustained break above this level would confirm the bullish breakout, while a failure to do so would increase the likelihood of a bearish reversal. The 4H chart also presents a mixed picture, with the RSI at 66.59 and the MACD showing positive momentum. However, the Stochastic reading of K=88.17, D=81.54, suggests that the market is approaching overbought territory. The key level to watch on the 4H chart is $72,779.67, which represents the nearest support level. If this level is breached, we could see a deeper correction towards $72,246.33.
The correlation analysis reveals that Bitcoin is currently decoupling from its usual inverse relationship with the DXY. While a weaker dollar typically benefits Bitcoin, the current rally seems to be driven by other factors, such as safe-haven demand and broader crypto market sentiment. The rise in oil prices, with WTI at $77.07, could also be contributing to the bullish sentiment, as it indicates increasing inflation expectations. However, the overall trend for DowJones30 is neutral, which suggests that the broader market is not fully convinced by the bullish narrative. Traders should pay close attention to the upcoming economic data releases, particularly the USD events scheduled for the coming days, as these could provide further clues about the direction of the market. The bitcoin price forecast 2026 hinges on these factors.
Trade Recommendation: Watch Zone
Based on the current technical picture, the trade recommendation is to remain in a watch zone. A daily close above $72,992 would open the door for a test of the $73,221 level. Conversely, a break below $72,545 would likely lead to a test of $72,327. Patience will be rewarded here, so wait for the right setup before committing to a position. Scalpers should watch for range breakouts, swing traders should look for retest setups, and long-term investors should wait for a trend confirmation before deploying significant capital. A close above $72,992 would be a bullish sign, potentially leading to a test of the upper resistance levels. Conversely, failure to hold $72,545 could signal a deeper correction.
Frequently Asked Questions: BTCUSD Analysis
Is BTCUSD a good buy right now?
BTCUSD presents a mixed picture. The current price of $72,553 is testing resistance, and while there's bullish momentum, caution is advised. A daily close above $72,992 would signal a potential buying opportunity, while failure to hold $72,545 could lead to further downside.
What is the BTCUSD price forecast for this week?
The BTCUSD price forecast for this week is cautiously optimistic. A successful break above $72,992 could pave the way for a test of $73,221. However, failure to hold $72,545 could lead to a retracement towards $72,327. The probability of a bullish breakout is currently assessed at 60%.
What are the key support and resistance levels for BTCUSD?
Key support levels for BTCUSD are $72,545 and $72,327. Key resistance levels are $72,992 and $73,221. These levels should be closely monitored for potential breakout or breakdown signals.
Why is BTCUSD moving today?
BTCUSD is moving today due to a combination of factors including safe-haven demand driven by geopolitical tensions, positive sentiment in the broader crypto market, and technical factors such as a potential breakout above key resistance levels. The weakening US Dollar also provides tailwinds.
Technical Outlook Summary
| Indicator | Value | Signal |
|---|---|---|
| RSI (14) - 1H | 62.15 | Neutral |
| MACD - 1H | Negative | Bearish |
| Stochastic - 1H | K=27.48, D=58.59 | Bearish |
| ADX - 1H | 37.66 | Strong Trend |
| Bollinger Bands - 1H | Mid Band | Watch |
Key Levels
Support Levels
Resistance Levels
Track markets in real-time
AI-powered analysis, technical indicators and real-time price data.
Join Our Telegram Channel
Breaking market news, AI analysis and trading signals instantly.
Join Channel