Brent Crude Tests $106.34 Resistance Amid Dollar Surge and Geopolitical Fears
Brent crude oil hovers near $104.78, facing resistance at $106.34 as a surging US Dollar and escalating geopolitical tensions heighten market volatility. Discover key levels and scenarios.
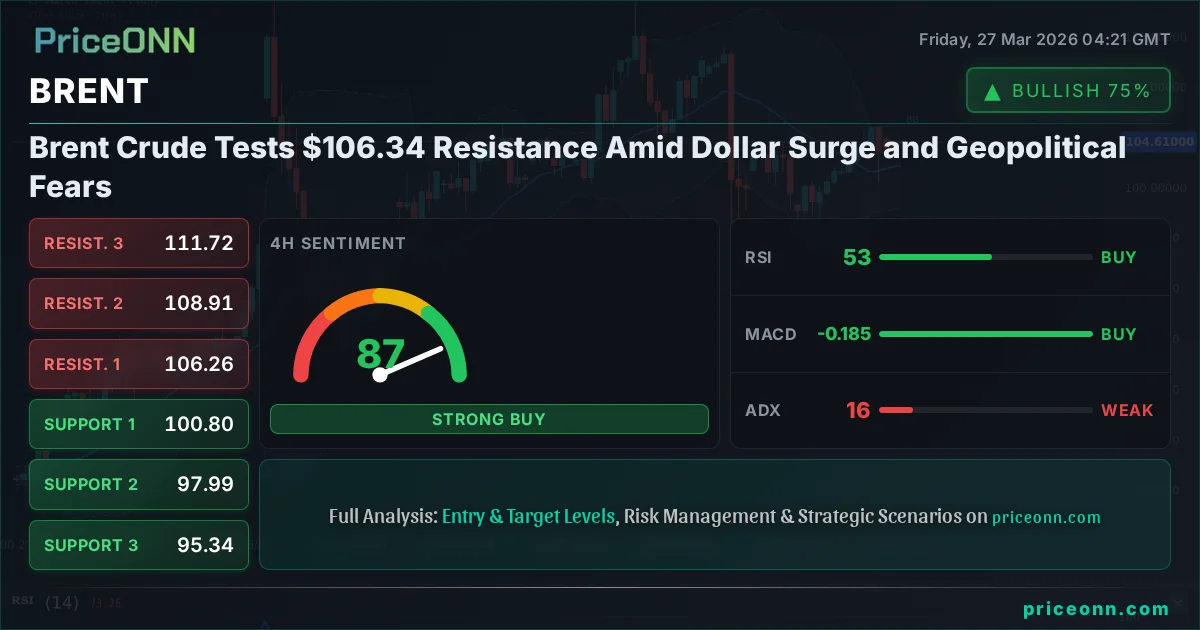
Brent crude oil is currently trading at $104.78, finding itself at a critical juncture as it approaches the $106.34 resistance level. This price action unfolds against a backdrop of a strengthening US Dollar, which has surged for three consecutive days, and intensifying geopolitical risks that are casting a long shadow over global energy markets. The interplay between these forces is creating a complex environment for traders, demanding a nuanced approach to navigating potential opportunities and risks. Understanding the cross-market correlations and the underlying sentiment is paramount for deciphering Brent's next move.
- With Brent crude at $104.78, the 4-hour chart shows a neutral trend (50% strength) while the daily chart indicates a strong bullish trend (100% strength) with ADX at 62.36.
- Critical resistance is eyed at $106.34, with a sustained break above this level potentially targeting $109.05.
- The US Dollar Index (DXY) at 99.64 is strengthening, typically exerting downward pressure on oil prices, but geopolitical factors are currently overriding this correlation.
- Escalating Middle East tensions and fears of a Hormuz blockade pose a significant upside risk to oil prices, with some models suggesting a $200 per barrel scenario.
The Dollar's Ascent and Its Impact on Commodities
The US Dollar Index (DXY) has been on a tear, climbing for three straight days and nearing the significant 99.90 mark. This upward momentum, currently trading at 99.64, is largely driven by its safe-haven appeal amidst escalating global uncertainties. Historically, a stronger dollar tends to put a lid on dollar-denominated commodities like Brent crude, as it makes these assets more expensive for holders of other currencies. However, the current market narrative presents a fascinating divergence. Despite the dollar's strength, Brent crude is showing resilience, even pushing higher. This suggests that the geopolitical risk premium is currently outweighing the headwinds from a stronger dollar, a dynamic that warrants close observation.
The DXY's daily chart shows a strong bullish trend with an ADX of 31.64, indicating solidifying upward momentum. On the 1-hour timeframe, it's trading above the middle Bollinger band, with RSI at 61.71, suggesting continued upward pressure. However, Stochastic is showing a dip (K=59.46, D=70.08), hinting at potential short-term consolidation. This robust dollar performance contrasts sharply with the mixed signals in other forex pairs. EURUSD is struggling below 1.15388, USDJPY is pushing towards 160, and GBPUSD is also showing weakness. This broad dollar strength is a significant factor to consider when assessing Brent's price action.
Geopolitical Tensions Fueling the Fire
The energy market is acutely sensitive to geopolitical developments, and the current landscape is fraught with tension. Recent news highlights the escalating risks in the Middle East, including concerns over the Strait of Hormuz blockade and its impact on oil exports. Reports suggest Iraq's economy could plummet by 70% if this blockade continues, underscoring the severity of the situation. Furthermore, fears surrounding the vulnerability of the US power grid add another layer of complexity to the energy security outlook. These factors are not merely headlines; they translate directly into a heightened risk premium being priced into oil contracts. The possibility of supply disruptions, even if not fully realized, forces traders and consumers to price in a higher cost of energy, creating a bullish undercurrent for benchmarks like Brent.
This heightened geopolitical risk is a primary driver supporting Brent's current price of $104.78, even as the DXY strengthens. The market is clearly pricing in a scenario where supply could be impacted, irrespective of current demand levels. Some extreme scenarios, as modeled by the US government, even suggest oil prices could skyrocket to $200 per barrel if tensions escalate further. While such a figure represents an outlier, it illustrates the significant upside potential that geopolitical instability injects into the oil market. This sentiment is reflected in Brent's daily chart, which shows a very strong bullish trend (ADX: 62.36) despite mixed signals on shorter timeframes.
The Bull's Roadmap: Chasing Higher Ground
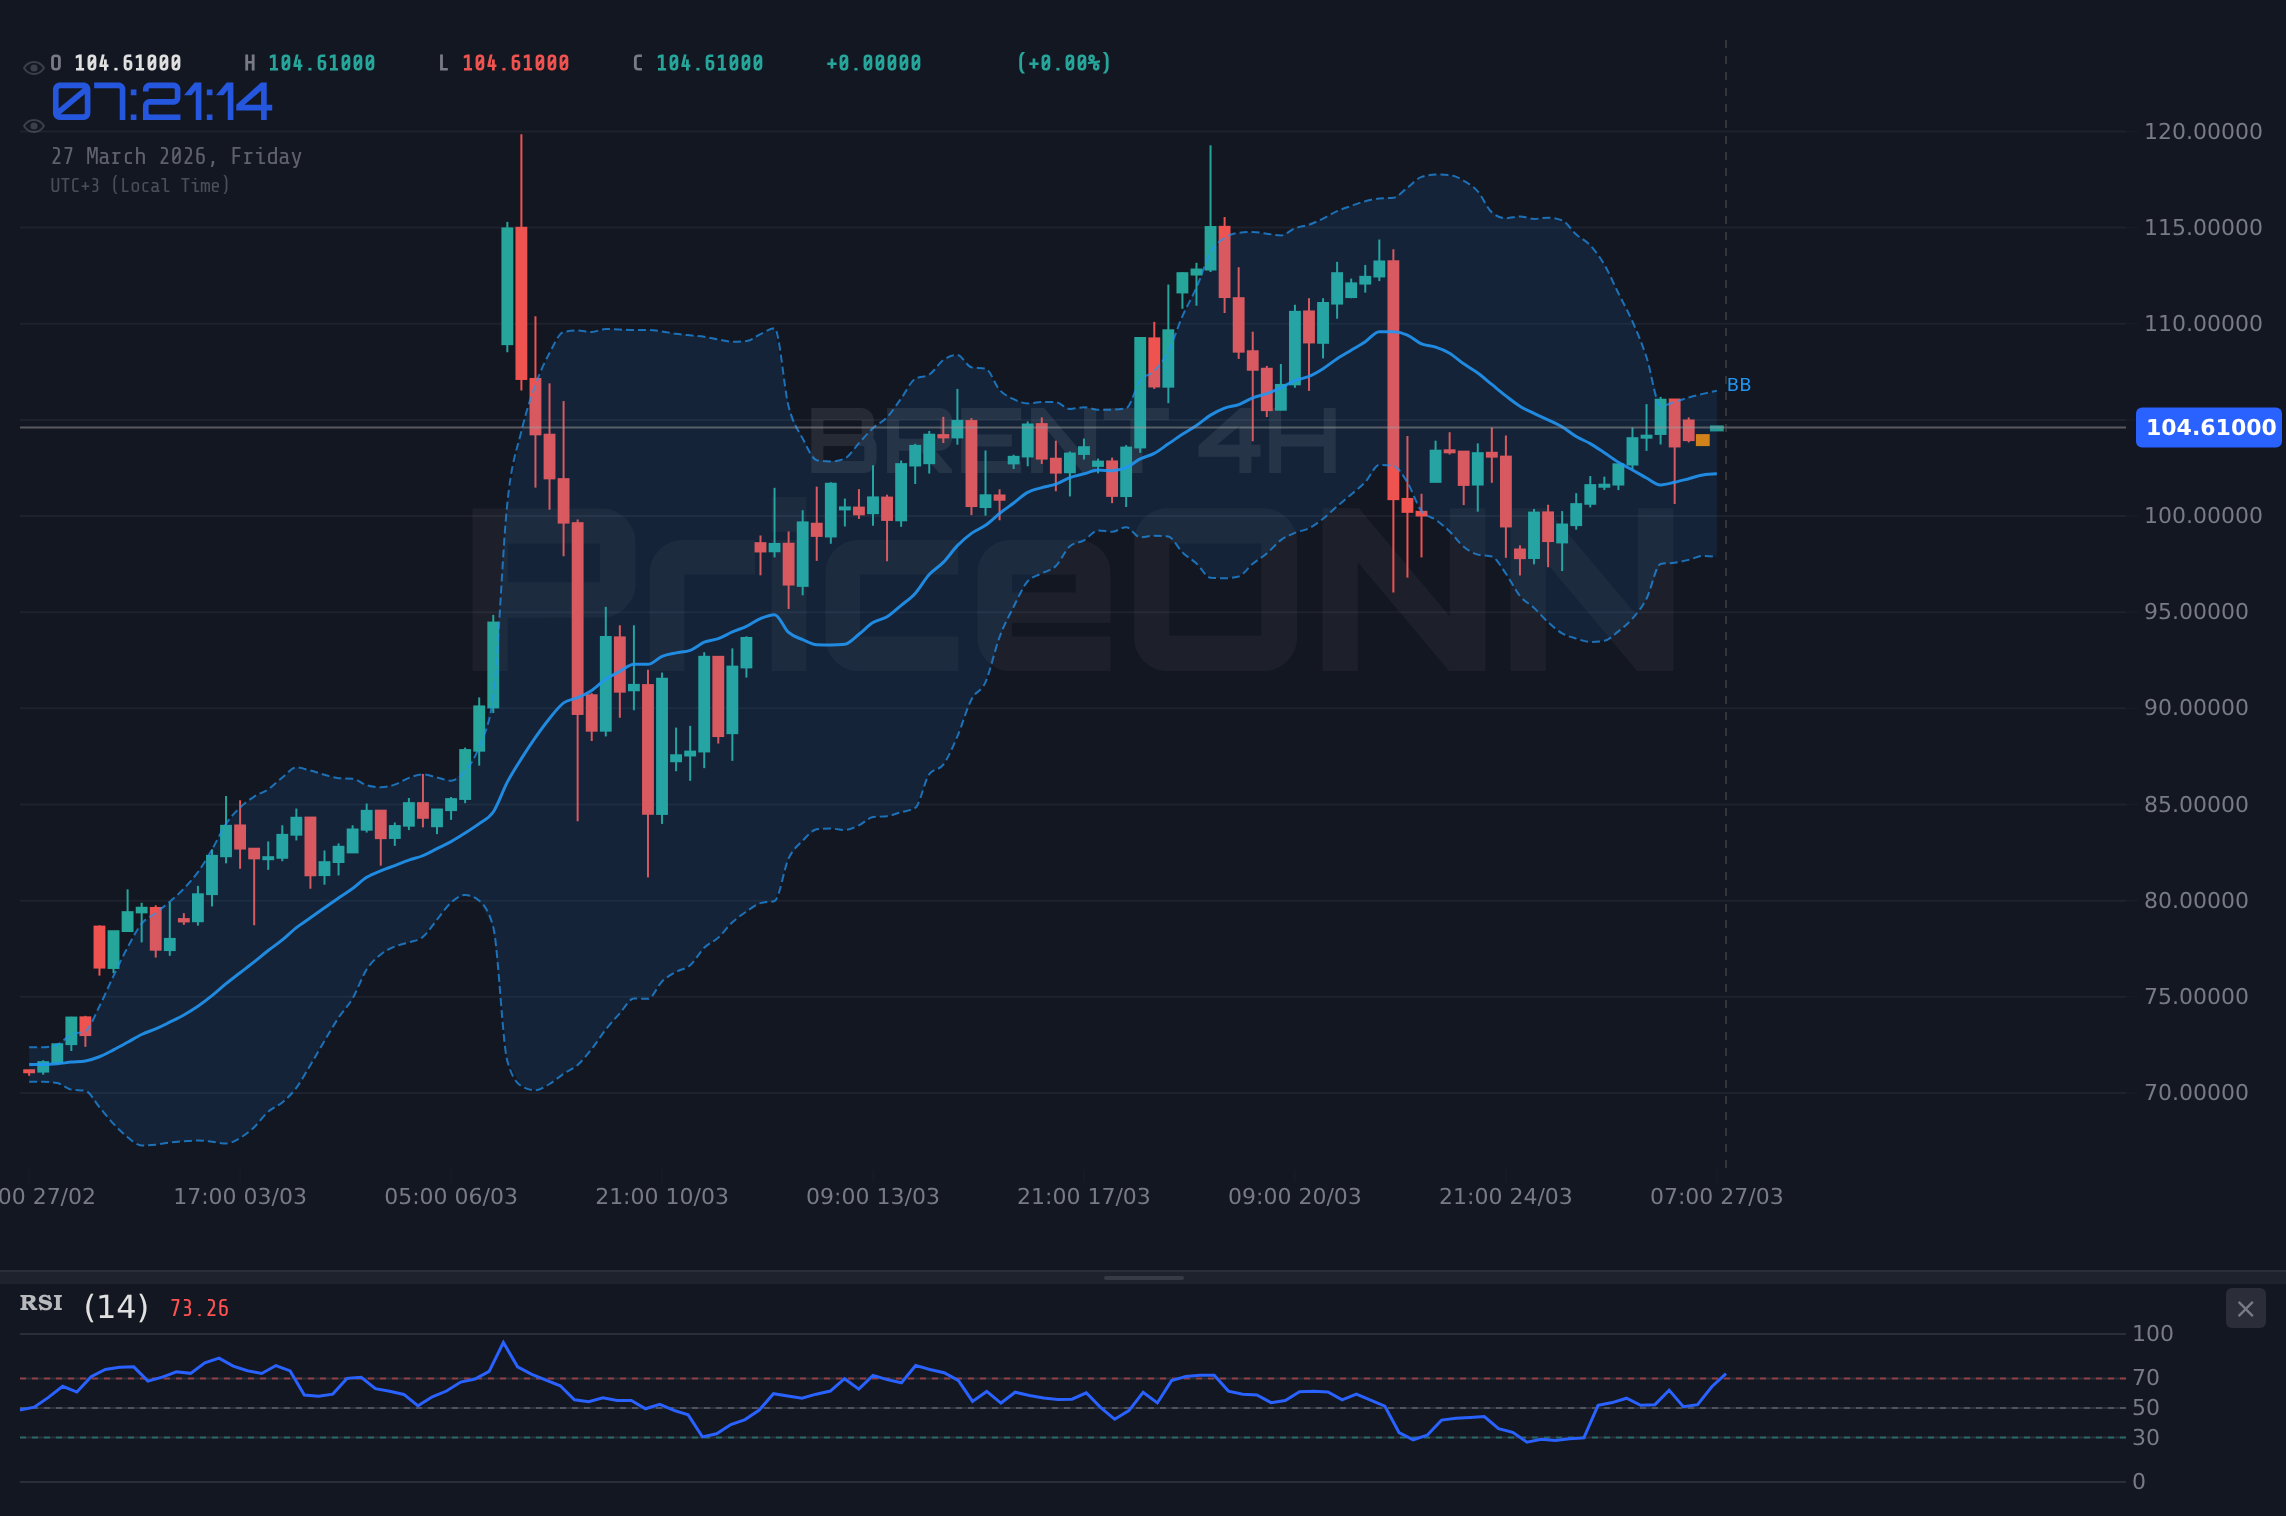
For the bulls to maintain control, Brent needs to decisively break through the immediate resistance at $106.34. A sustained push above this level, ideally with increasing volume and positive momentum across multiple timeframes, would signal a continuation of the upward trend. The 4-hour chart, while showing a neutral trend strength of 50%, has resistance levels clearly marked at $106.26, $108.91, and $111.72. A daily close above $106.34 would be a significant bullish confirmation, potentially opening the door for a move towards the $109.05 target. This scenario hinges on the continued escalation of geopolitical tensions or a significant disruption to oil supply, coupled with a potential softening in the US Dollar.
On the technical front, the daily chart presents a strong bullish picture with an ADX of 62.36. The RSI at 65.07 is in the upper neutral territory, suggesting room for further upside before becoming overbought. The Stochastic indicator, despite showing a dip (K=31.43, D=45.08) on the daily, is showing a %K > %D crossover on the 1-hour chart (K=65.83, D=64.26), which could provide an intraday boost. However, the MACD on the daily chart is currently showing negative momentum, operating below its signal line, which is a conflicting signal that needs resolution. A bullish scenario would require this MACD to turn positive and cross above its signal line, reinforcing the upward move.
Where Bears Take Control: A Return to Lower Levels
Conversely, a bearish scenario would emerge if Brent fails to overcome the $106.34 resistance and begins to retreat. The current price of $104.78 would then be tested, followed by support levels at $102.12 and $101.52 on the 1-hour chart. A more significant breakdown could target the 4-hour support at $100.80 and potentially lower. The daily support levels at $100.77, $97.91, and $95.20 would become the focus in a more pronounced sell-off. Such a move could be triggered by a de-escalation of geopolitical tensions, a surprisingly strong dollar rally that overrides risk premiums, or indications of easing supply concerns.
Technically, a bearish reversal would likely be confirmed by a failure to hold the $104.78 mark, followed by a break below the $102.12 support. The 1-hour chart's ADX of 27.68, while indicating a strong downtrend, is currently aligned with bullish signals on shorter timeframes. A sustained move below the middle Bollinger band on the daily chart, currently trading above it, would also signal a bearish shift. The daily RSI, currently at 65.07, would need to fall back below 50 to confirm weakening bullish momentum. The conflicting MACD signal on the daily chart (negative momentum) could also play into the hands of bears if it deepens.
The Waiting Game: Consolidation Around Current Levels
It's entirely plausible that Brent crude will remain range-bound in the near term, consolidating around the current price of $104.78. This scenario often occurs when conflicting forces – like geopolitical risk supporting prices and dollar strength pressuring them – create a stalemate. In such a range-bound environment, prices might oscillate between the immediate support at $103.14 and the resistance at $104.76 on the 1-hour chart. The ADX across all timeframes (1H: 27.68, 4H: 16.18, 1D: 62.36) presents a mixed picture. The strong daily ADX suggests an underlying trend exists, but the lower timeframes indicate a lack of commitment, pointing towards potential consolidation before a decisive move.
A period of consolidation would likely see choppy price action, with volatility potentially decreasing on shorter timeframes as traders await clearer signals. The lack of strong directional momentum on the 1-hour and 4-hour charts, despite the strong daily trend, supports this view. Stochastic indicators on the 1-hour and 4-hour charts are in or approaching overbought territory (1H: K=65.83, D=64.26; 4H: K=83.11, D=81.19), suggesting that further immediate upside might be limited without a significant catalyst. This could lead to price action oscillating within a defined range, perhaps between $103 and $107, until a more definitive fundamental or technical trigger emerges.
The Most Likely Scenario: Geopolitics Reigns Supreme
Given the current market environment, the most probable scenario leans towards a bullish bias, driven primarily by escalating geopolitical tensions. While the strengthening US Dollar at 99.64 presents a headwind, the sheer magnitude of the potential supply disruptions stemming from the Middle East appears to be the dominant factor. The market is actively pricing in risk, and until these geopolitical anxieties subside, oil prices are likely to remain elevated or even trend higher. I would assign a 65% probability to a bullish outcome, a 25% probability to consolidation, and a 10% probability to a bearish reversal in the short to medium term.
This bullish outlook is predicated on the assumption that geopolitical risks will persist or intensify. Any news of further supply disruptions, escalation of conflicts, or significant threats to energy infrastructure would likely trigger a sharp upward move in Brent prices. Conversely, a sudden de-escalation or a clear diplomatic resolution would quickly shift the sentiment, potentially leading to a sharp correction as the risk premium unwinds. The current technical setup on the daily chart, particularly the very strong ADX of 62.36, supports the idea of a prevailing trend that requires significant counter-evidence to reverse.
Bullish Scenario: Geopolitical Premium Drives Prices Higher
65% ProbabilityNeutral Scenario: Waiting for Clarity Amid Conflicting Forces
25% ProbabilityBearish Scenario: Dollar Strength and De-escalation Dominate
10% ProbabilityWhat I'm Watching This Week
My focus remains squarely on the geopolitical headlines emanating from the Middle East. Any concrete news regarding supply disruptions or de-escalation efforts will be the primary catalyst. Secondly, I'll be monitoring the US Dollar Index (DXY) closely. A sustained move above the 100.00 psychological level would add weight to the bearish case, while a retreat below 99.00 could signal a shift in risk sentiment favoring commodities. Lastly, I'll be watching the price action around the $106.34 resistance level. A decisive, high-volume break above this point would be a strong signal for the bullish scenario to play out.
Frequently Asked Questions: BRENT Analysis
What happens if BRENT breaks decisively above the $106.34 resistance level?
A sustained break above $106.34, especially on the daily chart, would signal a continuation of the bullish trend driven by geopolitical risks. The next targets would likely be $109.05, followed by $111.72, as the market prices in further supply concerns.
Should I buy BRENT at current levels around $104.78 given the strong dollar?
Buying at current levels carries risk due to the strong DXY at 99.64. However, if geopolitical tensions remain the dominant driver, a cautious entry could be considered on a retest of $103.14 support, with a tight stop below $102.12. A more conservative approach would be to wait for a confirmed break above $106.34.
Is the ADX at 62.36 on the daily chart a strong buy signal for BRENT?
An ADX of 62.36 indicates a very strong trend, but it doesn't specify direction. In this context, it confirms the prevailing bullish trend driven by fundamentals. However, caution is advised as such high ADX readings can sometimes precede trend exhaustion; confirmation from RSI and MACD turning positive is crucial.
How will escalating Middle East tensions affect BRENT prices this week?
Escalating tensions significantly increase the probability of supply disruptions, which historically drives oil prices higher. If the situation worsens, Brent could rapidly move towards the $109.05 and $111.72 targets as traders price in a substantial geopolitical risk premium.
The path forward for Brent crude hinges heavily on the geopolitical chessboard. While the strengthening dollar presents a formidable counter-force, the market's current pricing suggests that supply-side risks are taking precedence. Traders must remain vigilant, closely monitoring headlines and technical levels. Patience and disciplined risk management are key; waiting for clear confirmation of either a sustained breakout above resistance or a decisive failure at current levels will be crucial for navigating this volatile landscape. Volatility creates opportunity - those prepared will be rewarded.
| Indicator | Value | Signal | Interpretation |
|---|---|---|---|
| RSI (14) | 65.07 | Bullish | Daily RSI at 65.07 suggests upward momentum is still present, but approaching overbought territory. |
| MACD Histogram | -1.16 | Bearish | Daily MACD histogram is negative, indicating bearish momentum, though a crossover could occur. |
| Stochastic | 31.43 / 45.08 | Bearish | Daily Stochastic shows %K below %D, suggesting a bearish signal despite recent price action. |
| ADX | 62.36 | Bullish | Daily ADX at 62.36 signifies an extremely strong trend, confirming prevailing bullish sentiment. |
| Bollinger | 104.78 | Bullish | Price is trading above the middle band, indicating bullish pressure on the daily chart. |
Track markets in real-time
AI-powered analysis, technical indicators and real-time price data.
Join Our Telegram Channel
Breaking market news, AI analysis and trading signals instantly.
Join Channel