WTI Crude Oil Tests $93.31 Resistance; Is a Bullish Breakout Imminent?
WTI crude oil hovers near $93.22 resistance. With ADX showing a weak trend and conflicting signals from RSI and MACD, traders watch for a decisive move above $93.31.
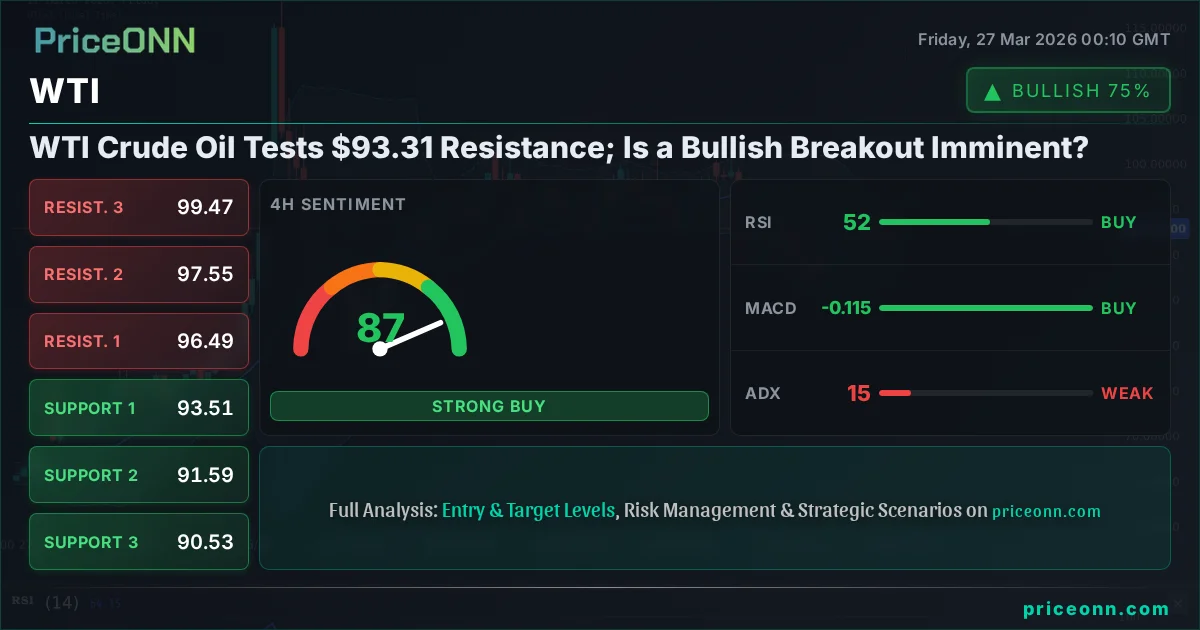
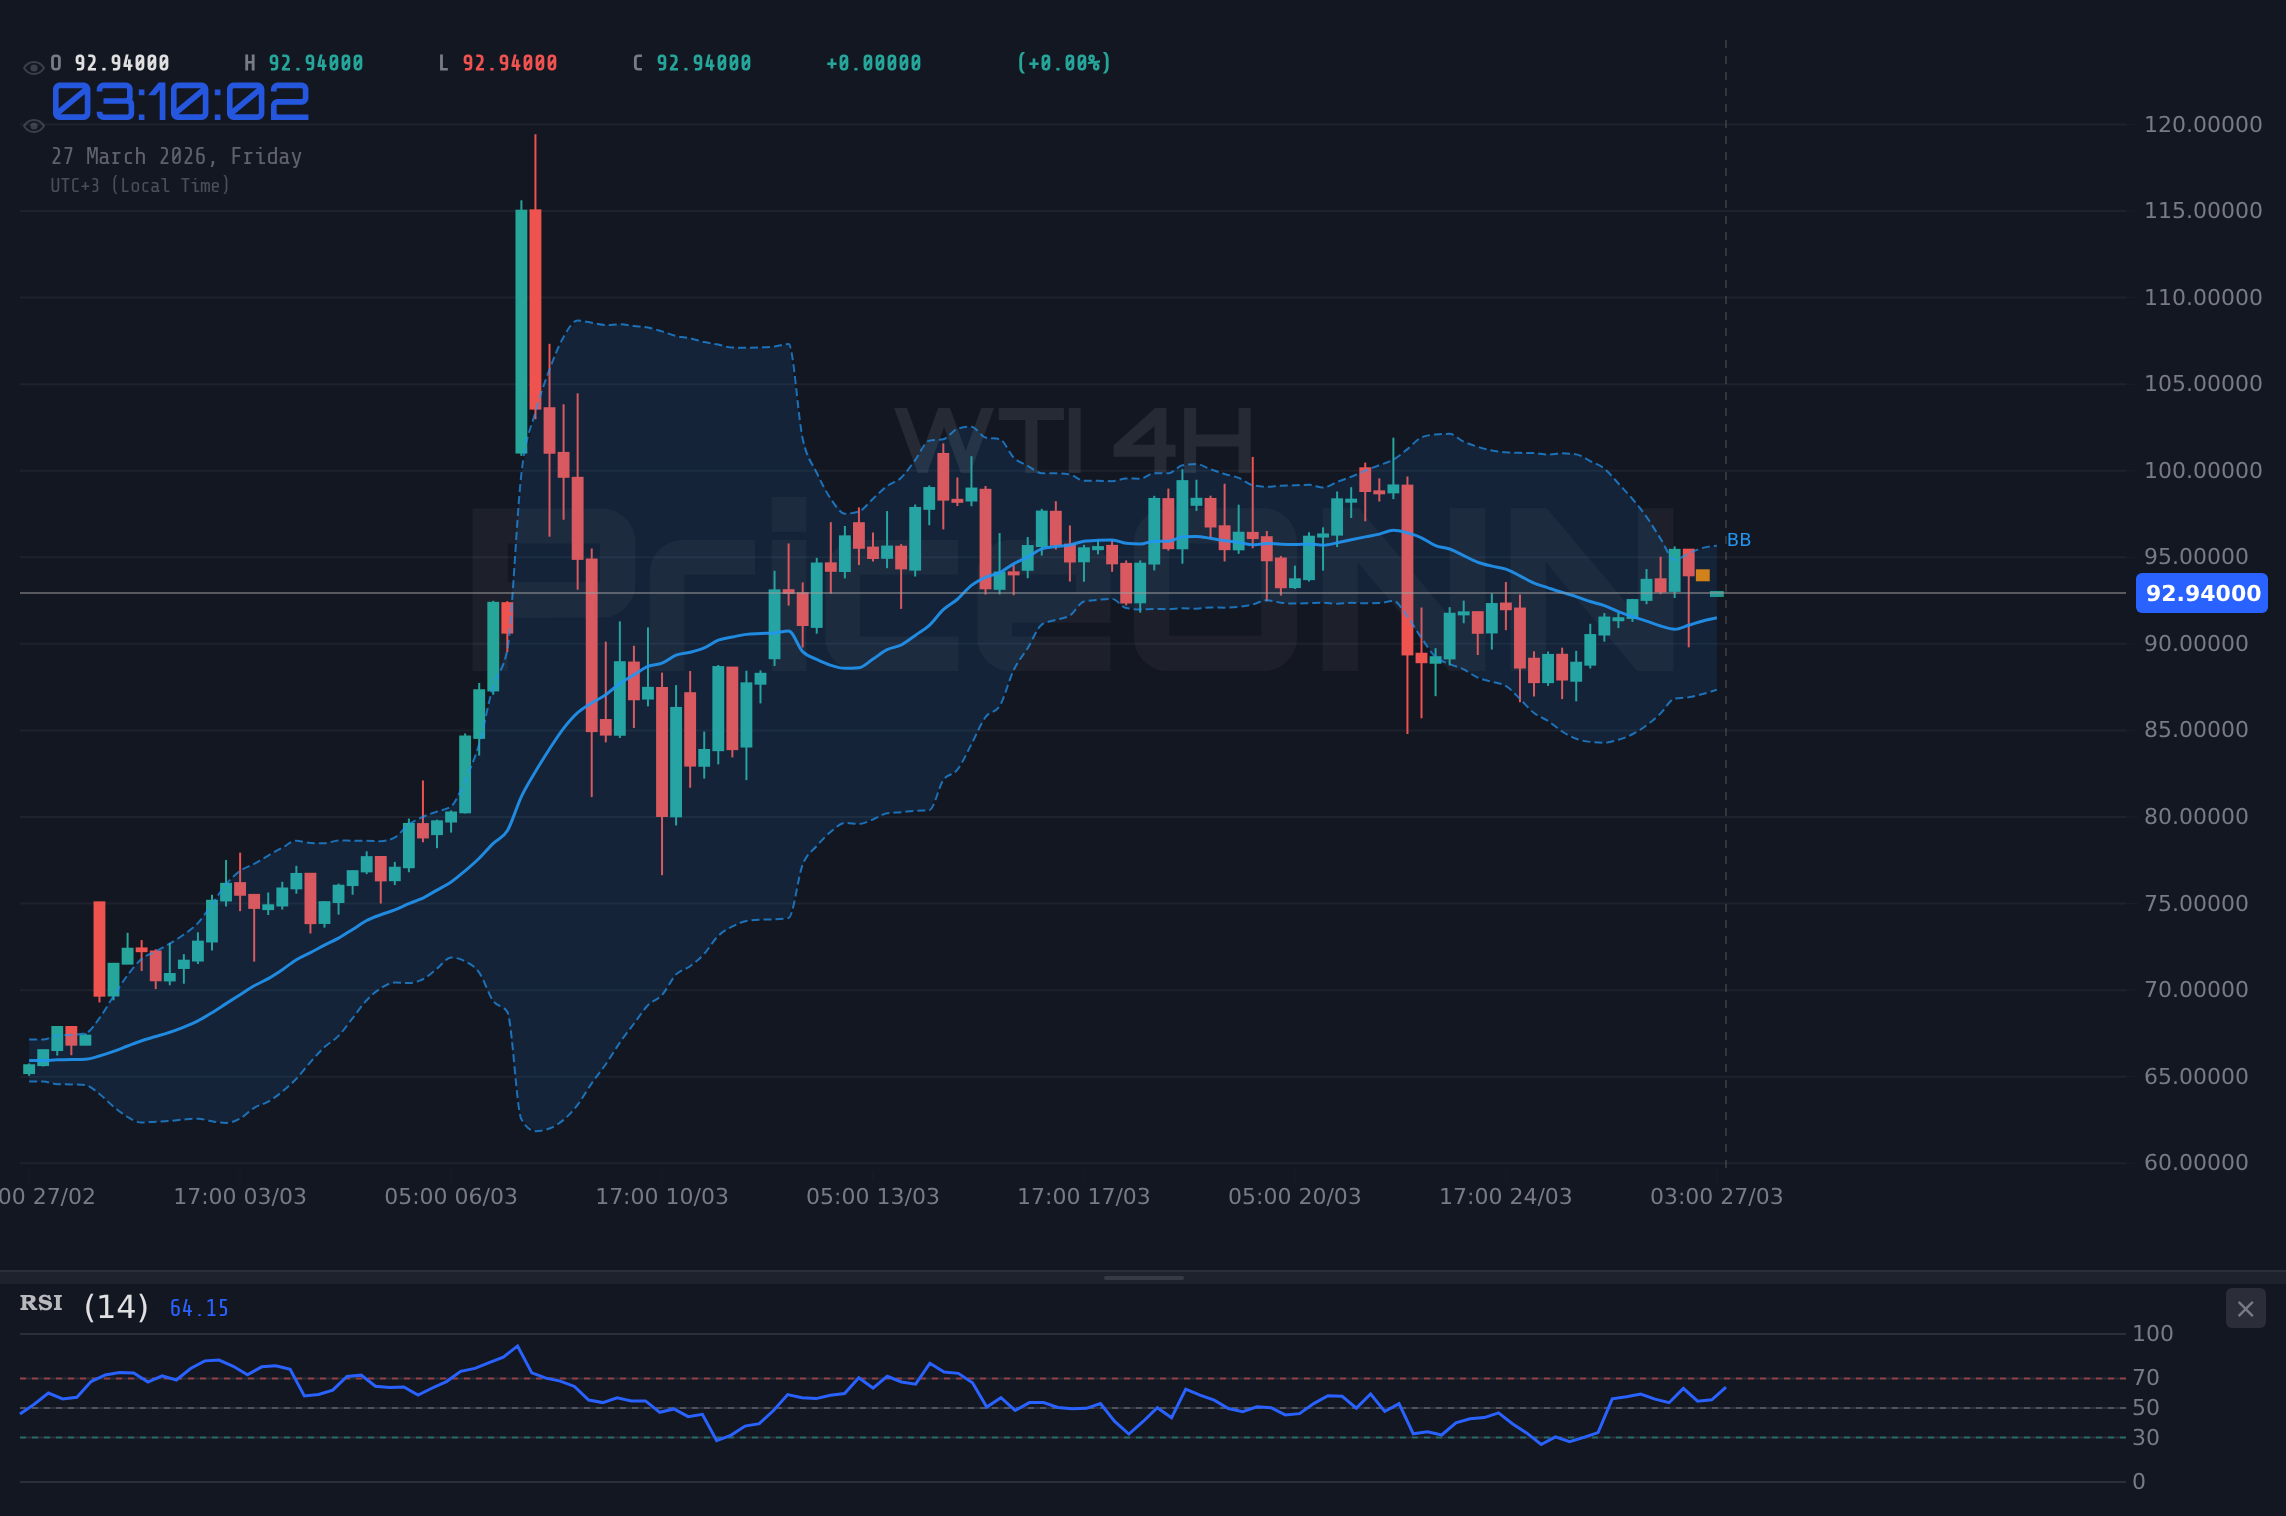
The energy markets are at a fascinating crossroads this week, and West Texas Intermediate (WTI) crude oil is right in the thick of it, currently trading around the $93.22 mark. While the daily chart screams 'downtrend' with an ADX of 57.12 and a clear move below the mid-Bollinger band, the 4-hour timeframe presents a more nuanced picture. We're seeing a strong bullish trend signal with ADX at 16.95, and crucially, WTI is knocking on the door of a significant resistance level at $93.31. This divergence in signals across timeframes is exactly where opportunities arise for the disciplined trader, but it also demands extreme caution. The question on everyone's mind is whether this current price action is a precursor to a genuine bullish breakout or just another false signal in a volatile market.
- WTI crude oil is currently trading at $93.22, approaching the critical resistance level of $93.31.
- Technical indicators show conflicting signals across different timeframes; the 1-day trend is strongly bullish (ADX 57.12), while the 4-hour shows a weaker trend (ADX 16.95) but positive MACD momentum.
- The Dollar Index (DXY) is rallying towards 100, which typically exerts downward pressure on oil prices.
- Geopolitical tensions in the Black Sea and the Middle East, alongside supply concerns, are providing underlying support for oil prices.
Navigating the Conflicting Signals: A Trader's Perspective
From a pure price action perspective, the $93.22 level for WTI is pivotal. It’s not just a random number; it represents a confluence of factors. Looking at the 1-hour chart, the trend strength is neutral (50%), with an ADX of 25.72 indicating a somewhat weak trend. However, the MACD histogram is negative, suggesting bearish momentum, while the Stochastic Oscillator is giving a bearish signal (%K < %D) in the overbought territory (K=63.95, D=71.53). This paints a picture of caution on the shortest timeframe. Yet, the daily chart paints a different story. The ADX is a staggering 57.12, confirming a very strong bullish trend. The RSI is at 60.88, well within the bullish zone, and the MACD, despite its histogram reading on the 1-hour, is showing positive momentum on the daily chart. This contrast is what makes markets exciting, and for traders, it means we need to be selective and patient. A sustained move above $93.31 on significant volume could signal the start of a much larger rally, but until then, we are in a 'watch and wait' scenario.
The current technical setup on WTI is a classic example of market indecision across different timeframes. On the daily chart, the trend is overwhelmingly bullish, with an ADX reading of 57.12 signaling a robust trend. This is supported by an RSI of 60.88, indicating healthy momentum, and the price trading above the middle Bollinger Band. However, zoom into the shorter timeframes, and the picture becomes murkier. The 1-hour chart shows a neutral trend (ADX 25.72) with bearish MACD momentum and a Stochastic oscillator suggesting a potential pullback. This conflict means that while the long-term picture is positive, the short-term could see choppy price action or even a retracement. For traders looking to enter, the key is to wait for confirmation. A daily close above the $93.31 resistance level would be the first major sign that the bulls are regaining control and pushing the price higher. Until then, we must respect the potential for a pullback towards the support levels identified on the daily chart, which are around $88.21 and $84.89.
The interplay between different timeframes is crucial for understanding the current WTI market. The daily chart, with its strong bullish trend (ADX 57.12) and RSI at 60.88, suggests that the underlying momentum is upward. This is further supported by the price trading above the middle Bollinger Band. However, the 1-hour chart presents a different narrative, showing a neutral trend (ADX 25.72) and bearish MACD momentum. This conflict highlights the importance of not relying on a single timeframe. For traders, this suggests that while the long-term outlook is constructive, short-term volatility and potential pullbacks are very much on the table. The key level to watch remains $93.31. A decisive break above this resistance, confirmed by strong volume and bullish indicators on shorter timeframes, could ignite a significant rally. Conversely, failure to break through could lead to a retest of support levels around $88.21.
The ADX indicator is flashing strong trend signals on the daily chart (57.12), suggesting that whatever direction the market eventually takes, it's likely to be a strong one. The current indecision across shorter timeframes is likely a temporary pause before the next major move.
The Dollar's Shadow and Geopolitical Undercurrents
It's impossible to discuss oil prices without acknowledging the significant influence of the US Dollar Index (DXY). Currently trading around 99.66 and showing a strong upward trend (ADX 27.22 on 1H, 46.37 on 1D), a stronger dollar typically puts downward pressure on dollar-denominated commodities like WTI. This is because oil becomes more expensive for holders of other currencies, potentially dampening demand. The fact that WTI is showing resilience and even approaching resistance levels despite the dollar's strength is a testament to the underlying bullish forces at play, likely driven by supply-side concerns and geopolitical risk premiums. The correlation is clear: as DXY eyes the 100 level, traders are watching closely to see if oil can maintain its upward trajectory or if the dollar's strength will eventually win out.
The recent surge in the Dollar Index (DXY) to 99.66, nearing the psychological 100 mark, adds a layer of complexity to the WTI outlook. Historically, a stronger dollar tends to suppress oil prices, as it makes crude more expensive for international buyers. However, WTI's current push towards $93.31 resistance, despite the dollar's upward momentum, suggests that other factors are currently outweighing the currency effect. These factors likely include persistent supply concerns and geopolitical risks that are injecting a risk premium into the oil market. The recent news of a Russian oil tanker being struck near Istanbul, raising fears about Black Sea supply routes, and ongoing tensions in the Middle East, are significant drivers. This geopolitical backdrop is creating a floor under oil prices, even as the dollar strengthens.
The broader macroeconomic landscape also plays a critical role. While specific economic calendar data for today (March 27th) shows mixed results - a stronger-than-expected USD Manufacturing PMI at 52.4 but a weaker Services PMI at 51.1 - the overarching narrative is one of cautious economic activity. The fact that WTI is showing upward momentum towards resistance despite these mixed signals suggests that the market is more focused on supply-side tightness and geopolitical risks than on immediate demand fluctuations. The recent rally in oil prices, pushing WTI towards $93.31, indicates that traders are pricing in potential supply disruptions. The strong bullish trend on the daily chart (ADX 57.12) reinforces this sentiment, suggesting that the market is anticipating further upward pressure on oil prices, irrespective of minor fluctuations in economic indicators.
The strong upward trend on the daily WTI chart (ADX 57.12) is undeniable, but the conflicting signals on shorter timeframes and the rising DXY create a high-risk environment. A failure to break $93.31 could lead to a sharp correction.
Supply Dynamics: The Tightrope Walk
The fundamental driver underpinning WTI's current position near resistance is the delicate balance of global oil supply. OPEC+ production cuts, particularly Saudi Arabia's voluntary cuts aimed at stabilizing the market, continue to exert upward pressure. These cuts, coupled with geopolitical tensions that threaten supply routes, are creating a persistent tightness in the market. For instance, the news of a Russian oil tanker being struck near Istanbul highlights the vulnerability of key shipping lanes, particularly in the Black Sea. This adds a significant risk premium to oil prices, as any disruption could lead to substantial supply shortages. While US shale production has shown resilience, its growth rate is not sufficient to fully offset the deliberate cuts by major producers and the potential impact of geopolitical instability.
The ongoing supply concerns are the bedrock of the bullish sentiment seen in WTI's daily chart. Saudi Arabia's commitment to voluntary production cuts, aiming to remove around 1 million barrels per day from the market, is a crucial factor. This deliberate reduction in supply, when combined with potential disruptions from geopolitical events, creates a tight market environment. The recent incident involving a Russian oil tanker in the Black Sea serves as a stark reminder of how fragile these supply chains can be. Any escalation of conflict or further disruption in key regions like the Middle East or the Black Sea could rapidly tighten global supplies, providing a strong tailwind for WTI prices. While US production has been a counterbalancing force, its ability to absorb these supply shocks is being tested.
Inventory data, although not explicitly provided in the real-time feed, is always a critical component in this supply-demand equation. Traders are constantly monitoring weekly crude oil inventories in the US, released by the EIA. Lower-than-expected inventory builds or unexpected draws typically signal strong demand or tight supply, both of which are bullish for prices. Conversely, significant inventory builds can signal weakening demand or oversupply, putting downward pressure on WTI. Given the current bullish trend on the daily chart, it's likely that recent inventory reports have shown figures supportive of higher prices, either through draws or lower-than-anticipated build-ups, further reinforcing the market's bullish bias despite short-term technical conflicts.
The current geopolitical climate, particularly the ongoing conflicts and tensions in key oil-producing regions, is adding a significant risk premium to WTI prices. This premium is acting as a buffer against potential price declines, even as the DXY strengthens.
The Path Forward: Levels to Watch
For traders focused on WTI, the immediate future hinges on the price action around the $93.31 resistance level. A decisive break and sustained hold above this level on the daily chart would likely trigger a cascade of buy orders, potentially targeting the next significant resistance points. Based on the provided data, the daily resistance levels are $93.31, $95.09, and $98.41. A breakout above $93.31 could see a rapid move towards $95.09, and if momentum persists, the $98.41 level would become the next major target. This scenario is supported by the strong bullish trend indicated by the daily ADX. However, the market is currently exhibiting significant indecision across shorter timeframes, and the rising DXY adds a counter-risk.
If WTI fails to break above $93.31, the focus will inevitably shift to the downside. The daily support levels provide critical zones where buying interest might emerge. These are currently identified at $88.21, $84.89, and $83.11. A break below the immediate daily support at $88.21 would invalidate the bullish short-to-medium term outlook and could signal a deeper correction. This bearish scenario becomes more probable if the DXY continues its ascent towards 100 and if geopolitical risks subside, reducing the risk premium in oil prices. Traders will be closely watching the 4-hour chart for signs of a breakdown below its support levels, which are currently around $91.59 and $90.53. A decisive close below these levels could accelerate a move towards the daily support zones.
Considering the 'WATCH_ZONE' trade recommendation, the most prudent approach is to wait for confirmation rather than trying to front-run the market. A valid setup for a bullish trade would require a clear daily close above $93.31, ideally accompanied by bullish signals on the 1-hour or 4-hour charts, such as RSI moving out of the neutral zone and MACD crossing bullishly. Until then, the market remains in consolidation or potential reversal territory. For bearish traders, a close below the 4-hour support of $91.59, confirmed by bearish momentum across timeframes, would present a setup for a short trade targeting the daily support levels.
Frequently Asked Questions: WTI Analysis
What happens if WTI breaks decisively above the $93.31 resistance level?
A sustained break above $93.31, confirmed by strong volume and bullish indicators on shorter timeframes, could open the door for a rally towards the next daily resistance level at $95.09. This scenario is supported by the strong daily bullish trend (ADX 57.12) but would need to overcome the current short-term indecision.
Should I consider buying WTI at current levels around $93.22 given the conflicting signals?
Entering a long position at $93.22 is risky due to conflicting signals across timeframes and the rising DXY. A more prudent approach, as indicated by the 'WATCH_ZONE' recommendation, is to wait for a clear confirmation, such as a daily close above $93.31 or a confirmed pullback to daily support levels around $88.21 with defined risk management.
Is the RSI at 60.88 on the daily chart a strong buy signal for WTI?
An RSI of 60.88 on the daily chart is indeed in bullish territory, indicating positive momentum. However, it's not an extreme overbought signal yet. While supportive of the bullish trend, it needs to be considered alongside other indicators and price action. A break above $93.31 would add further conviction to this bullish RSI reading.
How will the rising DXY towards 100 affect WTI's price action this week?
A rising DXY typically puts downward pressure on dollar-denominated commodities like WTI, making them more expensive for foreign buyers. If the DXY continues its ascent towards 100, it could create headwinds for WTI, potentially leading to a pullback from current levels or capping upside potential, especially if oil prices fail to break key resistance.
Bearish Scenario: The Resistance Holds
40% ProbabilityBullish Scenario: Breakout Confirmation
50% ProbabilityNeutral Scenario: Choppy Consolidation
10% ProbabilityThe energy markets are constantly evolving, influenced by a complex web of supply, demand, geopolitical events, and macroeconomic forces. WTI crude oil, currently poised at a critical juncture around $93.22, exemplifies this complexity. While the long-term daily trend remains bullish, the short-term technicals and the rising DXY present significant headwinds. Patience and disciplined risk management are paramount. The market is currently signaling a 'WATCH_ZONE' scenario, urging traders to wait for a clear confirmation before committing to a position. Whether it's a breakout above $93.31 or a retracement to key support levels, the setup will eventually become clearer. Remember, in volatile markets, waiting for the right opportunity is often the most profitable strategy.
| Indicator | Value | Signal | Interpretation |
|---|---|---|---|
| RSI (14) | 60.88 | Bullish | Positive momentum on daily chart |
| MACD Histogram | -0.04 (1H) | Bearish | Short-term bearish momentum |
| Stochastic | K=36.98, D=47.12 (1D) | Bearish | Daily signals a potential dip |
| ADX | 57.12 (1D) | Strong Trend | Very strong trend on daily chart |
| Bollinger Bands | Upper Band | Watch | Price near upper band on 4H |
Track markets in real-time
AI-powered analysis, technical indicators and real-time price data.
Join Our Telegram Channel
Breaking market news, AI analysis and trading signals instantly.
Join Channel