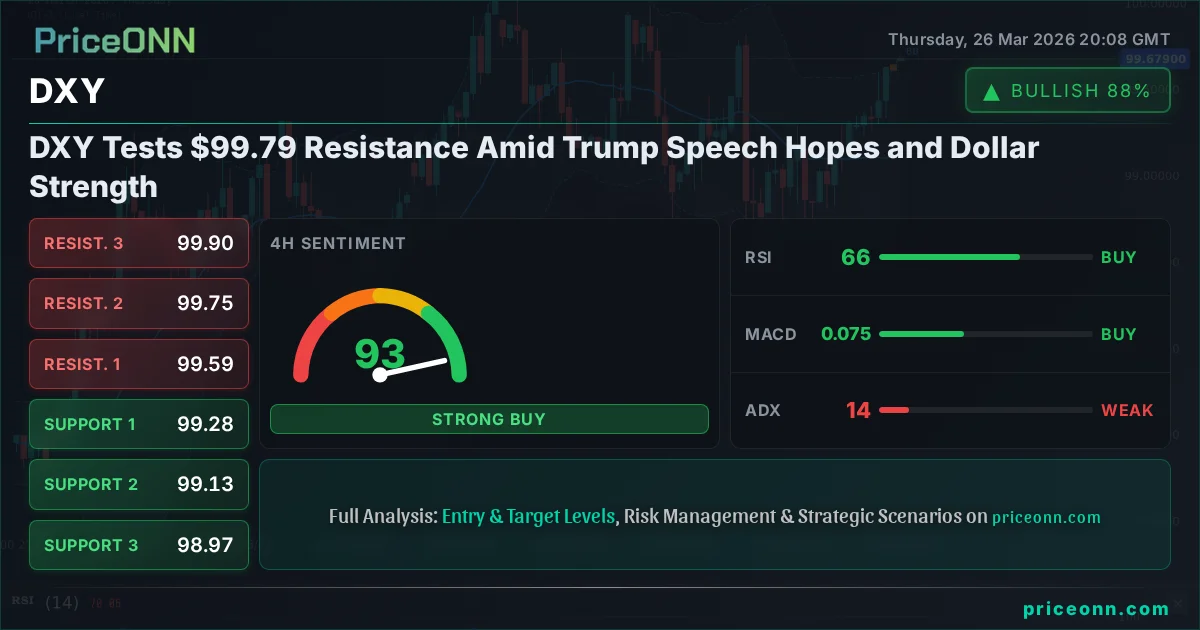
DXY Tests $99.79 Resistance Amid Trump Speech Hopes and Dollar Strength
The US Dollar Index (DXY) hovers near $99.79, testing key resistance as markets anticipate a Trump speech. Dollar strength is evident across forex and commodities.
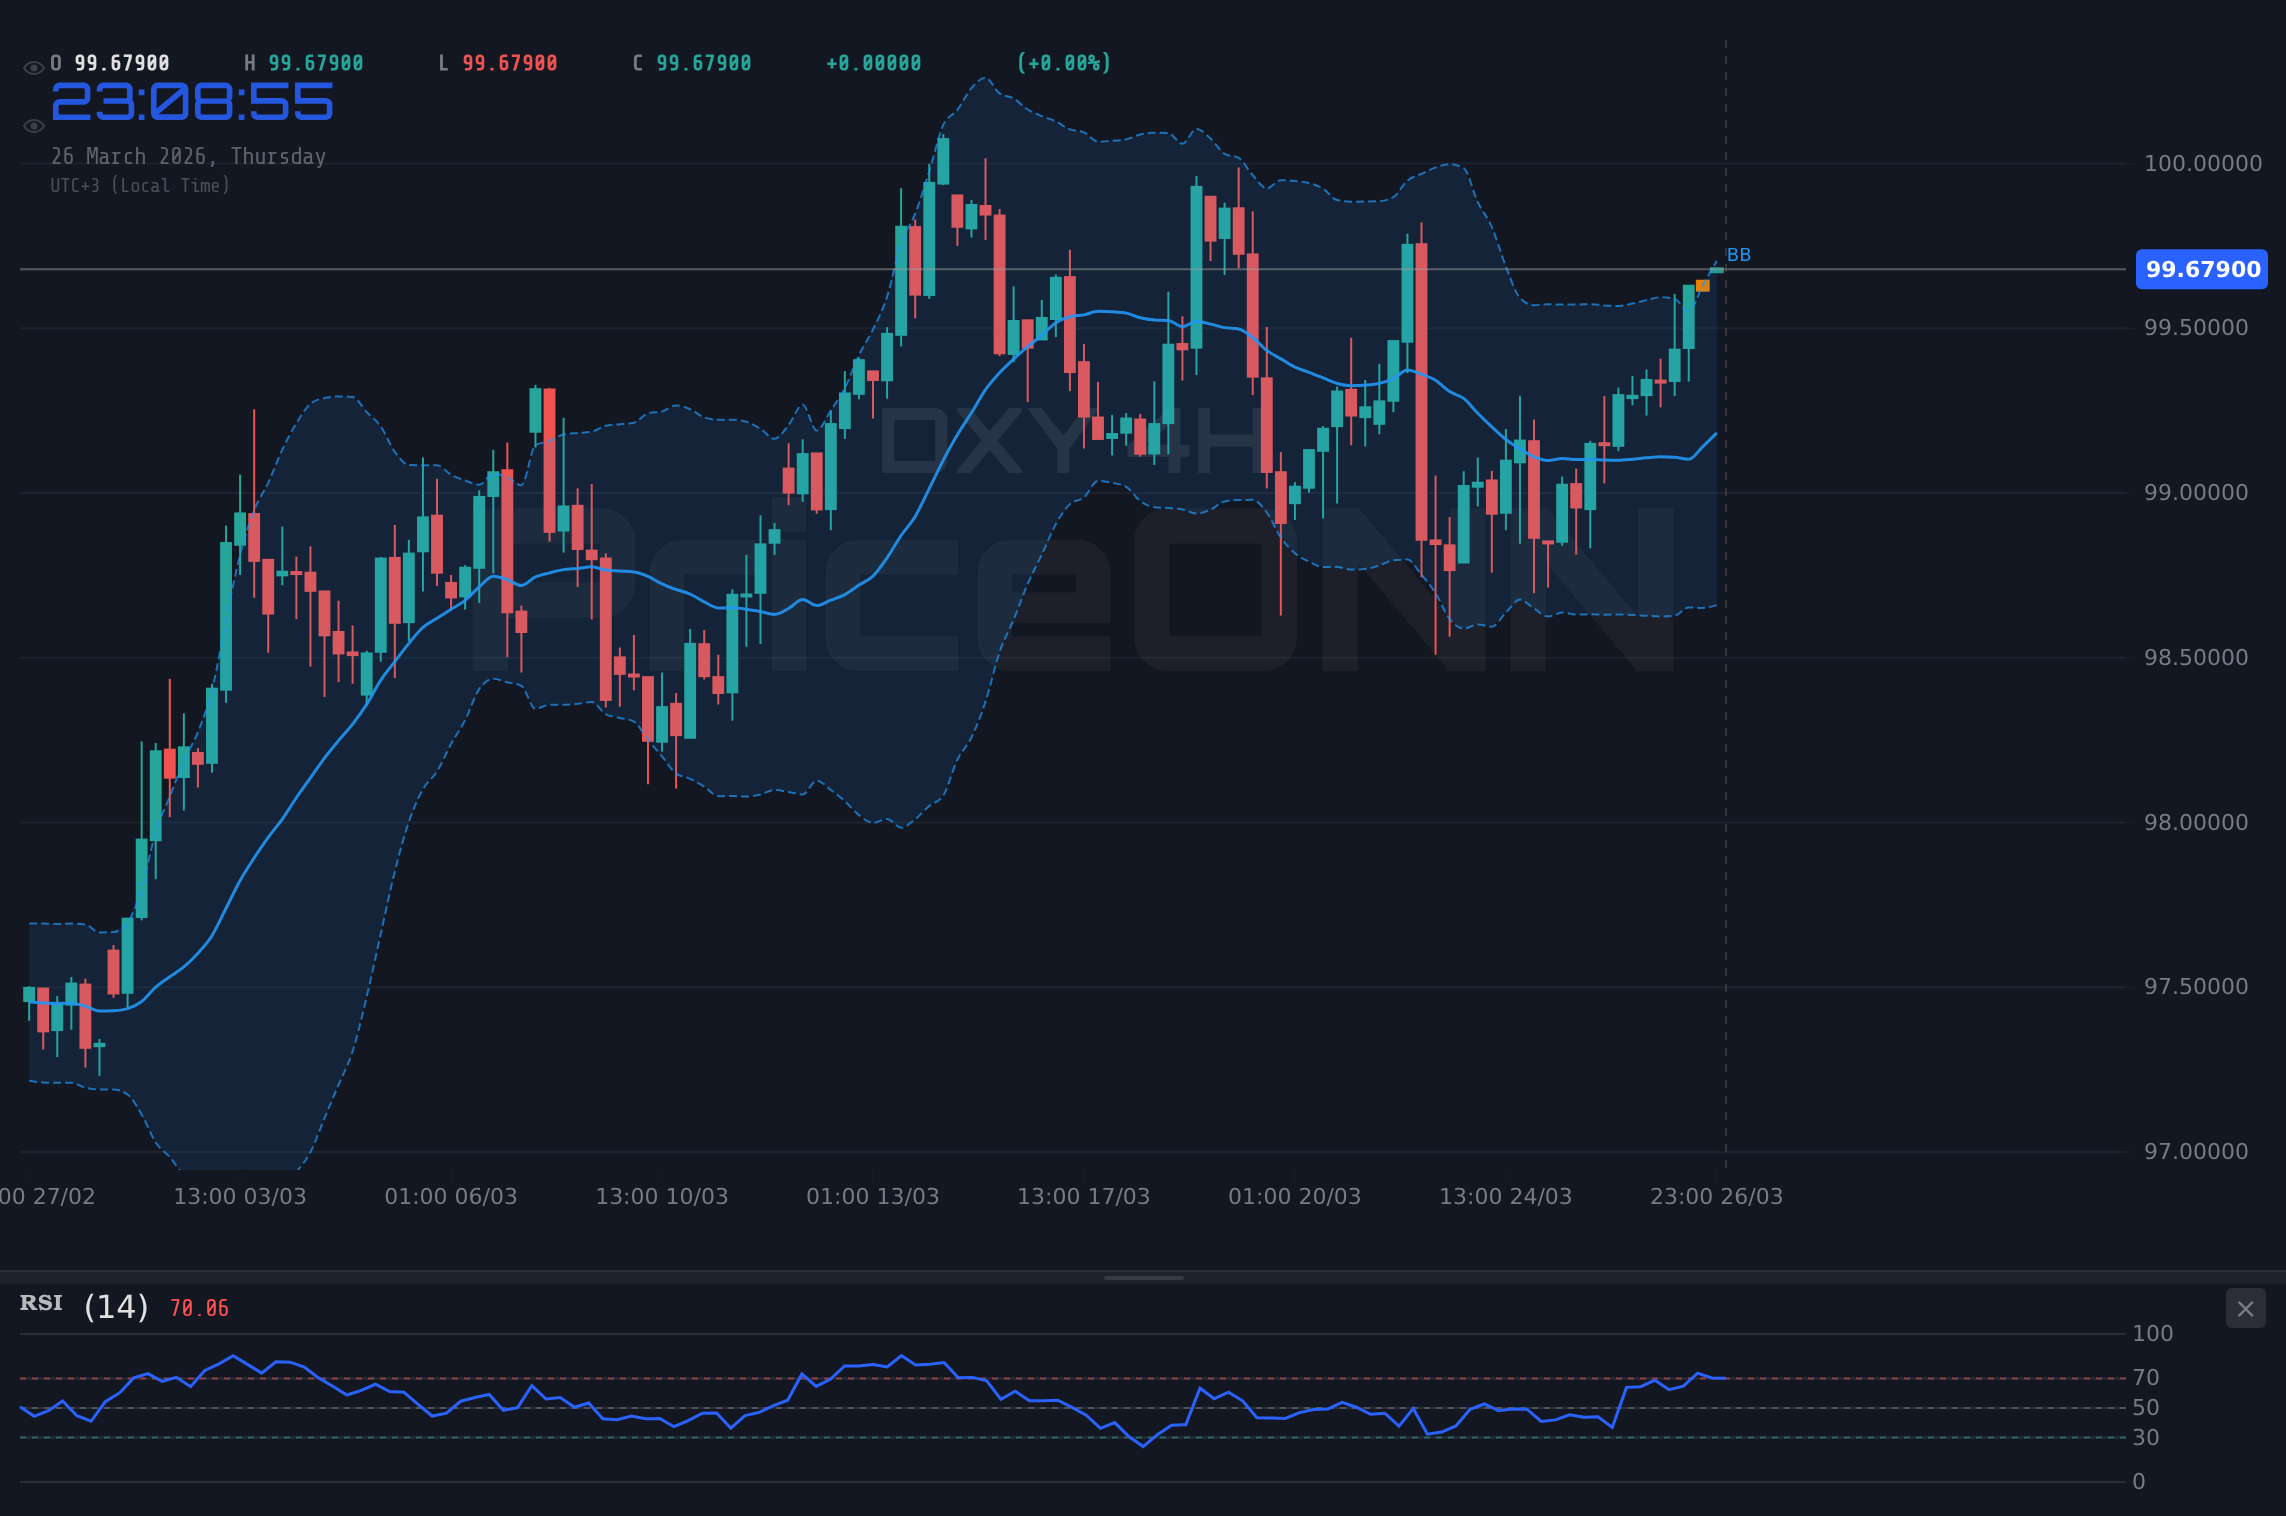
The battle lines are drawn around the $99.79 mark for the US Dollar Index (DXY). As traders digest a potent mix of geopolitical undercurrents and the anticipation of a significant speech from former President Donald Trump, the DXY finds itself at a critical juncture, testing established resistance levels. This price action is not happening in a vacuum; it's a reflection of broader market sentiment, a strengthening dollar narrative, and the intricate dance between risk-on and risk-off assets. The question on every trader's mind is whether the dollar can sustain this upward pressure or if the current levels will prove to be a temporary plateau before a potential reversal.
- The DXY is currently trading at $99.79, testing its immediate resistance level.
- The Dollar Index shows a strong upward trend on the 1-hour and daily charts, with ADX at 29.73 and 31.94 respectively.
- Geopolitical tensions in the Middle East and anticipated market-moving comments from Donald Trump are key drivers.
- Gold prices have tumbled to $4,355.84, reflecting a shift towards safe-haven demand in the dollar.
The current market environment is a complex tapestry woven with threads of geopolitical uncertainty and shifting monetary policy expectations. In this landscape, the DXY's performance is a crucial barometer for global risk appetite. A strengthening dollar often signals a 'risk-off' sentiment, where investors flock to perceived safe havens, leading to pressure on commodities like gold and silver, and impacting major currency pairs. The recent sharp declines in XAUUSD (down 3.34% to $4,355.84) and XAGUSD (down 5.62% to $67.20) underscore this correlation, as the dollar's ascent appears to be drawing capital away from precious metals. This dynamic highlights the interconnectedness of global markets and the pivotal role the DXY plays in setting the tone.
The Bull Case: Dollar Strength Fueled by Policy and Politics
The bullish argument for the DXY, currently trading at $99.79, is multifaceted, drawing strength from both monetary policy expectations and political developments. On the monetary front, while recent economic data might suggest a pause in tightening cycles for some central banks, the Federal Reserve's stance, even if hinting at future rate cuts, remains a key differentiator. The market's pricing of Fed Funds futures and OIS data, though not explicitly provided, often reflects a persistent hawkish bias relative to other major economies. This divergence in interest rate expectations typically supports a stronger dollar. The ADX indicator, a measure of trend strength, supports this narrative; on the 1-hour chart, it stands at 29.73, and on the daily chart, it's 31.94, both indicating a strong upward trend. The RSI on the daily chart is at 60.69, firmly in neutral territory but trending upwards, suggesting room for further appreciation before entering overbought conditions.
Adding fuel to the bullish fire is the looming influence of political events, specifically the anticipation surrounding a speech from former President Donald Trump. His past policy decisions and pronouncements have often created significant market volatility, particularly concerning trade relations and geopolitical stances. Any hints of a more protectionist trade policy, or a shift in foreign policy that could increase global uncertainty, might naturally drive capital towards the perceived safety of the US dollar. Furthermore, the current geopolitical tensions, especially in the Middle East, are amplifying safe-haven demand. When global risks escalate, the dollar, as the world's primary reserve currency, often benefits from increased inflows. This has been clearly observed in the sharp decline of gold, which has fallen to $4,355.84, indicating a preference for dollar-denominated assets over traditional safe havens during times of stress.
Technically, the DXY's price action supports a continuation of the uptrend. The 1-hour chart shows a strong bullish trend (Power: 97%) with the MACD indicator showing positive momentum and the MACD line above the signal line. The Stochastic oscillator is in overbought territory (K=94, D=83.08), which, while sometimes signaling a potential reversal, can also indicate sustained upward momentum in strong trends. The Bollinger Bands are trading above the middle band, reinforcing the bullish sentiment. The daily chart, while showing some conflicting signals with MACD displaying negative momentum, still maintains a strong trend strength (Power: 91%) and an ADX reading above 30, indicating a robust trend. The RSI at 60.69 on the daily chart is a healthy sign, not yet indicating overbought conditions and leaving room for upward movement.
The Bear Case: Challenges at Resistance and Shifting Global Dynamics
Despite the bullish signals, a compelling bear case can be constructed for the DXY at the $99.79 level. Firstly, the immediate resistance at $99.79 itself presents a significant hurdle. While the 1-hour and daily charts show strong upward trends, the DXY is currently testing these higher levels. Historically, prolonged testing of resistance can lead to exhaustion and a potential pullback. The 4-hour chart, in particular, paints a more neutral picture (Trend Power: 50%), suggesting that the upward momentum may be losing steam. The ADX on this timeframe is a mere 12.37, indicating a weak trend and a market that might be entering a consolidation phase rather than a strong directional move. This lack of strong trend conviction on the mid-term timeframe is a red flag for sustained rallies.
Furthermore, the technical indicators present a mixed bag, offering grounds for caution. While the 1-hour Stochastic is showing overbought conditions (K=94, D=83.08), this can sometimes precede a sharp reversal, especially if coupled with waning momentum. The daily chart's MACD is showing negative momentum, with the MACD line below the signal line, contradicting the bullish ADX and RSI readings. This divergence between indicators suggests that the market's conviction in the upward move might be weakening. The price action itself, hovering around the $99.79 resistance, could also be a precursor to profit-taking. Traders who have been long the dollar might see this as an opportune moment to secure gains, especially if there are signs of a broader market shift towards risk-on sentiment.
The fundamental landscape also offers counterarguments. While the Fed might maintain a relatively hawkish stance, other central banks are not standing still. If economic data from the Eurozone or the UK shows unexpected resilience, or if inflation there proves stickier than anticipated, it could lead to a narrowing of interest rate differentials, thereby reducing the appeal of the dollar. We have seen some currencies like GBPUSD (down 0.37% to $1.33118) and EURUSD (down 0.33% to $1.15211) showing weakness, but this could be a temporary phase before a potential rebound if global risk sentiment shifts. Moreover, the market's reaction to Trump's speech is inherently unpredictable. While it could increase uncertainty and boost the dollar, it could also lead to a 'buy the rumor, sell the news' event, especially if the market has already priced in a significant portion of the potential impact.
The correlation with other markets also presents a potential bearish signal. While gold and silver have fallen, indicating dollar strength, this dynamic can reverse rapidly if geopolitical tensions ease or if risk appetite returns. The sharp drops in SP500 (down 1.76% to 6475.55) and Nasdaq100 (down 2.37% to 23584.1) suggest a risk-off environment, which typically supports the dollar. However, if these indices find a bottom and begin to rally, it could signal a shift in sentiment, reducing demand for the dollar as a safe haven.
Navigating the Levels: What the Data Tells Us
Examining the provided data, the DXY is currently perched at $99.79. The immediate resistance levels are clearly defined: $99.79, $99.90, and $100.11 on the daily chart. A decisive break and sustained hold above $99.79, particularly with strong volume, would validate the bullish thesis and open the door for further upside. The next significant target would then be the psychological level of $100, followed by the higher resistance points. On the flip side, failure to overcome $99.79 could see the DXY retreat. The support levels to watch are $99.72, $99.51, and $98.90 on the daily chart. A close below $99.72 would weaken the immediate bullish outlook, while a break below $98.90 would signal a more substantial correction.
The technical indicators offer conflicting signals, especially when viewed across different timeframes. The 1-hour chart is strongly bullish, with ADX at 29.73 and RSI at 69.91. The Stochastic oscillator is in overbought territory, suggesting caution. The 4-hour chart, however, presents a mixed picture with a weak ADX of 13.91 and a neutral RSI of 65.86. The daily chart shows strong trend strength with ADX at 31.94, but a neutral RSI at 60.69 and negative MACD momentum. This divergence suggests that while the short-term trend is bullish, the conviction might be wavering, and a retest of lower levels is plausible if key resistance fails to break. The market is effectively at a crossroads, and the upcoming Trump speech, coupled with any shifts in geopolitical risk or economic data, will be crucial in determining the next directional move.
Bearish Scenario: Resistance Holds Firm
65% ProbabilityNeutral Scenario: Consolidation Around Resistance
25% ProbabilityBullish Scenario: Breakout Confirmation
10% ProbabilityThe market is currently positioned at a critical juncture for the DXY around the $99.79 level. The confluence of political anticipation, ongoing geopolitical events, and the inherent strength of the US dollar as a reserve currency creates a potent cocktail of market drivers. While short-term technicals on the 1-hour chart suggest bullish momentum, the mixed signals across different timeframes, particularly the weak trend on the 4-hour chart and the negative MACD momentum on the daily, warrant a degree of caution. The higher probability scenario leans towards a potential consolidation or a bearish move if resistance at $99.79 proves too formidable, especially if the anticipated speech from Donald Trump fails to ignite further dollar demand or, worse, introduces uncertainty that leads to profit-taking. Traders would be wise to watch for a clear break above $99.79 for confirmation of a sustained rally, or a decisive close below $99.72 as a signal for a potential downside move.
Frequently Asked Questions: DXY Analysis
What happens if DXY fails to break above the $99.79 resistance level?
If the DXY fails to break and hold above $99.79, a pullback is probable. The immediate support level to watch would be $99.72, followed by $99.51. A break below these levels would signal a weakening of the bullish trend.
Is the RSI at 60.69 on the daily chart a buy signal for DXY at current levels?
An RSI of 60.69 on the daily chart is in the neutral-to-bullish territory, indicating upward momentum but not yet overbought conditions. While it suggests potential for further gains, it is not a definitive buy signal on its own and should be considered alongside other indicators and price action.
How might Donald Trump's upcoming speech affect the DXY price around $99.79?
Trump's speech could significantly impact the DXY. If it signals policy shifts that increase global uncertainty or trade tensions, it could boost the dollar's safe-haven appeal, potentially pushing the DXY above $99.79. Conversely, if the speech is seen as less impactful or is perceived negatively, it could lead to profit-taking and a DXY pullback.
Should traders buy DXY at $99.79 given the strong 1-hour trend but mixed daily signals?
Buying at current levels of $99.79 requires careful risk management due to conflicting signals across timeframes. A breakout above $99.79 with confirmation from daily indicators and volume would be a stronger buy trigger. Otherwise, waiting for a pullback to support levels like $99.51 with clearer confirmation might offer a better risk-reward ratio.
Track markets in real-time
AI-powered analysis, technical indicators and real-time price data.
Join Our Telegram Channel
Breaking market news, AI analysis and trading signals instantly.
Join Channel