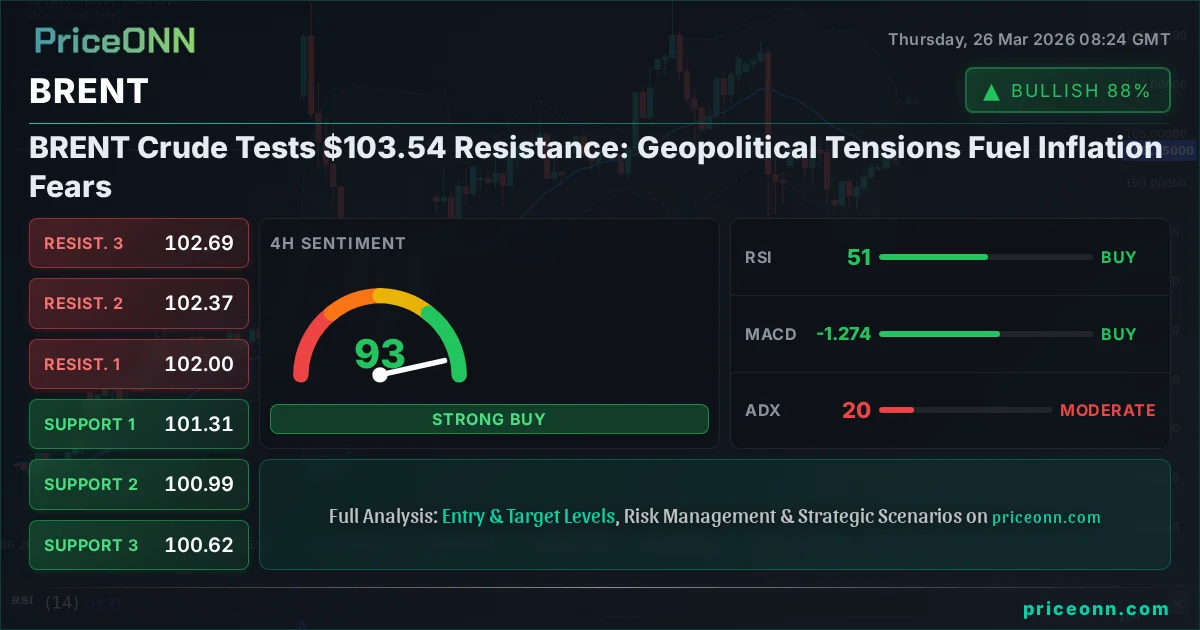
BRENT Crude Tests $103.54 Resistance: Geopolitical Tensions Fuel Inflation Fears
Brent crude hovers near $103.54 amid escalating Middle East tensions. Technicals show a strong downtrend, but ADX suggests moderate trend strength. Key levels to watch.
Now this is where it gets interesting! Brent crude is currently dancing around the $103.54 mark, and the chart is telling a story of rising geopolitical risk met with strong technical headwinds. The Middle East is once again a focal point, with escalating tensions threatening global energy supply. This isn't just background noise; it's actively feeding into inflation expectations and, consequently, shaping central bank policy considerations worldwide. As traders, our job is to decipher these signals, understand the underlying currents, and position ourselves for what comes next. The question isn't just about oil prices today, but about the ripple effects across markets and economies.
- Brent crude is trading at $103.54, showing a daily decrease of -1.90% (-1.93) from its peak.
- The ADX on the daily chart is 62.6, indicating a very strong uptrend, yet RSI at 64 suggests room for upward movement before overbought conditions.
- Key resistance is at $103.49, with support at $98.32; a break above resistance could target $105.37.
- Geopolitical tensions in the Middle East are a significant driver, potentially impacting inflation and influencing central bank decisions globally.
Navigating the Brent Price Action: A Critical Juncture
The Daily Grind: What the Charts Are Saying
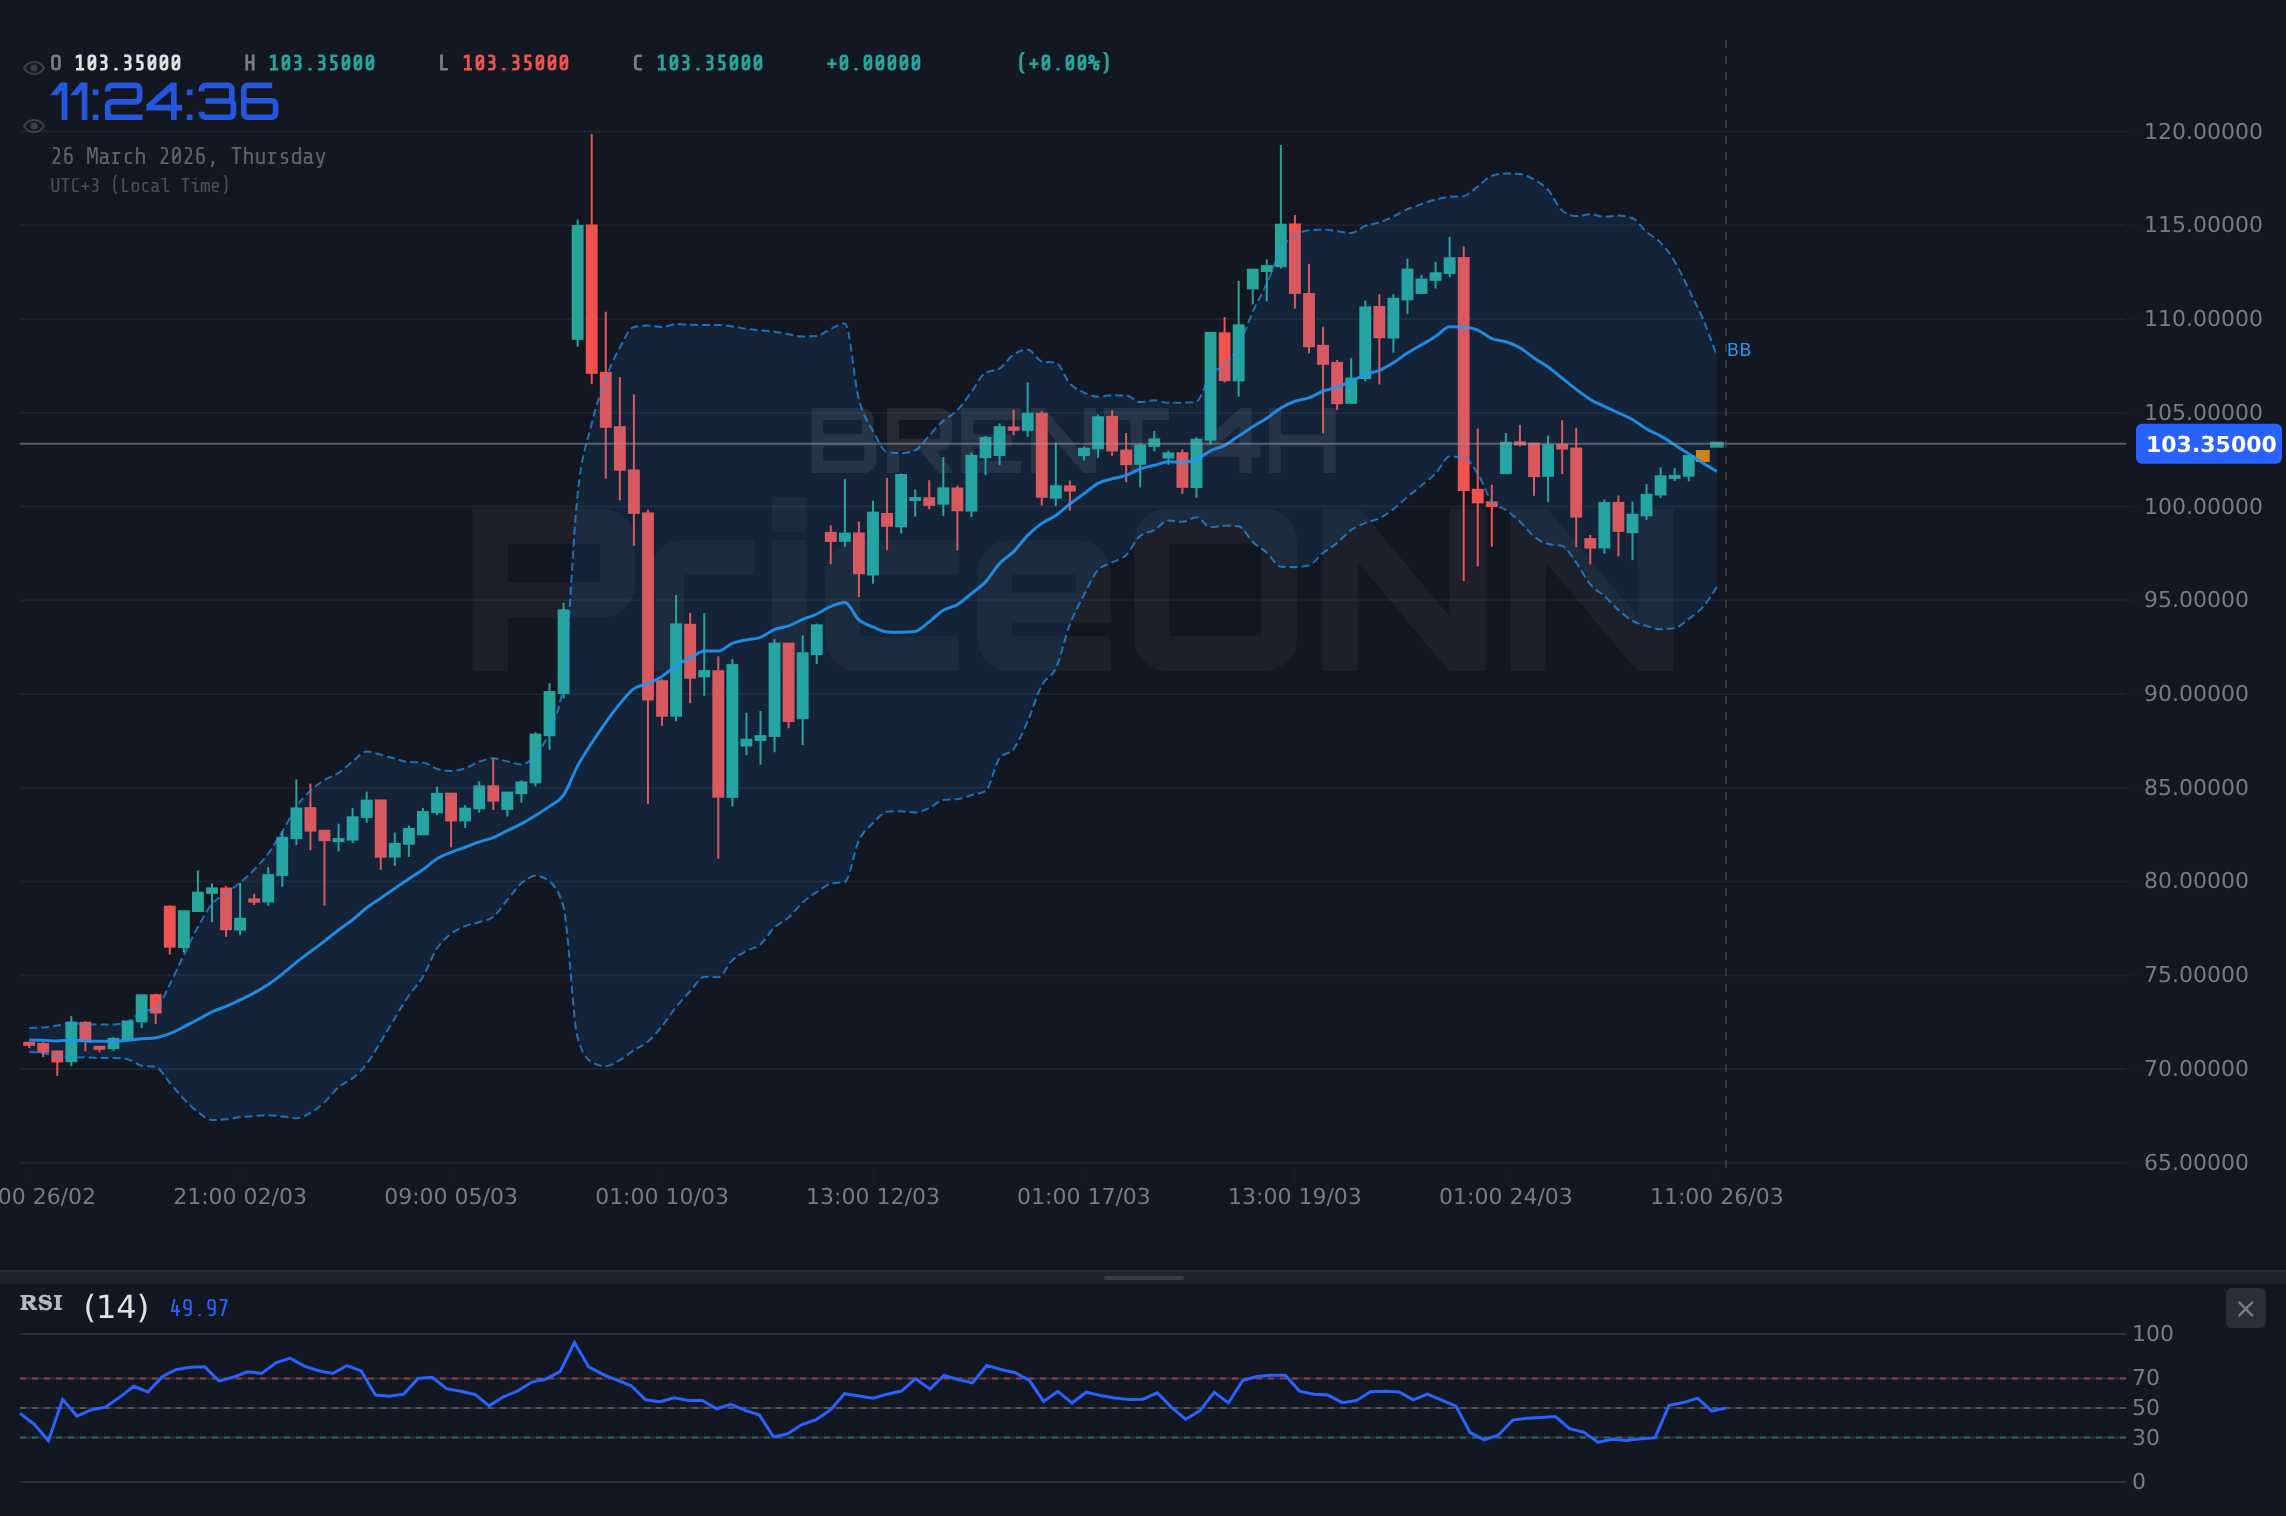
Looking at the daily chart for Brent crude, the picture is undeniably bullish in terms of trend strength, with an ADX reading of 62.6 screaming 'strong trend'. This isn't a market that's merely wobbling; it's in a committed upward move. However, the current price of $103.54 is bumping against a significant resistance level at $103.49. This is a classic tug-of-war scenario. While the overall trend is strong, the immediate price action is testing the resolve of the buyers. The RSI(14) at 64.00, while indicating a healthy upward momentum, is not yet in overbought territory (typically considered above 70). This suggests there's still room for the price to climb before bulls start feeling the heat of excessive valuations. It's a delicate balance: the trend is your friend, but you can't ignore immediate price resistance.
The MACD on the daily timeframe, however, presents a slightly more cautious signal. It's currently showing negative momentum with the MACD line below its signal line. This divergence between the strong ADX and the lagging MACD is something to pay close attention to. It suggests that while the trend is firmly established, the momentum driving it might be starting to waver, or at least, the immediate push higher is facing some internal resistance. This is where disciplined trading comes in. We don't just blindly follow the trend; we look for confirmation and understand the potential for pullbacks or consolidations.
The 4-Hour Chart: Momentum's Mixed Signals
Shifting our gaze to the 4-hour timeframe, the narrative becomes a bit more nuanced. The ADX here is a more moderate 20.13, indicating a trend of medium strength. This aligns with the idea that while the daily trend is robust, the intraday movements might be less committed. The RSI(14) is sitting at 51.05, right around the midpoint, suggesting a neutral stance. It’s neither pushing into overbought nor oversold territory, reflecting the current indecision as price probes that key $103.49 resistance. The MACD on this timeframe is positive, with the MACD line above its signal line, supporting the idea of upward momentum. However, the Stochastic K value is at 71.19 and D at 45.17, indicating an overbought condition and a potential for a pullback.
This is precisely the kind of conflicting signal that often precedes a significant move. When the daily chart shows a strong trend but the 4-hour chart shows overbought conditions and a less committed trend, it signals caution. It's not a time to chase the price higher blindly. Instead, it's a time to watch for either a decisive breakout above resistance with increasing volume and confirmation across timeframes, or a pullback to retest lower support levels. The price action around $103.54 is crucial for determining the next short-term direction.
The 1-Hour Chart: Short-Term Dynamics at Play
On the shortest timeframe we're analyzing, the 1-hour chart, Brent crude is showing a neutral trend with an ADX of 20.29. The RSI(14) is at 64.65, still in the upper half of the neutral zone but showing a slight upward inclination. The MACD is positive, indicating bullish momentum in the very short term, and the Stochastic values (K=94.16, D=91.44) are deep in overbought territory. This screams 'caution' for intraday traders. The Stochastic crossing from above suggests that a short-term profit-taking move or a consolidation is imminent. The Bollinger Bands are showing the price hugging the upper band, consistent with the overbought Stochastic reading.
The immediate resistance on this 1H chart is at $102.92, $103.13, and $103.37, with the current price already above these. The next significant hurdle is the daily resistance at $103.49. A break above this level on the 1-hour chart, especially if accompanied by increased volume and a MACD crossover, could signal the start of a move towards the next target. However, given the overbought Stochastic and the proximity to the daily resistance, a short-term pullback to test the $102.47 support level is also a very real possibility. This intraday volatility is often where smaller, quicker trades can be made, but also where mistakes are easily amplified.
The Macroeconomic and Geopolitical Undercurrents
Middle East Tensions: The Inflationary Spark
It's impossible to discuss oil prices without acknowledging the escalating geopolitical tensions in the Middle East. Recent news highlights how these conflicts are directly impacting global LNG trade and sparking inflation fears, particularly for economies like Australia. When a significant portion of global energy supply is threatened, the immediate market reaction is often a price surge. This isn't just speculation; it's a direct response to potential supply disruptions. Brent crude's rise to $103.54 is, in part, a reflection of this heightened risk premium being priced into the commodity. The question is how long this premium will last and how it will influence broader inflation trends.
The impact on inflation is a critical factor for central banks. If sustained higher energy prices feed into broader inflation measures, it could force policymakers, including the Fed and the ECB, to reconsider their stances on interest rates. While the current narrative might be shifting towards rate cuts, persistent inflation driven by commodity prices could put that on hold. This creates a complex interplay between energy markets, inflation data, and monetary policy, which in turn affects currency markets like USD/JPY and GBP/JPY, as seen in recent trading patterns.
The Dollar's Role: A Tale of Two Trends
The US Dollar Index (DXY) is currently at 99.47, showing a daily increase of 0.17%. On the daily chart, the DXY exhibits a strong uptrend (ADX: 31.44), which typically puts pressure on dollar-denominated commodities like Brent crude. However, the relationship isn't always inverse. When geopolitical risks rise, the dollar can also act as a safe haven, creating a complex dynamic. Currently, the DXY's strength, supported by a robust daily uptrend, might be acting as a slight headwind for Brent's ascent, even as geopolitical factors push oil prices higher.
The interplay between the DXY and Brent is crucial. A strengthening dollar often implies tighter global liquidity or a 'risk-off' sentiment, which would normally weigh on commodities. Conversely, rising oil prices can contribute to inflation, potentially leading to higher interest rates in the US, which would then strengthen the dollar. We are seeing elements of both play out. The DXY's daily chart shows a strong trend, but its 1-hour and 4-hour indicators are mixed, suggesting some consolidation. This could provide a window for Brent to push higher if geopolitical fears outweigh dollar strength in the immediate term.
Correlations with Equities: Risk Appetite Matters
Looking at the broader market sentiment, the S&P 500 is down 0.52% at 6557.1, and the Nasdaq 100 has fallen 0.65% to 23999.88. This indicates a 'risk-off' sentiment in the equity markets. Typically, a decline in equities suggests investors are moving away from riskier assets towards safer havens. Gold, for instance, is down 1.43% at $4441.97, which is somewhat counterintuitive if risk appetite is truly collapsing, as gold often benefits from safe-haven demand. However, gold's recent pullback might be driven by other factors, such as profit-taking or a stronger dollar.
For Brent, a 'risk-off' environment can be a double-edged sword. On one hand, it might signal reduced global economic activity and thus lower demand for oil. On the other hand, if the 'risk-off' sentiment is primarily driven by geopolitical instability, as it appears to be now, then the supply-side fears for oil can override demand concerns, leading to higher prices, as we're seeing. The fact that Brent is showing a strong daily uptrend despite equity market weakness suggests that the supply-side narrative is currently dominating market psychology.
Trade Scenarios: Charting the Path Forward
Bearish Scenario: Consolidation or Reversal?
45% ProbabilityNeutral Scenario: Choppy Trading Around Key Levels
30% ProbabilityBullish Scenario: Breaking the Ceiling
25% ProbabilityThe Trader's Edge: Actionable Insights
What Does This Mean for You Right Now?
For the short-term trader, the current price action around $103.54 presents a challenging but potentially rewarding environment. The daily trend is strong, but immediate resistance and mixed signals on shorter timeframes demand caution. Chasing the price above $103.49 without confirmation could lead to getting caught in a reversal. Conversely, betting on a breakdown without seeing a clear catalyst or break of support levels is equally risky. Patience is key here. Waiting for a decisive breakout above $103.49, confirmed by volume and technicals across multiple timeframes, could offer a higher probability trade setup towards $105.37. Alternatively, watching for a pullback to the $102.02 or $101.31 support levels, especially if accompanied by signs of stabilization on the 4-hour chart, might present a lower-risk entry point for a bounce.
The longer-term outlook for Brent remains heavily influenced by the geopolitical situation in the Middle East. If tensions escalate further, the supply-side premium could easily push prices towards the $105.37 and even higher targets. However, if diplomatic solutions emerge or if global demand fears begin to dominate, we could see a reversal. The daily ADX at 62.6 suggests the market is strongly trending, meaning that once a direction is established, it tends to be followed with conviction. The immediate focus must remain on that $103.49 resistance level. A failure to decisively break it could lead to a period of consolidation or a deeper correction, testing the strength of the underlying trend.
The Bigger Picture: Inflation and Central Banks
It's crucial to remember that oil prices don't exist in a vacuum. The current strength in Brent crude, driven by supply concerns, directly feeds into global inflation metrics. This is a major headache for central banks like the Federal Reserve and the European Central Bank. If inflation remains stubbornly high, it could delay or even halt expected interest rate cuts. This would have significant implications for currency pairs like EUR/USD and GBP/USD, potentially strengthening the dollar further, which, as we've seen, can act as a counterforce to rising oil prices. The delicate dance between energy prices, inflation, and monetary policy will be a key theme to watch in the coming weeks and months.
The strong upward trend indicated by the daily ADX suggests that underlying demand and supply factors, amplified by geopolitical risk, are currently outweighing concerns about global economic slowdown or dollar strength. However, market dynamics can shift rapidly. Traders should remain vigilant, monitor the economic calendar for any key inflation or central bank announcements, and keep a close eye on the geopolitical landscape. The $103.54 level for Brent crude is not just a price point; it's a battleground where supply fears, inflation concerns, and technical resistance collide.
Frequently Asked Questions: BRENT Analysis
What happens if BRENT breaks decisively above the $103.49 resistance level?
A sustained break above $103.49, confirmed by strong volume and positive MACD signals on the 4-hour chart, would likely trigger a move towards the next daily resistance target at $105.37. This scenario implies that geopolitical supply risks are currently outweighing demand concerns and dollar strength.
Should I buy BRENT at current levels of $103.54 given the strong daily uptrend (ADX 62.6)?
Buying at current levels carries risk due to immediate resistance at $103.49 and overbought Stochastic signals on shorter timeframes. A more prudent approach might be to wait for a confirmed breakout above $103.49 or a pullback to a support level like $102.02 for a better risk-reward entry. The probability of a bullish continuation above resistance is estimated at 25%, while a pullback scenario holds a 45% probability.
Is the RSI at 64 a sell signal for BRENT right now?
An RSI of 64 is not typically considered a sell signal; it indicates upward momentum but still has room before reaching overbought territory (above 70). However, when combined with overbought Stochastic readings on shorter timeframes and resistance at $103.49, it suggests that further immediate upside might be limited without a clear catalyst.
How will ongoing Middle East tensions affect BRENT prices this week?
Escalating tensions in the Middle East are a primary driver for Brent crude's current strength, primarily due to fears of supply disruptions. If these tensions persist or worsen, we could see prices testing higher resistance levels, potentially targeting $105.37 or even $108.66. This narrative currently outweighs concerns about global demand or dollar strength.
Patience looks like it will be rewarded here. The market is presenting a clear battleground around $103.49. Waiting for confirmation of either a breakout or a breakdown will be crucial for navigating this volatile environment successfully. Remember, managing your risk and waiting for your setup is paramount - the market always provides another opportunity.
Track markets in real-time
AI-powered analysis, technical indicators and real-time price data.
Join Our Telegram Channel
Breaking market news, AI analysis and trading signals instantly.
Join Channel