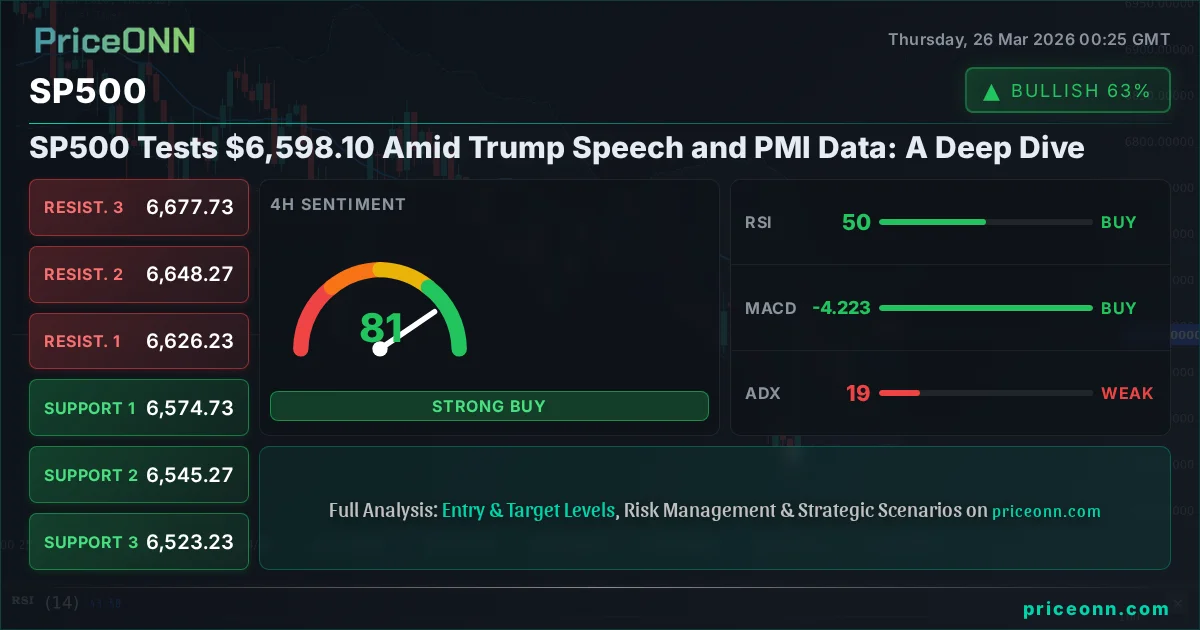
SP500 Tests $6,598.10 Amid Trump Speech and PMI Data: A Deep Dive
The SP500 is hovering around $6,598.10 as traders digest geopolitical signals and economic data. Technical indicators present a mixed picture, demanding caution.
The S&P 500 index is currently trading around the critical $6,598.10 mark, finding itself at a pivotal juncture where geopolitical undertones and economic data are creating a complex market environment. This level, while seemingly just a number, represents a significant psychological and technical barrier that market participants are closely watching. The recent volatility, underscored by a notable 0.02% daily change to reach $6,598.10, paints a picture of indecision, with bulls and bears battling for control in a market that is increasingly sensitive to both headline news and nuanced economic indicators. Understanding the interplay between these factors is crucial for navigating the current trading landscape, especially as we observe correlations with the Dollar Index (DXY), commodity price action, and the broader risk sentiment across global equity markets.
- The SP500 is currently hovering around $6,598.10, a key psychological and technical level.
- On the 1-hour chart, RSI at 51.41 suggests a neutral stance with a slight upward bias, while the MACD indicates negative momentum.
- The 4-hour chart shows a stronger bullish lean with RSI at 50.81 and MACD positive, but Stochastic signals a potential pullback.
- The daily trend is firmly bearish with ADX at 45.56, indicating a strong downtrend, despite short-term fluctuations.
- Correlations with a strengthening DXY at 99.4 and rising oil prices at $101.86 suggest potential headwinds for equities if risk sentiment falters.
The market's reaction to various inputs has been nuanced. While the DXY is showing strength, climbing 0.54% to 99.4, and oil prices are surging - Brent crude up 2.41% to $101.86 and WTI up 3.22% to $91.48 - these moves typically signal a risk-off environment that could pressure equities. However, the SP500's minimal daily gain suggests a complex interplay of forces, possibly indicating that some of these traditional correlations are being tested or that other factors are at play. The current price action around $6,598.10 is a testament to this market's intricate dynamics, where a seemingly small price movement can mask significant underlying shifts in sentiment and positioning.
Navigating the Headlines: Geopolitics and Economic Whispers
The recent market narrative has been significantly influenced by geopolitical developments and evolving economic data. Speculation surrounding former President Trump's speeches and their potential impact on trade policy continues to cast a shadow, creating a degree of uncertainty that often translates into market choppiness. While specific policy shifts are yet to materialize, the mere anticipation can lead to cautious trading behavior. This uncertainty is amplified by the latest PMI data releases. The US's ISM Services PMI came in at 52.4, slightly above the forecast of 51.5, which generally signals economic expansion. However, the Manufacturing PMI reading of 51.1, below the forecast of 52, suggests a more mixed picture, with the manufacturing sector showing less robust growth. This dichotomy in economic indicators means that the market is struggling to form a clear consensus on the overall health of the US economy, leading to the tight trading ranges observed around key levels like the SP500's $6,598.10.
Furthermore, the global economic backdrop cannot be ignored. The mixed signals from European economies, with the UK's Services PMI at 3 (Actual) versus a Forecast of 3, and the Eurozone experiencing some headwinds, add another layer of complexity. While these specific figures might not directly move the SP500 in lockstep, they contribute to the overall global risk sentiment. A perceived slowdown in major economies could theoretically dampen demand for US assets, yet the SP500's resilience above $6,598.10 suggests underlying strength or perhaps a market that is becoming desensitized to certain negative economic cues. The interplay between domestic economic health, global economic trends, and geopolitical tensions creates a volatile cocktail that requires careful monitoring. The market is essentially weighing the potential impact of a stronger dollar and higher oil prices against the resilience shown in certain US economic data points, all while navigating the unpredictable landscape of international relations.
The strength in oil prices, with Brent crude breaching $101.86 and WTI nearing $91.48, is particularly noteworthy. Historically, such a surge often correlates with increased inflation expectations and can trigger concerns about tighter monetary policy or reduced consumer spending power. This typically weighs on equity markets. However, the SP500's current stance near $6,598.10 suggests that either the market believes this inflation is transitory, or that the underlying economic momentum is strong enough to absorb these higher energy costs. Alternatively, it could simply reflect a temporary divergence before a more significant market reaction unfolds. The key takeaway is that while traditional indicators point towards caution, the SP500's price action is currently defying a straightforward risk-off narrative, highlighting the need for a multi-faceted analytical approach.
Technical Undercurrents: Indicators Paint a Mixed Canvas
Delving into the technical indicators provides a more granular view of the SP500's current position around $6,598.10. On the 1-hour timeframe, the Relative Strength Index (RSI) stands at 51.41. This reading places it firmly in the neutral zone, indicating a lack of strong overbought or oversold conditions, but with a slight upward bias suggesting that buyers are marginally more present than sellers in the very short term. However, the Moving Average Convergence Divergence (MACD) on the same timeframe shows negative momentum, with the MACD line below its signal line, hinting at potential downward pressure. This divergence between the RSI and MACD on the hourly chart is a classic sign of market indecision, where short-term trends are not yet clearly defined.
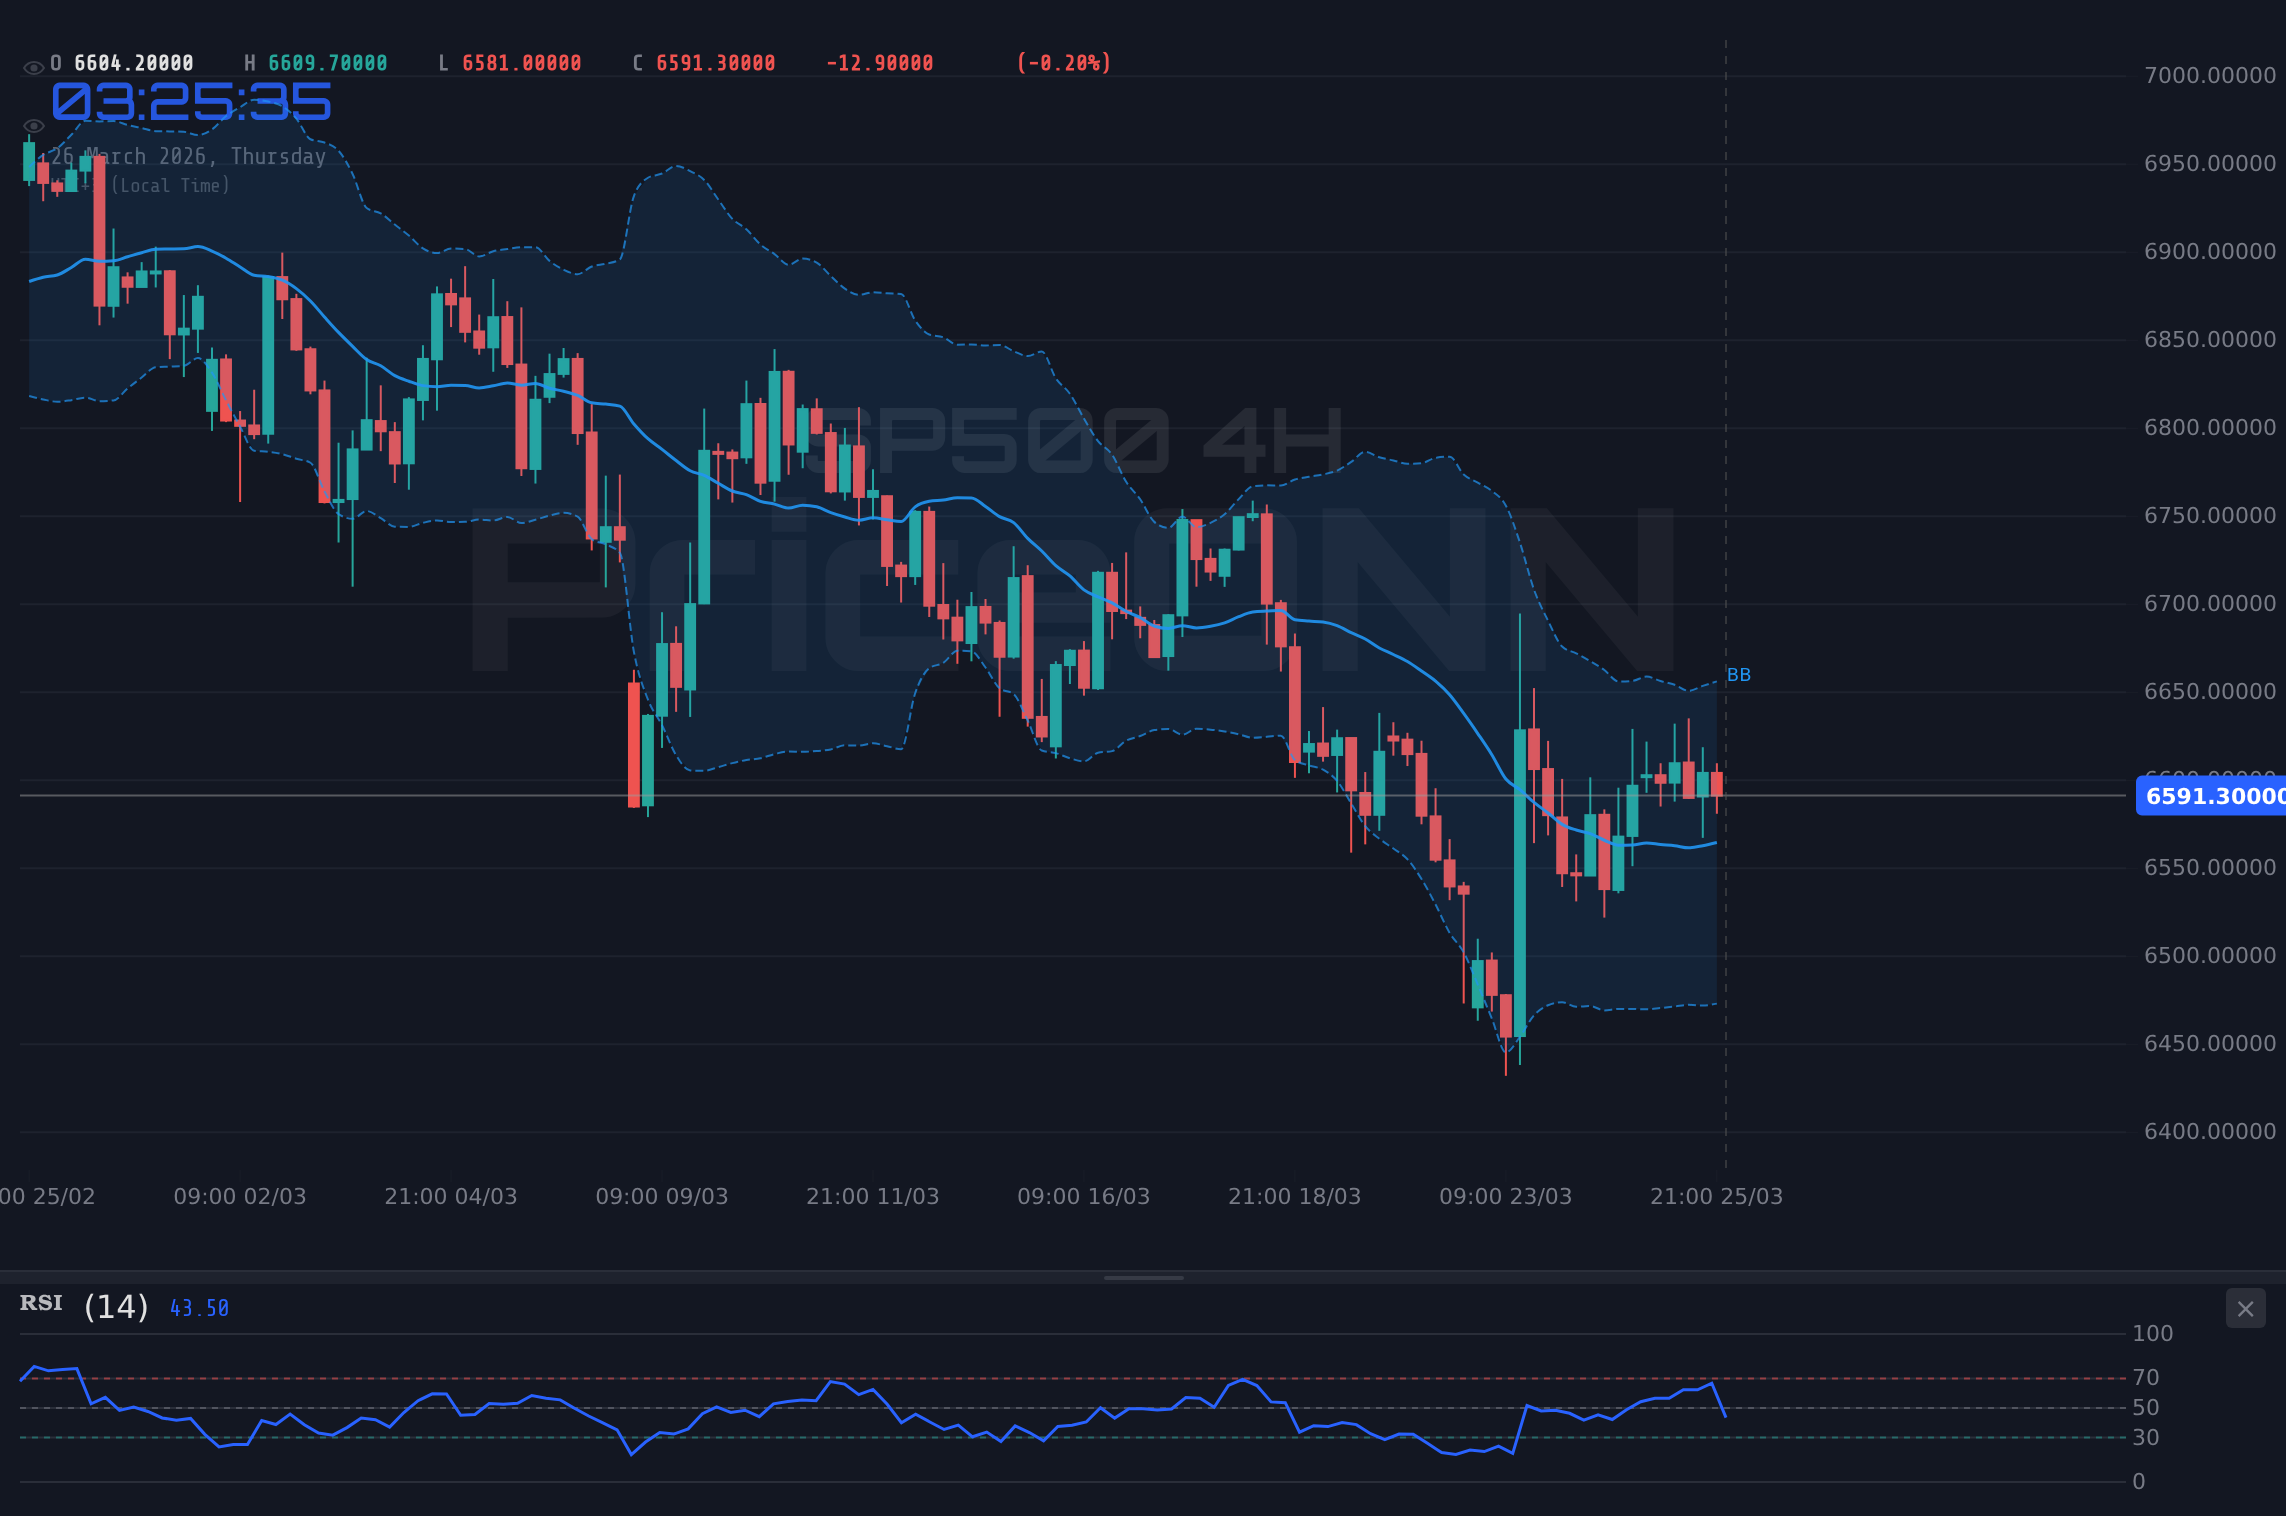
Shifting to the 4-hour chart, the picture becomes slightly more bullish, though still cautious. The RSI is at 50.81, again in neutral territory, but the MACD is showing positive momentum, with the MACD line above its signal line. This suggests that the medium-term outlook might be more optimistic. However, the Stochastic Oscillator on this timeframe is K=66.64 and D=67.07, presenting a bearish signal as %K is below %D and both are in the upper range, indicating a potential for a pullback from current levels. This conflict between the MACD and Stochastic on the 4-hour chart reinforces the theme of ambiguity. While the MACD suggests underlying strength, the Stochastic warns of potential selling pressure, especially if the index fails to decisively break above immediate resistance levels near $6,596.8.
The daily timeframe presents the most significant divergence from a bullish perspective. The ADX, a measure of trend strength, is at a robust 45.56. This indicates a strong prevailing trend, and given the overall context, it points towards a strong downward momentum. The RSI(14) is at 34.55, firmly in the oversold territory on some scales but still showing a downward eğilim, suggesting that while there might be some short-term relief rallies, the dominant trend is bearish. The MACD on the daily chart also displays negative momentum, with the MACD line below its signal line. The Bollinger Bands are also below the middle band, reinforcing the bearish sentiment on the daily timeframe. This confluence of bearish signals on the daily chart is a critical observation, suggesting that any short-term strength observed on lower timeframes might be mere counter-trend movements within a larger downtrend. The ADX value of 45.56 is particularly concerning for bulls, as it signifies a well-established downward trend that requires significant conviction to reverse.
The Stochastic Oscillator on the daily chart, however, offers a glimmer of hope for the bulls, showing K=46.42 and D=29.89, with %K above %D, indicating a potential upward signal. This is a classic example of conflicting signals across different indicators and timeframes. The strong bearish trend indicated by the ADX and daily MACD is counterbalanced by potential oversold conditions suggested by the daily Stochastic and the neutral-to-slightly-bullish readings on lower timeframes. This technical landscape underscores the 'WATCH_ZONE' recommendation; the market is not yet presenting a clear, high-conviction setup for either direction. A decisive move is needed to confirm a continuation of the downtrend or the initiation of a significant reversal. The ADX reading of 18.52 on the 4-hour chart also indicates a relatively weak trend on that timeframe, further contributing to the choppiness and lack of clear direction, despite the strong daily ADX.
Trade Stance: Patience in the Face of Ambiguity
Given the conflicting signals across multiple timeframes and indicators, the current market condition for the SP500 around $6,598.10 warrants a 'WATCH_ZONE' approach. The ADX values, particularly the strong 45.56 on the daily chart suggesting a firm downtrend, contrast sharply with the neutral RSI readings on lower timeframes and the potential for a Stochastic reversal signal. This divergence means that initiating a trade at these precise levels carries a higher degree of risk. The market is essentially in a state of flux, caught between geopolitical uncertainties, mixed economic data, and conflicting technical signals. Therefore, the most prudent strategy is to wait for clearer confirmation before committing capital.
A valid setup would likely emerge from a decisive break of a key level. For instance, a daily close above the resistance level of $6,643.4 would be necessary to challenge the prevailing bearish trend. This would require sustained buying pressure and confirmation from other indicators, such as RSI moving decisively above 50 and MACD turning bullish on the daily chart. Conversely, a breakdown below the support level of $6,536.2 would confirm the continuation of the daily downtrend and could open the door for further downside. Such a move would need to be accompanied by increasing volume and sustained bearish momentum across indicators. Until one of these scenarios plays out with conviction, active trading is ill-advised, and a focus on risk management should be paramount.
The current environment is characterized by low trend strength on lower timeframes (ADX 11.26 on 1H, 18.52 on 4H), which often precedes significant price movements. However, the strong daily ADX (45.56) suggests that the larger trend is still very much in play. This means that any short-term rallies might be opportunities for sellers to enter the market at better prices, or conversely, that a sustained break above key resistance could signal the start of a more significant trend change. The absence of a clear directional bias from the majority of indicators on the 1-hour and 4-hour charts, coupled with the strong bearish signal on the daily chart, creates a 'wait-and-see' scenario. Traders should focus on identifying the key levels - $6,536.2 support and $6,643.4 resistance - and await a confirmed break with supporting volume and indicator confirmation.
Forward Outlook: Seeking Clarity in the Noise
Looking ahead, the SP500's path will likely be dictated by how effectively the market can digest the ongoing geopolitical narratives and upcoming economic data. The influence of the DXY, currently strong at 99.4, will remain a critical factor, potentially capping upside for the index if it continues to strengthen. Similarly, the trajectory of oil prices, currently elevated, will be closely watched for signs of inflationary pressure that could impact Fed policy expectations. The market's ability to sustain a move above the $6,598.10 level, and more importantly, to challenge the $6,643.4 resistance, will be a key test for the bulls. Conversely, failure to hold the $6,536.2 support could signal a deeper correction.
The technical picture, while currently conflicted, suggests that a period of consolidation or a decisive breakout is likely imminent. The weak trend strength indicated by ADX on lower timeframes often precedes significant moves. Traders should remain vigilant for confirmation signals. A daily close above $6,643.4, supported by increasing volume and positive shifts in daily MACD and RSI, would be a strong bullish signal. Conversely, a decisive break below $6,536.2, confirmed by a surge in selling volume and bearish indicator alignment, would solidify the downtrend. Until then, patience and disciplined risk management are the most effective tools for navigating this uncertain market terrain. The market is providing a clear battleground; the question is which side will ultimately prevail.
The current market environment presents significant risks due to conflicting technical signals and geopolitical uncertainty. A 'WATCH_ZONE' approach is recommended. Trading without clear confirmation can lead to substantial losses. Always implement strict risk management protocols, including setting appropriate stop-loss levels and position sizing, especially when trading around key psychological and technical levels like $6,598.10.
Frequently Asked Questions: SP500 Analysis
What happens if SP500 breaks above $6,643.4 resistance?
A decisive move above $6,643.4 on the SP500, supported by strong volume and positive daily indicator shifts, would signal a potential trend reversal. This could open the door for further upside towards the $6,677.73 resistance level, as bulls regain control.
Should I buy SP500 at current levels of $6,598.10 given the mixed signals?
Initiating a buy at $6,598.10 is not recommended without clearer confirmation due to conflicting technical indicators and a strong daily downtrend signal (ADX 45.56). A confirmed break above $6,643.4 or sustained support above $6,536.2 would offer a more favorable risk-reward ratio.
Is the RSI at 51.41 on the 1-hour chart a buy signal for SP500?
An RSI of 51.41 on the 1-hour chart is considered neutral, indicating neither strong overbought nor oversold conditions. While it suggests a slight upward bias in the very short term, it is not a standalone buy signal, especially when contrasted with negative MACD momentum on the same timeframe and the stronger bearish signals on the daily chart.
How will the upcoming PMI data affect SP500 this week?
The recent PMI data showed mixed results, with Services PMI at 52.4 (above forecast) and Manufacturing PMI at 51.1 (below forecast). Stronger-than-expected future economic data could provide a tailwind for the SP500, potentially aiding a move towards resistance levels. Conversely, weaker data could exacerbate the existing bearish trend, pushing the index towards support at $6,536.2.
Track markets in real-time
AI-powered analysis, technical indicators and real-time price data.
Join Our Telegram Channel
Breaking market news, AI analysis and trading signals instantly.
Join Channel