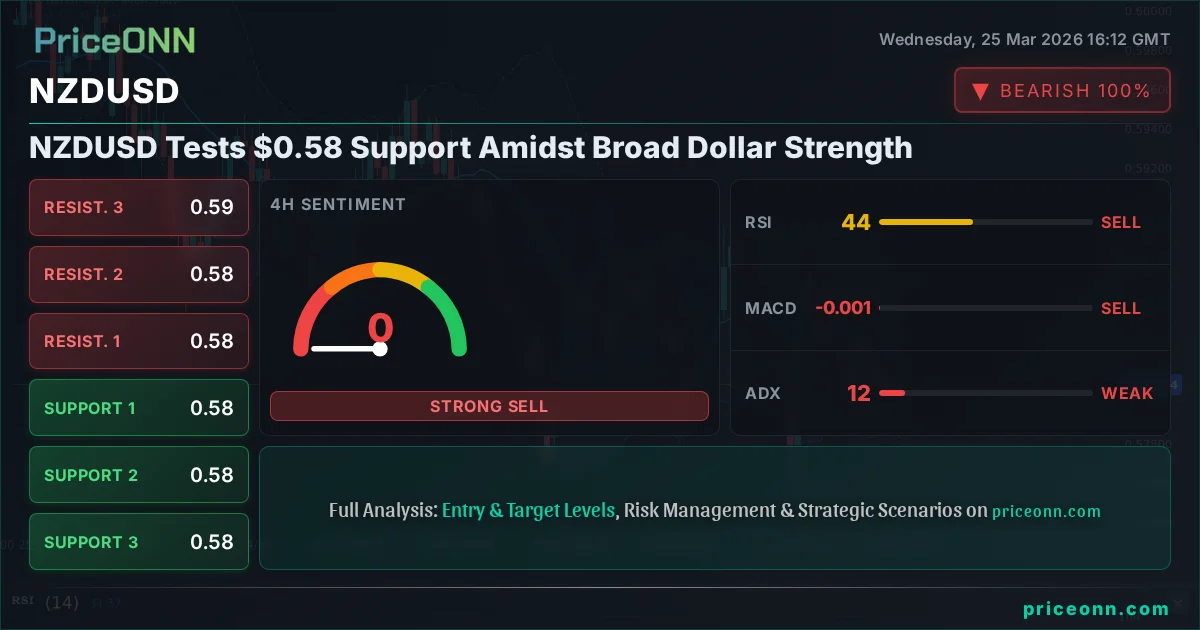
NZDUSD Tests $0.58 Support Amidst Broad Dollar Strength
NZDUSD is probing critical support near $0.57955. With the DXY strengthening and risk sentiment wavering, a breakdown could accelerate losses.
The global economic landscape is currently dominated by a potent combination of rising geopolitical tensions and a resurgent US Dollar, creating a challenging environment for risk-sensitive currencies like the New Zealand Dollar. As the Dollar Index (DXY) pushes higher, currently trading around 99.41, the pressure on pairs like NZDUSD intensifies. This macro backdrop is crucial for understanding the technical picture, where NZDUSD is currently teetering on the edge of a significant support level around $0.57955. A breakdown here could signal a deeper move lower, driven by broader market forces.
- NZDUSD is trading near critical support at $0.57955, with the 4-hour ADX at 11.99 suggesting a choppy market but a potential breakdown if key levels fail.
- The US Dollar Index (DXY) is strong, currently at 99.41, exerting downward pressure on NZDUSD and other risk-sensitive assets.
- Technical indicators on the daily chart show a bearish trend, with RSI at 41.72 and MACD histogram negative, signaling ongoing downward momentum.
- A decisive break below $0.57955 would likely target the next support at $0.57575, while a failure of the DXY rally could offer NZDUSD a reprieve.
The narrative surrounding the New Zealand Dollar is currently one of cautious pessimism, heavily influenced by the persistent strength of the US Dollar and a general risk-off sentiment rippling through global markets. With the DXY currently exhibiting a strong upward trajectory, reaching 99.41, the demand for safe-haven assets is clearly elevated. This dynamic often spells trouble for commodity-linked currencies like the NZD, which tends to perform best when global growth prospects are robust and the US Dollar is subdued. The current market data shows NZDUSD at $0.58109, down significantly from its recent highs, underscoring the impact of these macro headwinds. The Reserve Bank of New Zealand (RBNZ) has also indicated it's weighing economic slack against oil price shocks, suggesting a cautious domestic outlook that does little to support the Kiwi. This interplay between a strong dollar, waning risk appetite, and domestic economic considerations paints a bearish picture for the pair.
Navigating the Technical Landscape: What the Charts Reveal
Delving into the technical indicators for NZDUSD reveals a market at a critical juncture. On the 1-hour chart, the trend is neutral with a power of 50%, but the RSI at 45.19 indicates downward pressure, and the MACD histogram is negative, suggesting bearish momentum is building. The Stochastic oscillator, with K at 31.5 and D at 39.43, supports a bearish outlook as %K is below %D. The ADX at 7.96, however, signals a very weak trend, implying that the current downward move might be part of a broader consolidation rather than a committed trend. This lack of strong trend conviction on the shorter timeframe contrasts with the daily view.
Shifting to the daily timeframe, the picture becomes clearer, and more concerning for the Kiwi bulls. The trend is decisively bearish with a power of 86%, and the ADX at 31.89 confirms a strong downtrend. The RSI(14) is sitting at 41.72, comfortably within the neutral zone but leaning towards oversold territory, indicating room for further decline. The MACD histogram is negative and below the signal line, reinforcing the bearish momentum. Bollinger Bands are positioned below the middle band, a classic sign of downward pressure, with the price hugging the lower band at times. The Stochastic oscillator, with K at 44.21 and D at 38.22, is showing a bullish crossover (%K > %D), which might suggest a short-term bounce is possible, but this is occurring within a strong downtrend, making it a potentially weak signal. The confluence of these daily indicators paints a picture of a market under significant bearish pressure.
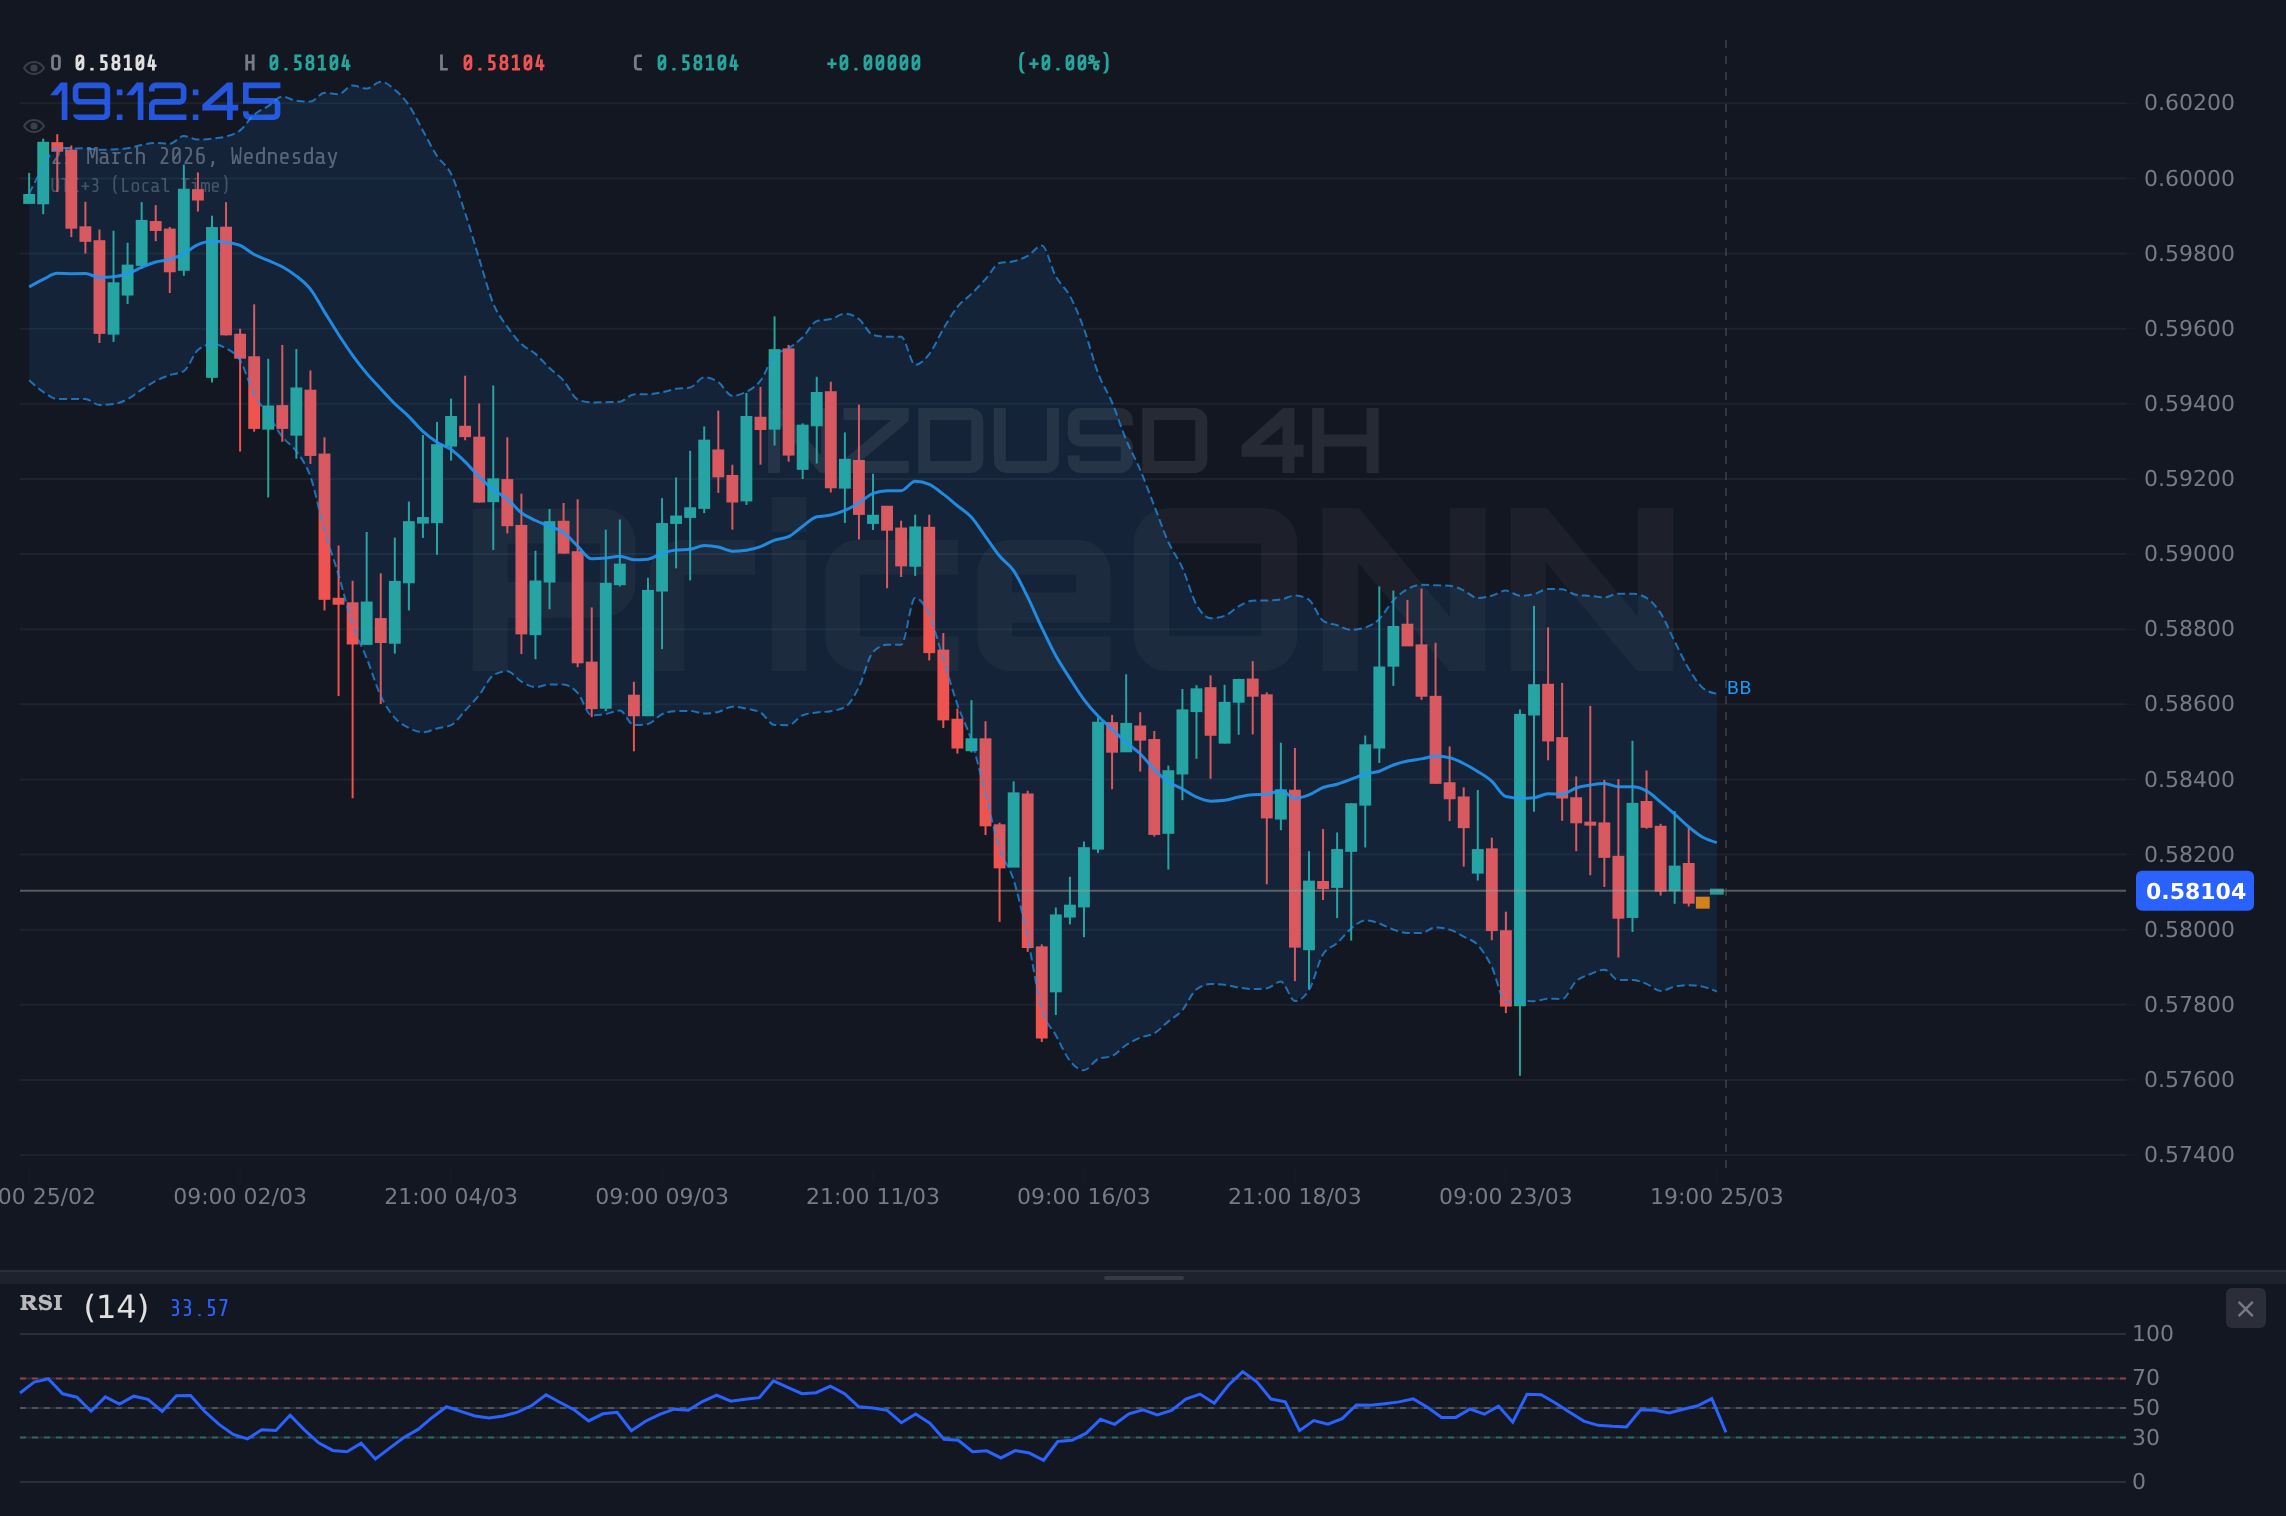
The 4-hour chart offers a more nuanced perspective, often acting as a bridge between short-term fluctuations and the longer-term daily trend. Here, the trend is also assessed as bearish with a power of 91%. The RSI is at 43.98, continuing the bearish narrative, while the MACD histogram is negative, confirming the downward momentum. Bollinger Bands remain below the middle band, indicating bearish pressure. However, the Stochastic oscillator shows K=28.07 and D=36.28, indicating a bearish crossover (%K < %D), which aligns with the broader bearish sentiment, but it is in oversold territory, hinting at potential exhaustion. The ADX at 15.11, similar to the 1-hour chart, suggests a weak trend on this timeframe, implying that while the dominant daily trend is down, the immediate price action might be consolidating before the next significant move. This mixed signal on the 4-hour chart highlights the importance of watching the key support levels closely.
The Critical Juncture: Support at $0.57955
The immediate focus for NZDUSD traders is the support level situated around $0.57955. This is not just an arbitrary number; it represents a significant price point where buying interest has previously emerged, halting further declines. The daily chart data confirms this, listing $0.57955 as the first major support level. A break and sustained close below this price on a daily basis would be a strong bearish signal, potentially triggering a cascade of sell orders as stop-losses are hit and new short positions are initiated. The fact that the ADX on the daily timeframe is at 27.45, indicating a strong downtrend, means that once this support gives way, the downside could be substantial, as there is little to hold back the bearish momentum until the next significant support at $0.57575.
The current price of $0.58109 is precariously close to this critical support. The fact that the DXY is showing strength, currently at 99.41, adds to the downside risk. A stronger dollar typically means less purchasing power for other currencies, and for NZDUSD, this correlation is usually inverse and pronounced. If the DXY continues its upward march, it will exert constant pressure on NZDUSD, making it increasingly difficult for the pair to hold above $0.57955. Traders are watching closely to see if the current dollar strength is a sustained move or a temporary surge. Any indication of a DXY pullback could offer NZDUSD a much-needed reprieve, but until then, the bears have the upper hand.
Correlation Analysis: The Dollar's Dominance
The relationship between NZDUSD and the Dollar Index (DXY) is a cornerstone of forex analysis for this pair. As the DXY strengthens, as it is doing currently with a reading of 99.41 on the 1-hour chart, it typically exerts downward pressure on NZDUSD. This inverse correlation is driven by the fact that a stronger dollar makes New Zealand Dollar-denominated assets relatively more expensive for holders of US Dollars, and vice versa. The market sentiment, currently leaning towards risk-off, further amplifies this effect. Investors tend to flock to the perceived safety of the US Dollar during times of uncertainty, pushing its value up and weakening other currencies.
The current technical setup on the DXY itself is also noteworthy. On the 1-hour timeframe, the DXY shows a positive momentum with RSI at 65.63 and MACD positive, suggesting further upside potential. The Stochastic K=86.76 and D=63.85 indicate an overbought condition, which might suggest a short-term pause or pullback. However, the daily chart of the DXY shows a neutral trend with 50% power, but a strong ADX of 32.08 signals a robust trend when it does move. This suggests that while the dollar might be nearing overbought levels on shorter timeframes, the underlying trend could still support further appreciation, which would be detrimental to NZDUSD. The interplay between these two instruments is paramount for any trader looking to navigate this market.
Beyond the Pair: Broader Market Context
Examining NZDUSD in isolation provides only a partial picture. The broader market context, including movements in major indices like the S&P 500 and Nasdaq, offers vital clues about risk appetite. Currently, the S&P 500 is trading around 6588.65 and the Nasdaq 100 at 24138.98, both showing slight declines on the day, indicating a cautious or risk-averse sentiment. This risk-off environment typically benefits safe-haven assets and puts pressure on currencies like the NZD. In such conditions, capital tends to flow away from perceived riskier assets and into those seen as more stable, like the US Dollar or gold.
Gold prices, currently at $4556.51, are also showing a strong upward move, up 1.84% on the day. This rise in gold, often seen as a safe-haven asset, further confirms the prevailing risk-off sentiment. While gold's upward move might seem contradictory to the DXY's strength, it can occur when both are perceived as safe havens, or when inflation concerns are driving gold prices higher while dollar strength is driven by other factors. For NZDUSD, the combination of a strong DXY and a risk-off environment in equities reinforces the bearish outlook. The fact that oil prices, with Brent at $100.94 and WTI at $90.81, are also climbing, might suggest underlying inflationary pressures, which could complicate central bank decisions but, in the current environment, the dollar's strength seems to be the overriding factor for NZDUSD.
Trade Scenarios: Navigating the Uncertainty
Given the confluence of bearish technical signals and a strong macro-driven US Dollar, the immediate outlook for NZDUSD appears challenging. The critical support at $0.57955 is the key level to watch. A failure to hold this level could trigger a rapid decline, especially with the strong bearish trend indicated by the daily ADX of 27.45.
Bearish Scenario: Breakdown Below Key Support
65% ProbabilityNeutral Scenario: Consolidation Above Support
25% ProbabilityBullish Scenario: Dollar Reversal
10% ProbabilityThe bearish scenario holds the highest probability, given the current macro and technical alignment. A decisive break below $0.57955 would likely see the price accelerate towards the next significant support level at $0.57575. This move would be fueled by continued dollar strength and a further decline in risk appetite. Conversely, if NZDUSD manages to hold above $0.57955, a period of consolidation could ensue. This would likely require a pause or reversal in the DXY's upward momentum. The bullish scenario remains a long shot, dependent on a significant shift in market sentiment or a sharp correction in the US Dollar, which currently appears unlikely given the geopolitical backdrop.
The Path Forward: What Traders Should Watch
For traders and investors monitoring NZDUSD, the immediate future hinges on the price action around the $0.57955 support level. A daily close below this mark would validate the bearish outlook and open the door for further downside, targeting $0.57575 and potentially $0.57224. The strength of the US Dollar, as indicated by the DXY's current level around 99.41, will be a primary driver. Any signs of weakness in the dollar, such as a break below the 1-hour RSI resistance or a sustained push below the 99.00 level on the DXY, could provide a temporary reprieve for NZDUSD, potentially leading to a bounce towards the $0.58300 to $0.58686 resistance zone.
The current technical indicators suggest caution. While the daily chart shows a strong bearish trend (ADX 27.45), the shorter timeframes exhibit some conflicting signals, such as the Stochastic crossover on the daily chart. This suggests that while the overall bias is bearish, the market might be entering a phase of consolidation or experiencing short-term pullbacks before the next major move. Therefore, patience and risk management are paramount. Waiting for confirmation, such as a decisive break of the support or a clear reversal pattern forming, will be crucial for navigating this uncertain environment. The RBNZ's stance on economic slack amidst oil price shocks also adds a layer of fundamental uncertainty that could influence the Kiwi's trajectory.
Frequently Asked Questions: NZDUSD Analysis
What happens if NZDUSD breaks below the $0.57955 support level?
A decisive daily close below $0.57955 would likely trigger further selling pressure, targeting the next support at $0.57575. This scenario is supported by the strong bearish trend on the daily chart, with an ADX of 27.45, and the prevailing strength of the US Dollar Index (DXY) at 99.41.
Should I consider buying NZDUSD at current levels around $0.58109?
Buying at current levels carries significant risk given the bearish technical setup and macro headwinds. A high-probability setup would require a clear break and hold above resistance levels like $0.58686, or a confirmed reversal in the DXY, which is currently unlikely.
Is the RSI at 41.72 on the daily chart a strong sell signal for NZDUSD?
An RSI of 41.72 is not an extreme oversold reading but indicates bearish momentum is present. It suggests room for further downside rather than an immediate buy signal. The MACD histogram is also negative, reinforcing the bearish sentiment on the daily chart.
How will the RBNZ's stance on economic slack affect NZDUSD this week?
The RBNZ's acknowledgement of economic slack amidst oil price shocks suggests a cautious domestic outlook, which generally weighs on the New Zealand Dollar. This fundamental factor adds to the bearish pressure on NZDUSD, reinforcing the technical outlook for a potential move lower.
Track markets in real-time
AI-powered analysis, technical indicators and real-time price data.
Join Our Telegram Channel
Breaking market news, AI analysis and trading signals instantly.
Join Channel