DowJones30 Tests Resistance at $46,477.50: A Breakout in Sight?
DowJones30 hovers near $46,477.50, facing key resistance. With mixed signals from indicators and a strong DXY, the next move hinges on crucial support levels.
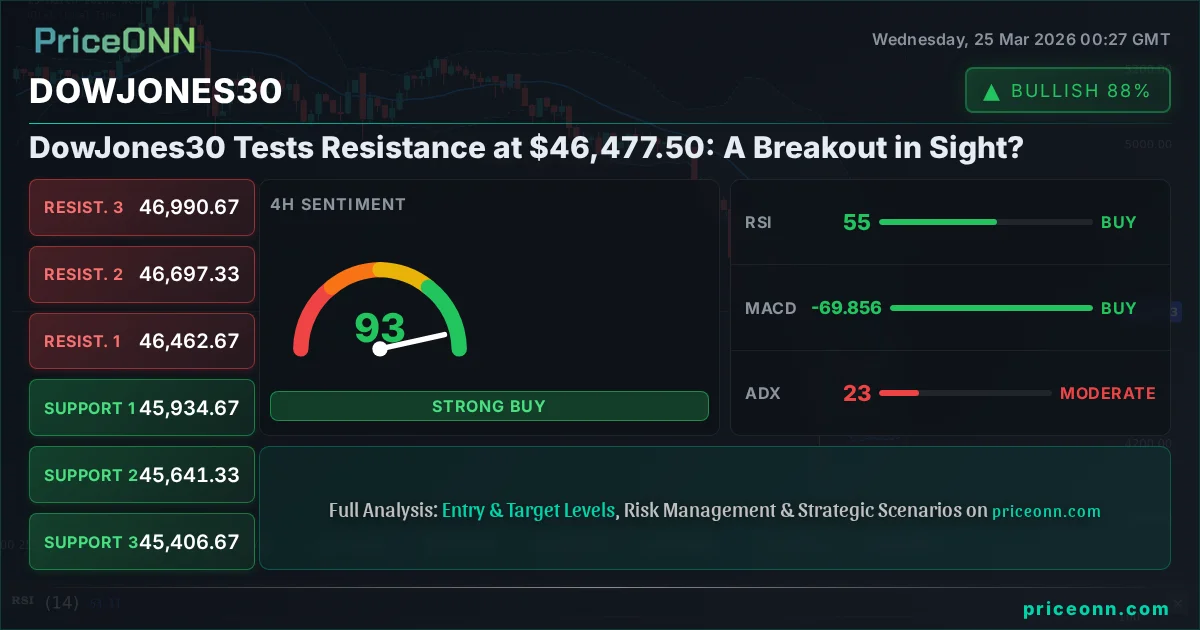
The Dow Jones Industrial Average (DJIA) is currently perched at $46,477.50, a critical juncture where it faces significant resistance. After a period of choppy trading, the index is showing signs of consolidation, but the underlying momentum and correlation with broader market forces suggest that a decisive move may be on the horizon. Understanding the interplay between technical indicators, macroeconomic factors, and geopolitical undercurrents is key to navigating this pivotal moment for the DowJones30.
- The DowJones30 is currently trading at $46,477.50, approaching a significant resistance zone.
- RSI at 61.05 on the 1H chart signals overbought pressure, while the 1D RSI at 37.32 indicates a downtrend.
- Critical resistance is identified at $46,507.33 (R1), with support found at $46,397.33 (S1).
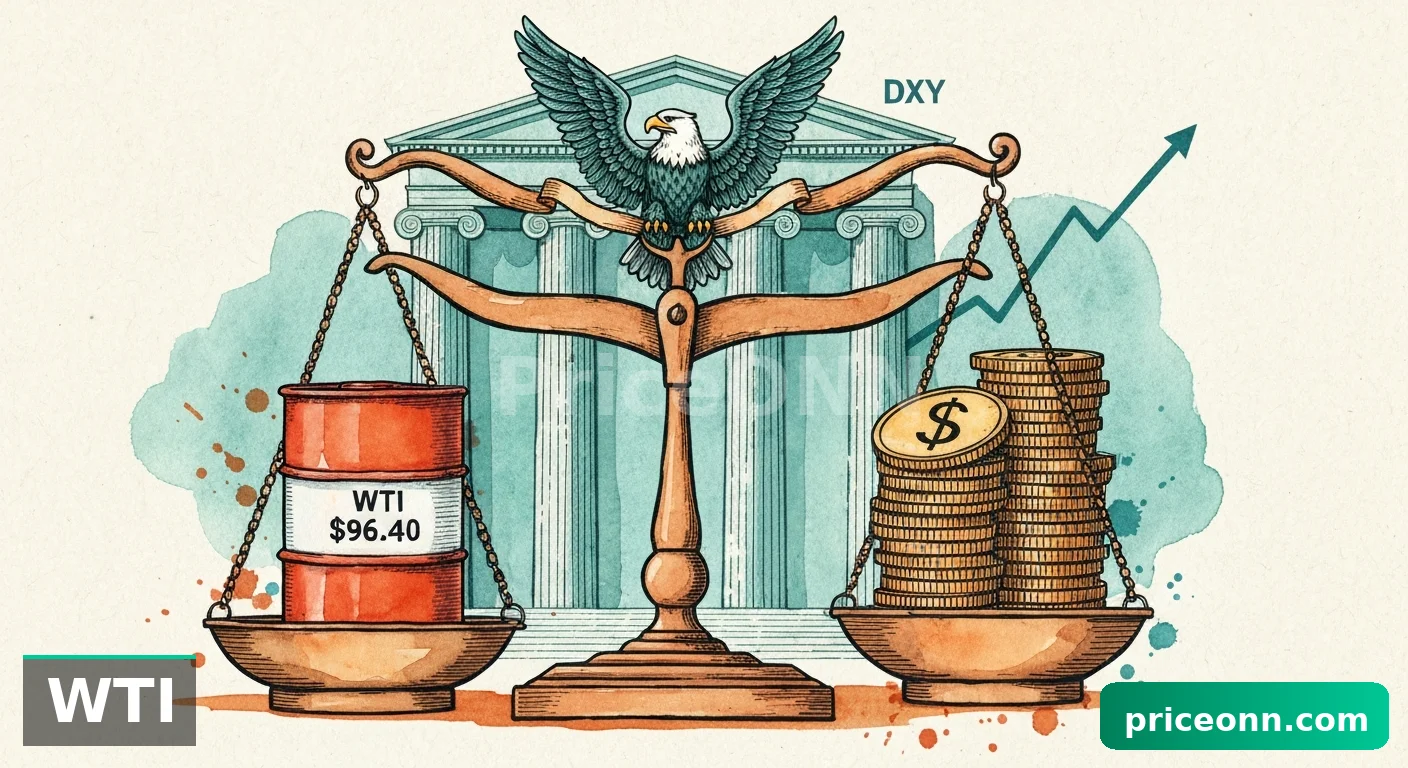
- The strengthening DXY at 98.93 and a positive SP500 at 6605.9 suggest conflicting risk sentiment.
The market sentiment surrounding the DowJones30 is currently a complex tapestry woven with threads of cautious optimism and underlying geopolitical concerns. While the index itself has shown resilience, climbing towards the $46,507.33 resistance level, the broader economic landscape presents a mixed picture. The US Dollar Index (DXY) is currently trading at 98.93, indicating a strengthening dollar which typically puts pressure on riskier assets like equities. This inverse correlation is a crucial factor to monitor as traders assess the Dow's potential trajectory. Furthermore, the S&P 500, a key risk appetite barometer, is trading at 6605.9, showing a modest upward bias, yet the Nasdaq 100 at 24222.5 exhibits a similar tentative strength. This suggests that while technology and broad market indices are not actively selling off, the sustained strength of the dollar could be a headwind.
Delving into the technicals, the 1-hour chart for the DowJones30 presents a picture of upward momentum, with the RSI standing at 61.05, comfortably in neutral territory but leaning towards overbought conditions. The MACD is positioned above its signal line, further reinforcing this bullish short-term bias. Stochastic indicators are also flashing a buy signal, with %K at 80.12 and %D at 74.43, indicating a strong upward trajectory on this timeframe. However, the ADX at 14.61 suggests a weak trend, implying that this upward move might lack conviction and could be susceptible to a swift reversal if key levels fail to hold. This divergence between momentum indicators and trend strength is a classic sign of a market that is consolidating or preparing for a significant shift.
Shifting to the 4-hour timeframe, the narrative becomes more balanced, reflecting the current neutral trend strength (50%) indicated by the ADX at 22.54. Here, the RSI sits at 54.87, still in neutral territory but showing a slight upward inclination. The MACD remains positive, and Stochastic is also giving a buy signal. However, the daily chart paints a different story. With a 100% downtrend strength and the RSI at a subdued 37.32, the longer-term picture suggests that the recent upward push might be a corrective move within a larger bearish trend. The MACD on the daily chart is below its signal line, confirming negative momentum, and Bollinger Bands are trading below the middle band, indicating a bearish bias. This conflict across different timeframes highlights the indecision currently plaguing the market.
Bearish Scenario: Rejection and Retreat
65% ProbabilityNeutral Scenario: Consolidation and Observation
25% ProbabilityBullish Scenario: Resistance Breakout
10% ProbabilityThe geopolitical landscape continues to be a significant driver of market sentiment, and current events underscore the need for caution. Reports of escalating Middle East tensions, with Brent crude futures climbing and WTI experiencing a sharp pullback, highlight the fragility of global stability. While the direct impact on the DowJones30 may not be immediate, such events often trigger broader risk-off sentiment, potentially leading investors to seek safer havens and reducing appetite for equities. The recent news regarding Europe's increasing reliance on US LNG also adds a layer of complexity, potentially influencing trade balances and currency valuations, which in turn can affect global indices. These macro factors create a backdrop of uncertainty that cannot be ignored when assessing the Dow's path forward.
The interplay between the DowJones30 and other major indices provides further context. The S&P 500, currently at 6605.9, and the Nasdaq 100 at 24222.5, are exhibiting a similar struggle for direction, albeit with slightly more positive short-term momentum. This suggests that while the broader US equity market isn't showing outright weakness, it's also not exhibiting strong conviction. The correlation here is key; a sustained downturn in the S&P 500 would likely drag the DowJones30 lower, regardless of its internal technical signals. Conversely, a strong rally in the broader market could provide the impetus needed for the Dow to overcome its immediate resistance.
Examining the DXY's role, its current level of 98.93 is significant. A stronger dollar typically translates to lower commodity prices and can make US exports more expensive, potentially impacting multinational corporations listed on the Dow. If the DXY continues its ascent, it could act as a persistent drag on the index. Conversely, any sign of weakness in the dollar could provide a much-needed tailwind for the DowJones30, especially if it coincides with improving risk appetite globally. The Federal Reserve's monetary policy stance, though not explicitly detailed in the provided economic calendar, remains a paramount factor. Any hints of hawkishness could further strengthen the dollar and tighten financial conditions, posing a risk to equity valuations.
The economic calendar, while sparse on high-impact US events in the immediate window, does show upcoming data releases for other major economies. The anticipated steady CPI in Australia and mixed signals from European economic data (e.g., EUR PMI releases) contribute to the global economic narrative. While these might not directly move the DowJones30 in the short term, they paint a picture of the global economic environment. Traders will be closely watching for any indications of persistent inflation or a significant slowdown, as these could influence global central bank policies and, by extension, risk sentiment towards US equities.
Considering the longer-term trend, the daily ADX reading of 45.34 for the SP500 and 41.67 for the DowJones30 on their respective daily charts points to strong bearish trends. This suggests that the current upward movements might be mere corrections within larger downtrends. The RSI on the daily charts for both the SP500 (39.24) and DowJones30 (37.32) are below 40, reinforcing this bearish sentiment. This longer-term technical picture implies that any bullish conviction needs to be confirmed by a clear shift in trend strength and momentum on the daily charts, which is currently absent.
The immediate price action at $46,477.50 is where the focus lies for short-term traders. The resistance at $46,507.33 is the first hurdle. A failure to overcome this level, especially if accompanied by increasing volume on the sell-side or a rise in the DXY, would likely signal a continuation of the bearish sentiment observed on the daily charts. Support at $46,397.33 and $46,287.33 becomes critical in such a scenario. A break below these levels could trigger a more significant sell-off, potentially targeting the psychological 46,000 mark.
For investors looking at the bigger picture, the current environment demands a balanced approach. While short-term technicals might offer trading opportunities, the underlying macroeconomic and geopolitical risks cannot be overlooked. The strong performance of the DXY and the bearish signals on the daily charts for major indices suggest that caution is warranted. It's a market where discerning between a temporary correction and a genuine trend reversal is paramount. Patience and disciplined risk management will be crucial in navigating these choppy waters.
The question remains: can the DowJones30 muster enough strength to break through the $46,507.33 resistance, or will the prevailing bearish sentiment, amplified by dollar strength and geopolitical tensions, pull it back? The answer likely lies in the confluence of technical confirmations, the direction of the DXY, and any significant shifts in global risk appetite. Until a clear directional signal emerges, characterized by sustained price action above key resistance or a decisive break below established support, traders would be wise to maintain a cautious stance, managing risk diligently and waiting for high-probability setups.
Frequently Asked Questions: DowJones30 Analysis
What happens if DowJones30 fails to break above the $46,507.33 resistance level?
If the DowJones30 fails to decisively break above $46,507.33, it could signal a continuation of the current consolidation or a potential pullback. The immediate support level to watch would be $46,397.33 (S1), followed by $46,287.33 (S2). A break below these levels would likely reinforce the bearish sentiment seen on the daily charts.
Should I buy DowJones30 at current levels near $46,477.50 given the mixed RSI signals (61.05 on 1H vs 37.32 on 1D)?
Buying at current levels requires caution due to conflicting RSI signals. While the 1H RSI at 61.05 suggests short-term bullish momentum, the 1D RSI at 37.32 indicates a longer-term downtrend. A more prudent approach would be to wait for confirmation, such as a sustained break above $46,507.33 with strong volume, or a clear retest and hold of support levels like $46,397.33.
Is the ADX reading of 14.61 on the 1H chart a concern for the current bullish move in DowJones30?
Yes, the ADX at 14.61 on the 1-hour chart is a significant concern for the current bullish move. This reading indicates a weak trend, suggesting that the upward momentum might lack conviction and could be easily reversed. It implies that the market is not strongly committed to the current direction, making it vulnerable to fluctuations and potential pullbacks.
How might the strengthening DXY at 98.93 impact the DowJones30's outlook this week?
A strengthening DXY at 98.93 typically exerts downward pressure on US equities like the DowJones30, as it can signal tighter financial conditions and make US exports more expensive. If the DXY continues to rise, it could act as a significant headwind for the Dow, potentially hindering its ability to break through resistance levels and increasing the likelihood of a pullback.
Track markets in real-time
AI-powered analysis, technical indicators and real-time price data.
Join Our Telegram Channel
Breaking market news, AI analysis and trading signals instantly.
Join Channel