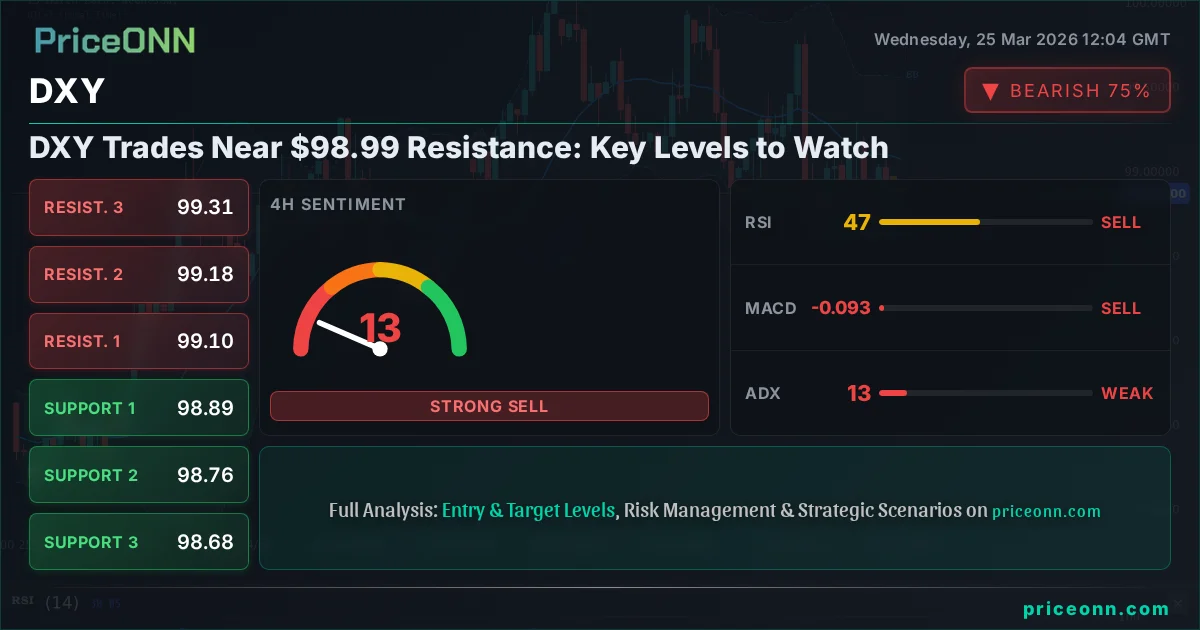
DXY Trades Near $98.99 Resistance: Key Levels to Watch
The US Dollar Index hovers near $98.99 resistance. With mixed signals, a decisive move above this level is crucial for further upside potential.
The US Dollar Index (DXY) is currently navigating a critical juncture, trading precariously close to its resistance zone at $98.99. This pivotal moment demands close attention from traders and investors alike, as the dollar's next move could set the tone for broader market sentiment and influence global currency pairs, commodities, and equity markets. With a complex interplay of technical indicators and macroeconomic undercurrents, the DXY presents a fascinating case study in market dynamics, where a seemingly minor price level holds significant weight for future price action.
- RSI at 50.28 on the 1H chart signals neutral momentum, with a slight upward bias.
- The critical resistance sits at $99.07, a level DXY has tested multiple times this week.
- ADX at 13.16 on the 4H chart indicates a weak trend, suggesting choppy conditions ahead.
- Fed rate expectations continue to influence DXY, with market participants closely watching for any shifts in monetary policy outlook.
The DXY's current position near $98.99 is more than just a price point; it represents a confluence of technical resistance and an uncertain macroeconomic outlook. For weeks, the dollar has been consolidating, creating a tight trading range that hints at an impending breakout. However, the lack of a strong directional trend, as evidenced by the low ADX readings across multiple timeframes, suggests that market participants are hesitant to commit to a significant move. This indecision is often a precursor to volatility, and understanding the triggers for such a move is paramount.
Looking at the 1-hour chart, the DXY shows a tentative upward bias, with the RSI hovering around 50.28. While not yet in overbought territory, this neutral reading, coupled with a positive MACD momentum, suggests that buyers are attempting to gain traction. However, the Stochastic Oscillator's reading of K=58.45 and D=63.98 on the same timeframe presents a conflicting signal, indicating a potential bearish crossover. This divergence highlights the current tug-of-war between bullish and bearish forces, underscoring the importance of the $98.99 level as a battleground.
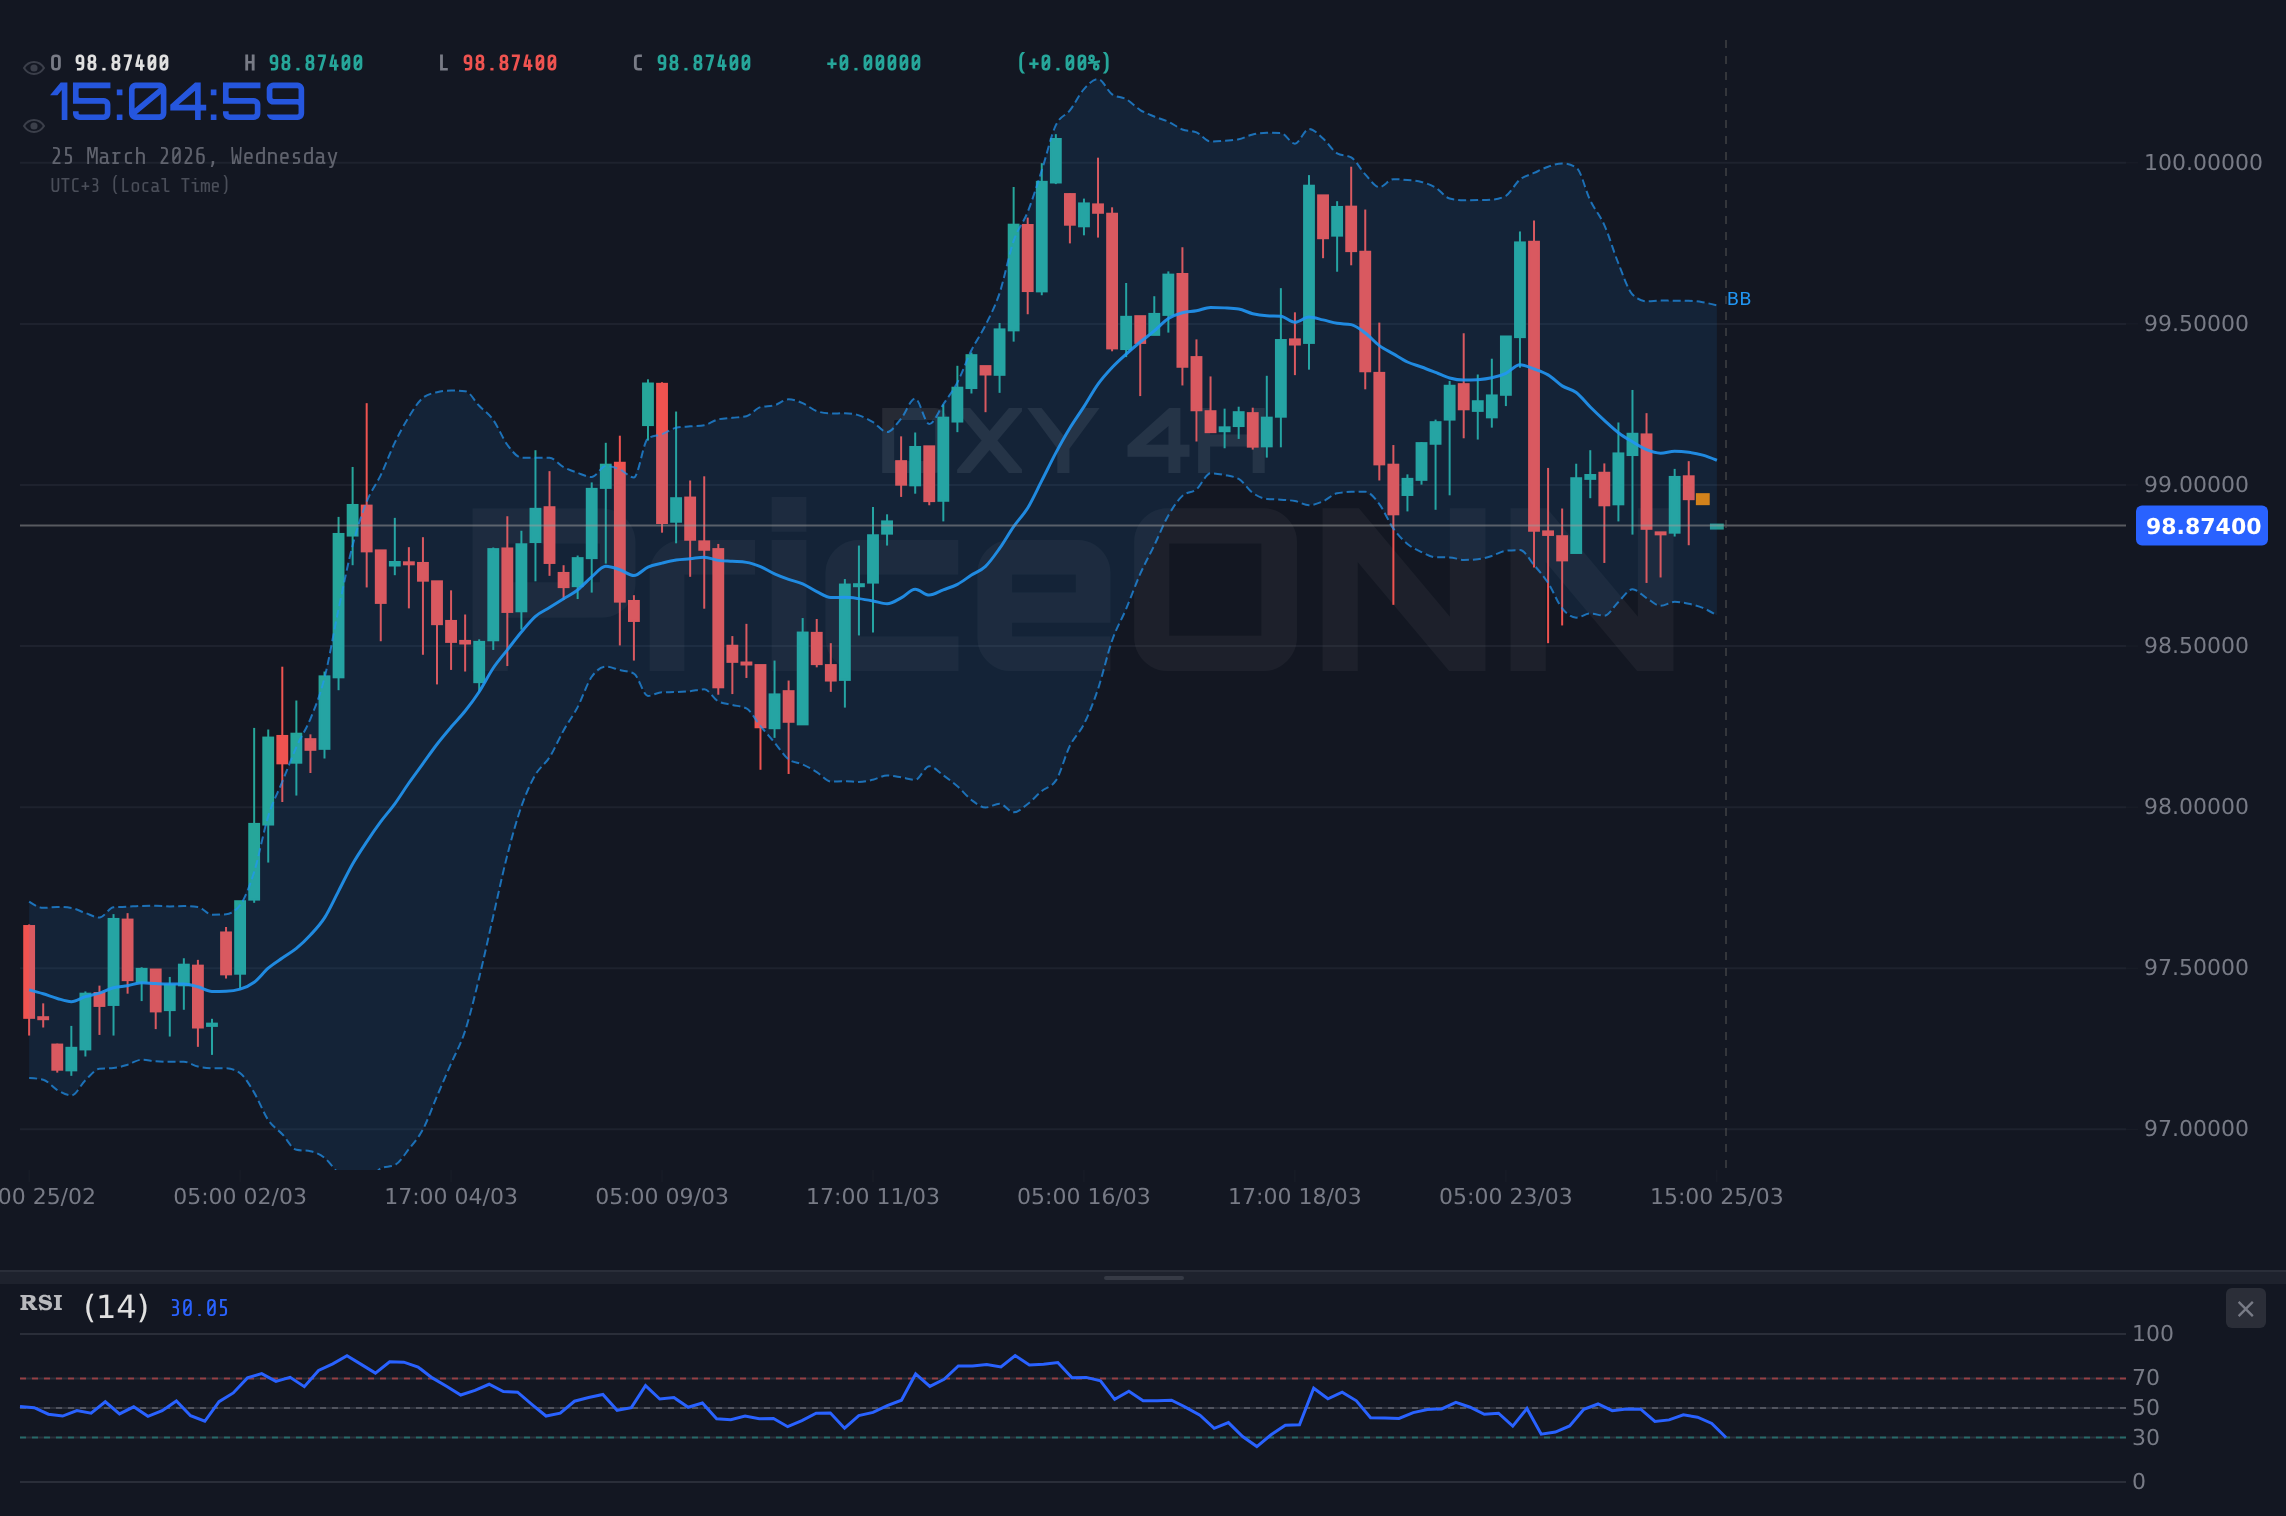
The 4-hour chart paints a more cautious picture. Here, the RSI sits at 46.57, indicating a slight bearish tilt, and the MACD histogram is negative, reinforcing the bearish momentum. The ADX at a mere 13.16 is particularly noteworthy; such a low reading signifies a very weak trend, implying that any upward or downward movement might lack conviction and could be prone to reversal. This choppy environment makes it difficult for traders to establish clear directional bias, and breakout attempts may quickly falter without sustained volume and momentum.
Navigating the $98.99 Hurdle
The immediate price action for the DXY is centered around the 99.00-99.10 area. On the 1-hour chart, resistance is clearly defined at 98.98, 99.02, and 99.05. A sustained break above these levels, particularly a firm close above 99.07, would be a significant bullish signal. This would suggest that the dollar is ready to break out of its recent consolidation and challenge higher price points. The 4-hour resistance levels, which extend to 99.10, 99.18, and 99.31, would then become the next targets for dollar bulls.
Conversely, failure to break higher at the current resistance zone could lead to a pullback. Support levels on the 1-hour chart are located at 98.90, 98.87, and 98.83. A decisive move below these could trigger a test of the 4-hour support levels, starting with 98.89, followed by 98.76 and the more significant 98.68. The daily chart's support at 98.61 presents a more substantial floor, and a break below this level would likely signal a broader bearish reversal for the dollar index.
The daily chart's technical indicators offer a mixed outlook. The RSI at 54.27 is in neutral territory with an upward bias, which could support a bullish breakout. However, the MACD is negative and below its signal line, indicating bearish momentum on the longer timeframe. The ADX at 31.89 suggests a strong trend, but its directionality is currently challenged by the shorter timeframes. This conflict between daily trend strength and shorter-term indecision underscores the importance of the current price action around $98.99.
Intermarket Correlations: What the Charts Are Saying
The DXY's movement is inextricably linked to other major markets, providing valuable context. Gold prices, currently at $4580.07, have shown a strong upward trend on the 1-hour and 4-hour charts, indicating robust demand for safe-haven assets. This could be a sign of underlying market nervousness, potentially capping further upside for the dollar index unless geopolitical tensions escalate significantly or the Federal Reserve signals a more hawkish stance. The strong upward momentum in gold, with its RSI climbing and MACD positive, suggests that investors are seeking stability, which often comes at the expense of dollar strength.
Equity markets, represented by the SP500 at 6624.95 and Nasdaq at 24298.63, are also showing a bullish inclination on shorter timeframes. The SP500's RSI at 62.46 and Nasdaq's at 61.23 suggest a positive risk appetite. Historically, a strong equity market can sometimes weigh on the dollar as investors rotate into riskier assets. However, if the DXY breaks out higher, it could signal a shift in risk sentiment or a divergence driven by specific US economic data or Fed policy expectations. The fact that both indices are showing positive signals on the 1H and 4H charts while the DXY is struggling at resistance creates an interesting dichotomy.
The energy market, with Brent crude at $98.15 and WTI at $87.70, is showing a bearish trend on the 1-hour and 4-hour charts, despite longer-term upward trends. This retreat in oil prices could be interpreted as a sign of easing inflation expectations or a slowdown in global demand, which might indirectly support the dollar by reducing the immediate need for inflation hedges. If oil prices continue to fall, it could remove a key inflationary pressure, potentially influencing the Federal Reserve's monetary policy decisions and, consequently, the DXY's trajectory.
The Federal Reserve and Future Direction
Market participants are keenly awaiting any signals from the Federal Reserve that could clarify the future path of interest rates. While recent economic data has been mixed, the DXY's current trading range suggests that the market is pricing in a period of stability or a gradual shift in Fed policy. The CME FedWatch Tool, if data were available, would be crucial here to gauge the probability of future rate hikes or cuts. In the absence of such specific data, analysts are dissecting every speech from Fed officials for clues. Any indication of a more hawkish stance could propel the DXY above resistance, while dovish comments might lead to a breakdown.
The recent news flow also adds a layer of complexity. Reports of potential US-Iran peace talks, while speculative, could reduce geopolitical risk premiums, potentially leading to a risk-on environment that might see the dollar weaken. Conversely, any escalation in geopolitical tensions, perhaps related to ongoing conflicts or trade disputes, could increase safe-haven demand for the dollar, supporting a move above $98.99. The market's reaction to these geopolitical narratives will be a key driver in the coming days.
Trade Scenarios for DXY
Given the current technical setup and the confluence of mixed signals, the DXY is in a critical watch zone. A clear breakout above the immediate resistance at $98.99 is needed to confirm a bullish continuation, while a decisive close below the support at $98.61 would signal a bearish reversal. The low ADX readings across shorter timeframes suggest that the market is not yet trending strongly in either direction, making it a challenging environment for large directional bets without confirmation.
Bearish Reversal Looming?
60% ProbabilityBullish Breakout Potential
30% ProbabilityConsolidation Continues
10% ProbabilityFrequently Asked Questions: DXY Analysis
What happens if DXY breaks convincingly above the $99.07 resistance level?
A sustained break above $99.07, particularly on the 1-hour chart, would signal a bullish continuation. This could open the door for further upside towards the 4-hour resistance levels at $99.18 and $99.31, suggesting a potential end to the recent consolidation phase.
Should I trade DXY at current levels of $98.99 given the weak ADX at 13.16 on the 4H chart?
Trading at current levels without a confirmed breakout or breakdown is risky due to the weak trend indicated by the ADX. It's advisable to wait for a clear signal, such as a close above $99.07 or below $98.61, to establish a higher-probability trade setup.
Is the RSI at 50.28 on the 1H chart a buy signal for DXY right now?
The RSI at 50.28 indicates neutral momentum, not a strong buy signal. While it shows a slight upward bias, it needs confirmation from other indicators and price action. A clear bullish signal would require RSI to move into overbought territory alongside sustained price action above resistance.
How will the current mixed market sentiment affect DXY this week?
Mixed sentiment, with gold showing strength and equities firming, creates uncertainty for the DXY. If geopolitical risks subside, it could pressure the dollar. However, any hint of hawkishness from the Fed or a shift back to risk aversion could support DXY. Watch for clearer directional cues from economic data or central bank commentary.
📊 Indicator Dashboard
| Indicator | Value | Signal | Interpretation |
|---|---|---|---|
| RSI (14) | 54.27 | Neutral | Neutral territory on daily, with upward bias. |
| MACD Histogram | -0.02 | Bearish | Negative momentum on daily chart. |
| Stochastic | K=26.17, D=50.02 | Bearish | Bearish crossover in oversold zone on daily. |
| ADX | 31.89 | Strong Trend | Indicates a strong trend, but needs directional confirmation. |
| Bollinger | Middle Band | Watch | Price is above middle band on daily, suggesting potential upside. |
Key Levels
Track markets in real-time
AI-powered analysis, technical indicators and real-time price data.
Join Our Telegram Channel
Breaking market news, AI analysis and trading signals instantly.
Join Channel