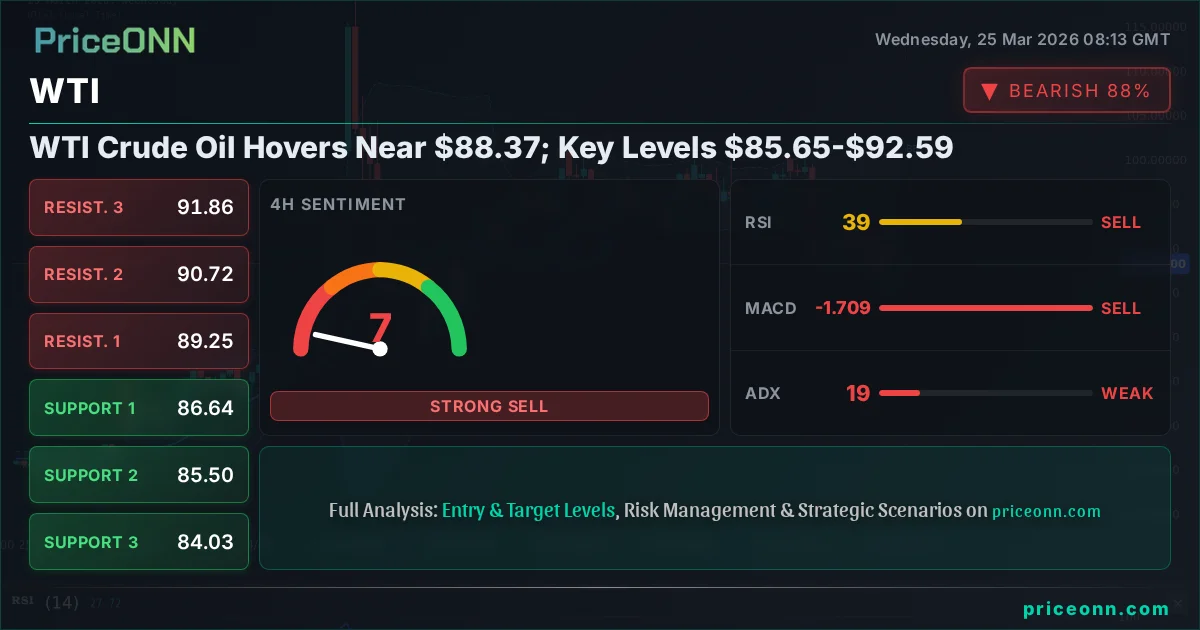
WTI Crude Oil Hovers Near $88.37; Key Levels $85.65-$92.59
WTI Crude Oil is trading around $88.37. Analysts watch support at $85.65 and resistance at $92.59 amidst mixed signals and geopolitical uncertainty. What's next?
As WTI Crude Oil prices navigate the critical $88.37 mark, the market is caught between geopolitical tensions and shifting economic outlooks. The current price action, hovering just below the $89.00 handle, presents a complex picture for traders, with key support at $85.65 and resistance looming at $92.59. This juncture demands a multi-faceted analysis, considering not just the immediate technicals but also the broader macroeconomic currents and the ever-present specter of geopolitical instability that has defined the energy markets for years. The question on every trader's mind is not just where WTI is headed, but what specific conditions need to materialize to confirm a sustainable move in either direction. Today, we delve into the intricate dance of supply, demand, and sentiment shaping the WTI outlook.
- WTI Crude Oil is currently trading at $88.37, showing signs of consolidation after recent volatility.
- Critical support is identified at $85.65, a level that has historically provided a floor during price pullbacks.
- The immediate resistance target to watch is $92.59, a break above which could signal further upside potential.
- The ADX indicator at 18.54 suggests a weak trend, indicating choppy conditions and a potential lack of strong directional conviction in the short term.
The Tug-of-War: Geopolitics vs. Economic Data
The energy landscape is perpetually influenced by a delicate interplay between global supply dynamics and macroeconomic forces. Currently, WTI Crude Oil prices are reflecting this tension. While the immediate price of $88.37 suggests a degree of stability, the underlying currents are far from calm. Geopolitical developments, particularly in regions critical for oil production and transit, continue to be a significant wildcard. Any escalation or de-escalation in these areas can trigger sharp price movements, often overriding more fundamental economic indicators in the short term. For instance, recent news highlighted concerns about Europe's reliance on US LNG, underscoring the complex web of global energy dependencies. This backdrop means that even as we analyze the technical charts, we must remain acutely aware of how global events can rapidly alter the supply-demand equation.
On the economic front, the picture is equally nuanced. Inflationary pressures, often exacerbated by oil price shocks, are a constant concern for central banks worldwide. The Federal Reserve, in particular, is navigating a challenging path, balancing the need to control inflation with the risk of stifling economic growth. Recent data points, such as the US Services PMI showing 51.1 (down from 51.7), hint at slowing economic momentum, which could eventually dampen oil demand. Conversely, if inflation remains stubbornly high, it could necessitate tighter monetary policy, further pressuring economic activity. The correlation between DXY, the US Dollar Index currently at 99.05, and oil prices is also a key factor. A strengthening dollar typically puts downward pressure on dollar-denominated commodities like WTI, as it makes them more expensive for holders of other currencies. This intricate dance between geopolitical risk, economic data, and currency movements creates a volatile environment where clear directional signals are often obscured.
Technical Crossroads: What the Charts Are Saying
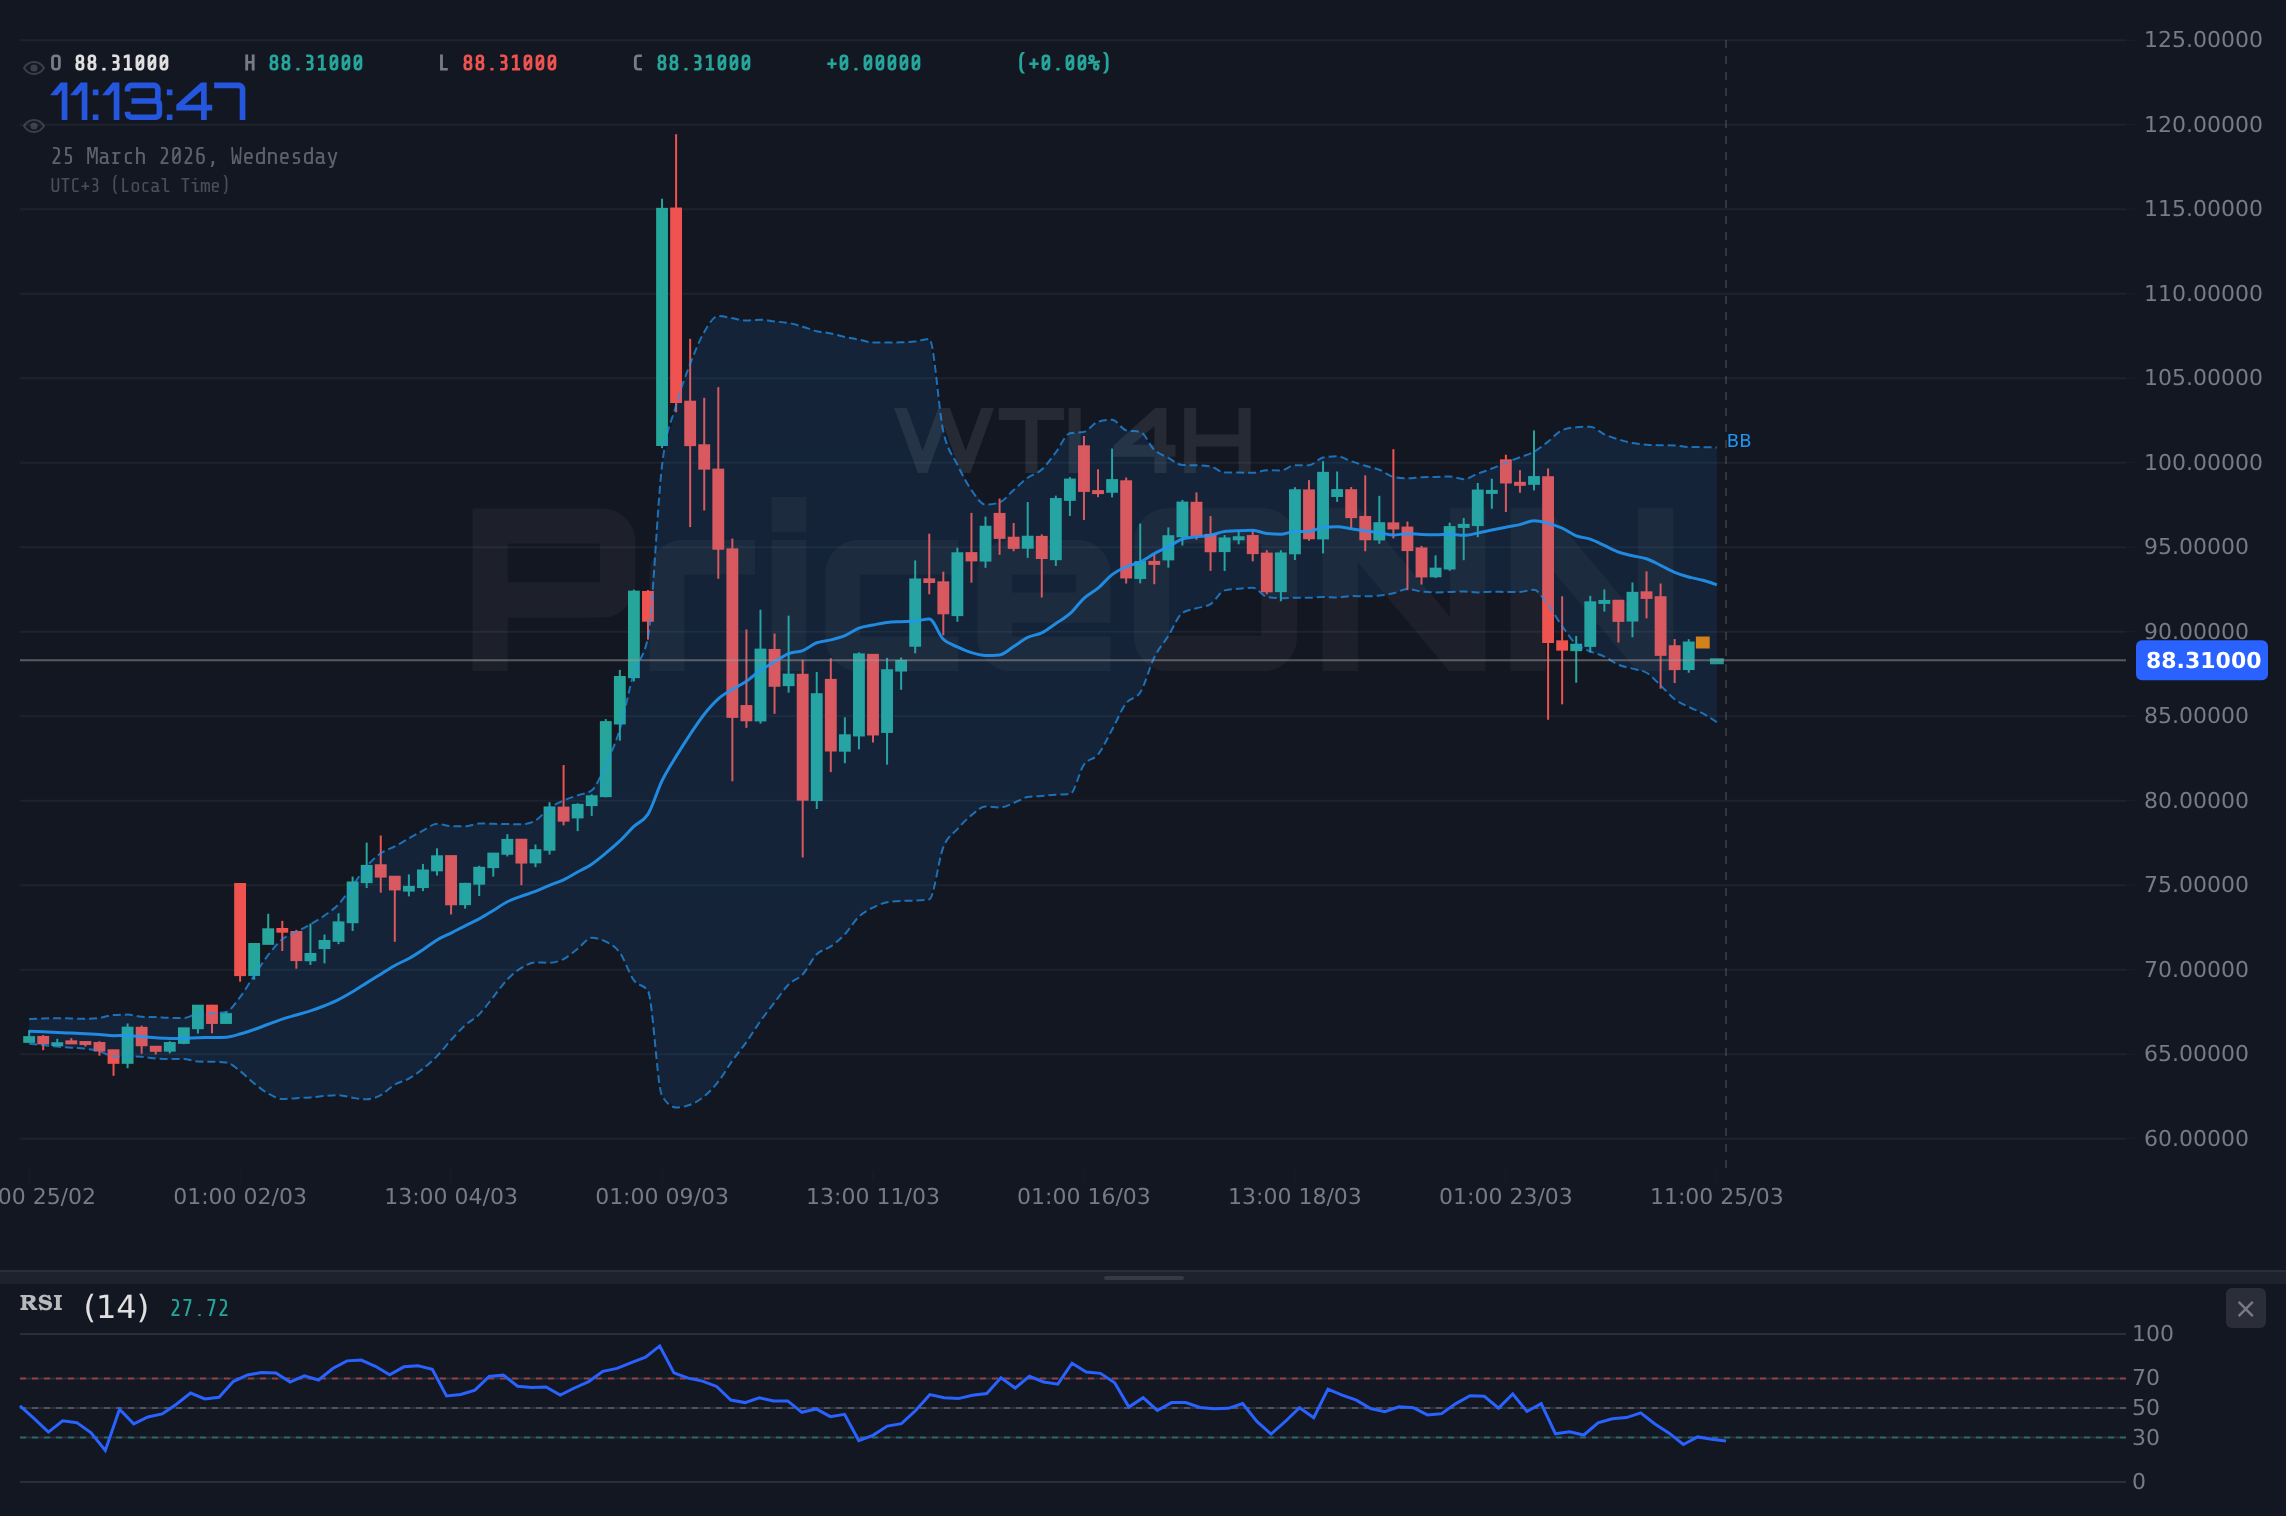
From a technical perspective, WTI Crude Oil is at an interesting juncture. The current price of $88.37 finds itself in a zone where multiple timeframes present conflicting signals. On the 1-hour chart, there’s a generally positive momentum with an AL signal, but the ADX at 16.71 indicates a weak trend, suggesting that any upward moves might lack conviction. The RSI at 39.94 on the 1H chart points towards a bearish inclination, while the Stochastic shows a potential bullish divergence. This mixed bag of indicators highlights the choppiness of the market. The 4-hour chart offers a slightly more bearish tilt, with a SAT signal overall, despite some positive momentum indicators like MACD. The ADX here is also weak at 18.54, reinforcing the idea of a range-bound or consolidating market in the short to medium term. This is precisely the kind of environment where patience is key; waiting for clearer signals before committing capital is often the most prudent approach.
However, the daily chart paints a different, and perhaps more significant, picture. Here, WTI shows a strong bullish trend with a 100% power rating, and the overall signal is AL. The ADX at 57.34 on the daily timeframe signifies a very strong trend, which, if sustained, could lead to significant price appreciation. The RSI is at 56.18, suggesting room for further upside before entering overbought territory. The MACD is showing negative momentum, which is a point of conflict with the overall bullish trend, but the Bollinger Bands are above the middle band, indicating an upward bias. This multi-timeframe divergence is precisely why we are in a 'WATCH_ZONE'. The short-term signals suggest caution and range-bound trading, while the longer-term daily view points towards a potential upward continuation. The critical factor will be how the price reacts to the immediate support and resistance levels. A decisive break above resistance or a firm hold above support could provide the clarity needed to align the shorter timeframes with the daily trend.
The recent news flow also adds a layer of complexity. A Reuters report mentioned that the Fed officials are emphasizing that inflation remains 'stubborn,' which could imply a prolonged period of higher interest rates or a slower pace of rate cuts. This macro backdrop is generally bearish for risk assets and commodities like oil, as higher borrowing costs can dampen economic activity and, consequently, oil demand. However, conflicting news also emerged, with a Bloomberg report indicating that China's central bank is continuing to increase its gold reserves. While not directly oil-related, this signifies a broader trend of central banks seeking to diversify assets amidst global uncertainty, potentially increasing demand for commodities as inflation hedges. The market is thus grappling with both hawkish central bank rhetoric and potential shifts in global reserve management strategies, creating an environment where price action can be erratic.
The Bull's Roadmap: Charting a Path Higher
For the bulls to regain firm control of WTI, several technical and fundamental conditions must align. The immediate priority is to break through the 1-hour resistance at $89.77 and, more importantly, establish a decisive foothold above the $90.00 psychological level. This would not only negate the short-term bearish signals but also set the stage for testing higher resistance levels. A daily close above $90.38 would be a significant bullish confirmation, indicating that the market is looking beyond the current choppy conditions. The next key resistance target lies at $92.59, as provided in the market data. A sustained move above this level, supported by increasing trading volumes and positive shifts in short-term indicators like RSI moving above 60 and MACD histogram turning more positive, could open the door for a more significant rally towards the $95.00 area and potentially higher. The strength of the daily trend, currently indicated by a high ADX of 57.34, would then fully align with the shorter timeframes, suggesting a powerful upward move.
Fundamentally, a bullish scenario would likely be underpinned by a softening of geopolitical tensions in key oil-producing regions, coupled with signals of economic resilience or even acceleration. If upcoming economic data, such as US Non-Farm Payrolls (NFP), comes in significantly stronger than the forecast of 211K, it could boost oil demand expectations. Simultaneously, if central banks begin to signal a pivot towards more accommodative policies, perhaps due to easing inflation concerns, this would also be supportive of oil prices. The correlation with the DXY is also crucial here; a weakening dollar, perhaps driven by a Fed signaling an end to its tightening cycle, would naturally provide tailwinds for WTI. The key here is confluence: a technical breakout confirmed by positive economic data and a supportive currency environment would create a high-probability bullish setup. Until then, any rallies might be met with profit-taking, especially as we approach the $92.59 resistance.
The scenario hinges on the price action decisively clearing the $89.77 to $90.38 range. A successful daily close above $90.38 would be the trigger, suggesting that the underlying strength observed on the daily chart is beginning to permeate the shorter timeframes. Invalidation of this bullish thesis would occur if WTI fails to hold the $88.00 level on a closing basis, indicating a loss of upward momentum and a potential return to the lower end of the current trading range. Target 1 would then be the $90.38 resistance, with Target 2 being the more significant $92.59 level. This bullish outlook, however, requires confirmation; the current market structure, with its weak short-term ADX, suggests that such a move might not be immediate and could face headwinds.
Where Bears Take Control: The Downside Risks
Conversely, a bearish scenario for WTI would likely be triggered by a failure to hold key support levels, coupled with negative fundamental developments. The immediate support level to watch is $85.65, as indicated in the market data. A decisive break below this level on significant volume, especially a close below $85.00 on the daily chart, would invalidate the bullish daily trend and signal a deeper correction. The 4-hour chart, which currently leans bearish with a SAT signal and an ADX of 18.54, would likely gain more traction. This breakdown would open the door to further downside targets, potentially testing the $84.03 and $82.67 levels. The RSI on the 1-hour chart at 39.94 already suggests bearish pressure, and if this trend continues, it could drag the price lower.
Fundamentally, a bearish outlook would be fueled by a significant easing of geopolitical tensions, particularly if diplomatic efforts lead to a de-escalation in the Middle East or a resolution of supply chain issues. This would remove a key risk premium from oil prices. Furthermore, weaker-than-expected economic data from major consuming nations, such as the US or China, could lead to downward revisions in oil demand forecasts. For example, if the upcoming US NFP data significantly misses expectations, or if PMI figures continue to decline across major economies, it would signal a slowdown that could pressure WTI. A strong dollar, driven by hawkish central bank commentary or rising US Treasury yields, would also act as a headwind, making oil more expensive for international buyers and potentially reducing demand. The market's reaction to such news, especially if it leads to a break below $85.65, would be critical in confirming the bearish thesis.
The trigger for a bearish scenario would be a daily close below the $85.65 support level. This would signal a breakdown of the current uptrend and open up further downside potential. Invalidation of this bearish view would occur if WTI manages to hold above $85.65 and subsequently rallies back above $89.00. Target 1 in a bearish scenario would be the $84.03 support, with Target 2 being the more significant $82.67 level. This downside scenario becomes more probable if the short-term technicals, currently showing mixed signals, begin to align with the bearish bias that is subtly present in the 4-hour timeframe. The key is a decisive move below the established support, confirming a shift in market sentiment and fundamentals.
The Waiting Game: Caught in Consolidation
It's also entirely plausible that WTI Crude Oil remains range-bound in the near term, reflecting the conflicting signals from various timeframes and the uncertainty surrounding future economic and geopolitical events. The weak ADX readings across the 1-hour and 4-hour charts (16.71 and 18.54 respectively) strongly suggest a lack of sustained trend, pointing towards consolidation. In this scenario, WTI would likely oscillate between its immediate support at $85.65 and resistance around the $90.00-$92.59 area. Prices might continue to test these levels, leading to 'stop hunts' or liquidity grabs on either side before a more definitive move occurs. This 'waiting game' is often characterized by choppy price action, false breakouts, and a general lack of directional clarity, making it challenging for traders seeking strong trend-following opportunities.
The neutral scenario is essentially the current state of indecision. While the daily chart shows a strong bullish trend, the shorter timeframes are not confirming it, and fundamental catalysts for a sustained rally or decline are not yet dominant. This equilibrium could persist until a significant event - either a geopolitical shock, a major economic data release, or a clear shift in central bank policy - forces a breakout. Until then, traders might find opportunities in shorter-term range-bound strategies, focusing on buying near support and selling near resistance, provided risk management is strictly adhered to. However, the risk in such a scenario is the potential for sharp, unexpected moves that can quickly invalidate range-bound strategies. The key level to watch for a breakout in either direction remains the $92.59 resistance and the $85.65 support. A failure to break these levels would solidify the consolidation thesis, while a decisive move beyond them would signal the end of the waiting game.
Which Scenario is Most Likely?
Given the current technical indicators and the prevailing market sentiment, the most likely immediate scenario for WTI Crude Oil appears to be continued consolidation or a retest of support levels, leaning towards a neutral-to-bearish short-term outlook, while maintaining a bullish bias on the daily chart. The conflicting signals across different timeframes, particularly the weak ADX on the 1-hour and 4-hour charts, suggest that a strong directional move is unlikely without a significant catalyst. The overall signal mix (AL on 1H/4H, SAT on 4H, AL on 1D) reflects this indecision. The probability of a sustained move higher immediately seems lower than the probability of range-bound trading or a pullback towards support. A probability estimate might place the neutral/consolidation scenario around 55%, a bearish scenario targeting support at 60% and a bullish scenario requiring a clear breakout above $90.00 at 35%.
The reason for this assessment lies in the immediate technical picture. While the daily chart is bullish, the lack of confirmation on shorter timeframes, coupled with the prevailing macroeconomic concerns about sticky inflation and potential economic slowdowns, suggests that upward momentum might be capped in the near term. The DXY at 99.05 is also hovering at levels that typically exert some pressure on oil prices. Therefore, the most probable path forward involves WTI trading within the defined range of $85.65 support and $92.59 resistance, with a slight tilt towards testing the lower end of this range before any potential upward continuation. This requires careful observation of how price reacts to the $88.37 current level and the immediate resistance at $89.77. A failure to decisively break higher could see a move back towards $85.65.
The Waiting Game: Range-Bound Action
55% ProbabilityBearish Breakdown: Testing Lower Support
40% ProbabilityBullish Breakout: Rallying Towards $92.59
5% ProbabilityWhat I'm Watching This Week
This week, my focus will be on a few critical triggers that could provide clarity on WTI's next major move. Firstly, I'll be closely monitoring the price action around the $85.65 support level. A failure to hold this level on a daily closing basis would be a significant bearish signal, potentially initiating the downside scenario. Secondly, I'm watching for a decisive close above the $90.38 resistance. This would require strong volume and ideally some positive fundamental news to confirm the bullish thesis suggested by the daily chart. Finally, the US economic calendar is crucial. Key data releases, particularly employment figures like the upcoming NFP (forecast: 211K), will be vital in shaping expectations for Fed policy and, consequently, oil demand. A significant deviation from forecasts could be the catalyst needed to break WTI out of its current consolidation.
The correlation with the DXY (currently 99.05) and broader equity indices like the SP500 (6621.85) will also be under scrutiny. If the dollar strengthens significantly or risk sentiment turns decidedly negative, it could weigh on WTI even if geopolitical factors remain tense. Conversely, a sustained risk-on environment coupled with geopolitical stability could provide room for oil prices to rally towards their resistance levels. The energy market is a complex ecosystem, and staying attuned to these interconnected factors is paramount for navigating the volatility. Remember, patience and disciplined risk management are your greatest allies in such an environment. The market will eventually provide a clearer direction; the key is to wait for the right setup.
Frequently Asked Questions: WTI Crude Oil Analysis
What happens if WTI breaks below $85.65 support?
A daily close below $85.65 would invalidate the current bullish outlook and signal a potential bearish trend continuation. This could lead to further downside testing the $84.03 and $82.67 support levels, especially if accompanied by weak economic data or easing geopolitical tensions.
Is the current RSI at 39.94 a sell signal for WTI Crude Oil right now?
The RSI at 39.94 on the 1-hour chart leans bearish, suggesting some downward pressure. However, on the daily chart, RSI is at 56.18, indicating room for upside. A sustained move below 40 on the daily could be a stronger sell signal, but currently, it's a mixed picture requiring confirmation from other indicators and price action.
How will the upcoming US NFP data affect WTI Crude Oil this week?
The upcoming NFP data, forecast at 211K, is critical. A significantly stronger reading could boost oil demand expectations and support a rally towards $90.38 or higher, especially if it influences Fed policy towards a more hawkish stance. Conversely, a weaker print could dampen demand outlooks and pressure WTI towards $85.65 support.
Should I buy WTI Crude Oil at current levels near $88.37 given the mixed signals?
Buying at current levels near $88.37 carries risk due to conflicting short-term signals and weak trend indicators like ADX at 18.54. A more prudent approach would be to wait for a clear break above $90.38 resistance or a confirmed hold of $85.65 support, aligning with the stronger daily trend signals, before considering a long position.
| Indicator | Value | Signal | Interpretation |
|---|---|---|---|
| RSI (14) | 39.94 | Bearish | Suggests downward pressure on 1H, neutral on 1D. |
| MACD Histogram | -0.52 | Bearish | Negative momentum on 1H/4H, conflicting with daily trend. |
| Stochastic | K=62.64, D=42.58 | Bullish Crossover | Potential for short-term upside from oversold levels. |
| ADX | 18.54 | Weak Trend | Choppy conditions, lacks strong directional conviction on 4H. |
| Bollinger Bands | Middle Band | Watch | Price below middle band on 1H/4H, suggesting bearish bias. |
Track markets in real-time
AI-powered analysis, technical indicators and real-time price data.
Join Our Telegram Channel
Breaking market news, AI analysis and trading signals instantly.
Join Channel