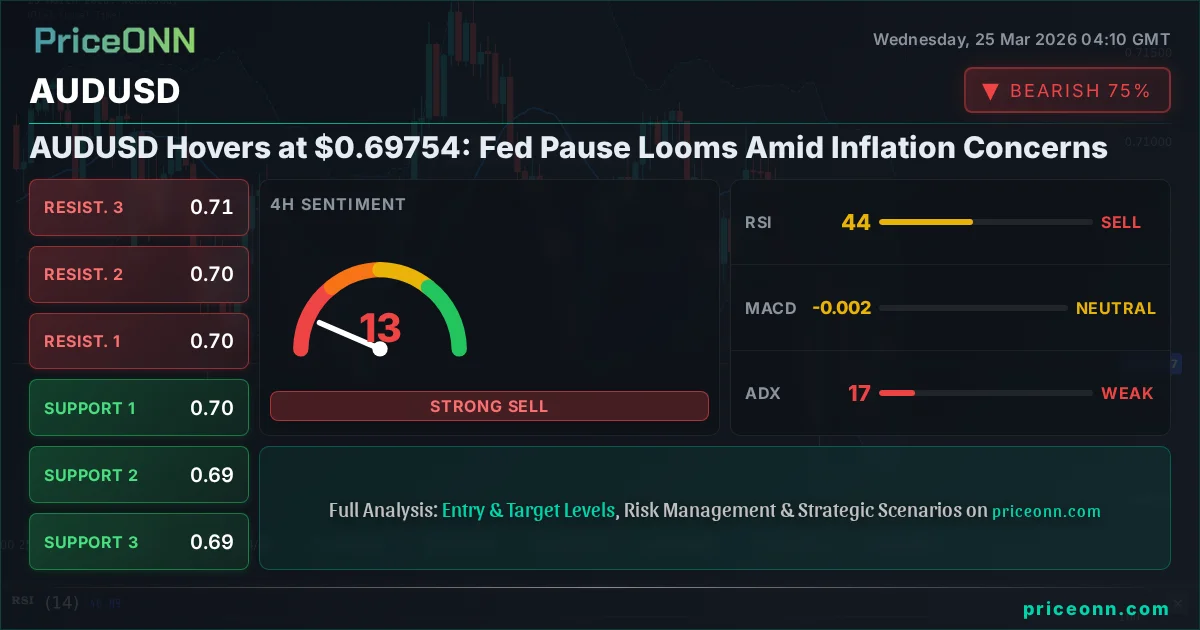
AUDUSD Hovers at $0.69754: Fed Pause Looms Amid Inflation Concerns
AUDUSD trades at $0.69754, testing support as the Fed signals a potential rate pause while inflation remains a key focus. Here's the breakdown.
Is the Australian Dollar poised for a rebound, or will the Federal Reserve's looming rate pause and persistent inflation concerns drag AUDUSD lower? The pair is currently navigating a critical juncture around the $0.69754 mark, a level that technical analysts are watching closely. With the US Dollar Index (DXY) showing signs of firming and global risk sentiment hanging in the balance, understanding the interplay of these factors is paramount for any trader looking to navigate this complex market. This analysis delves into the conflicting signals, the broader market context, and the potential paths forward for AUDUSD, examining both the bullish and bearish arguments with a data-driven approach.
- AUDUSD is trading at $0.69754, near key support levels.
- The Federal Reserve is signaling a potential pause in interest rate hikes due to persistent inflation concerns.
- The US Dollar Index (DXY) shows strength, currently at 99.1, pressuring AUDUSD.
- Technical indicators present mixed signals: RSI at 44.73 on the daily chart suggests bearish momentum, while Stochastic shows a potential reversal signal.
- Upcoming Australian inflation data and Fed commentary are key catalysts.
The Tug-of-War: Bulls vs. Bears at the $0.69754 Line
The AUDUSD currency pair finds itself at a pivotal point, currently trading at $0.69754. This level represents more than just a price point; it's a battleground where opposing market forces are vying for control. On one side, the bulls are looking to capitalize on the Australian Dollar's potential to strengthen, perhaps driven by upcoming domestic economic data or a shift in global risk appetite. On the other side, the bears are betting on the continued strength of the US Dollar, fueled by Federal Reserve policy expectations and global economic uncertainties. The current technical setup, with the daily trend leaning neutral but showing a bearish tendency (Power: 50%), suggests indecision. However, intraday trends on the 1-hour chart show a bullish inclination (Power: 81%), creating a divergence that demands closer inspection. This tension between short-term optimism and longer-term caution is the core narrative driving AUDUSD's price action right now.
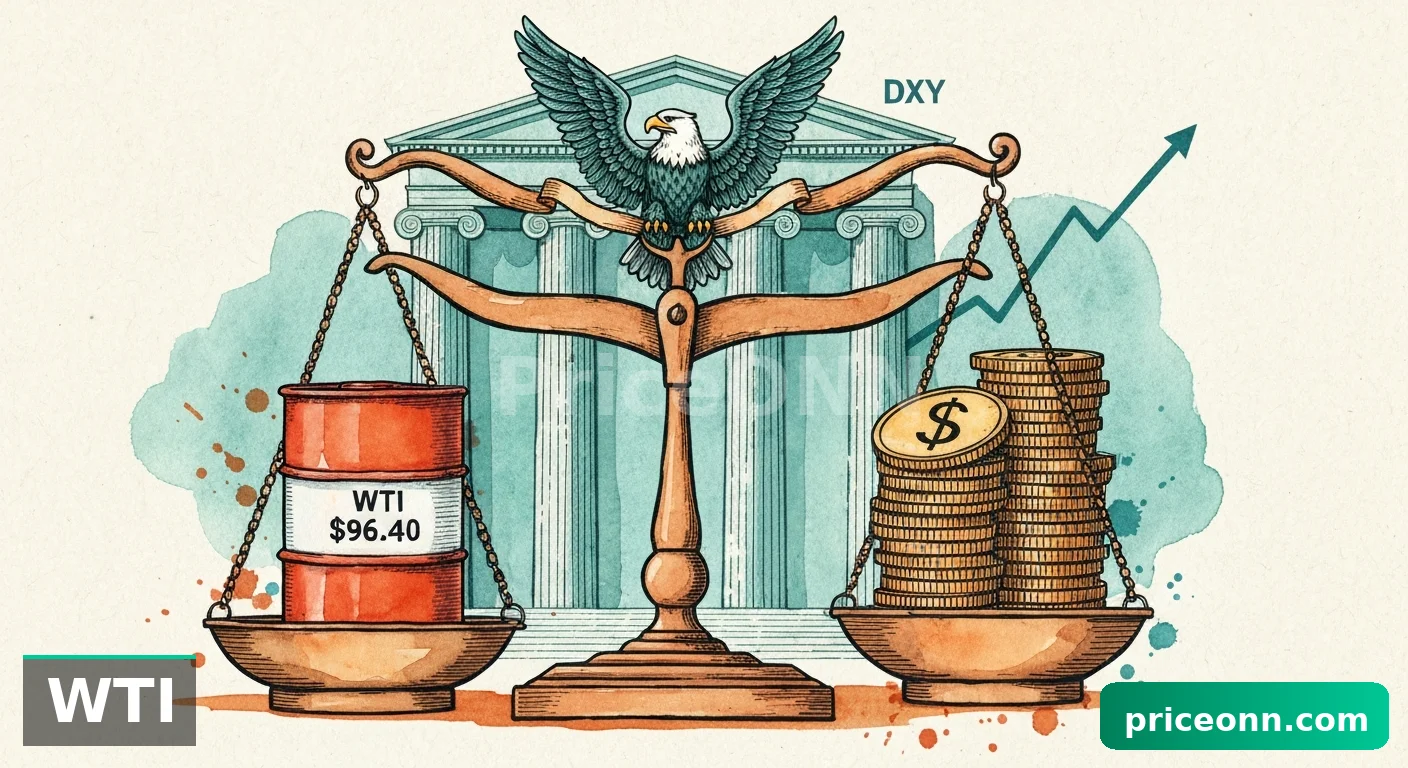
The broader market context adds layers of complexity. The US Dollar Index (DXY) is currently firming around 99.1, according to the latest data. This strengthening dollar typically exerts downward pressure on currency pairs like AUDUSD, as it makes dollar-denominated assets more expensive for holders of other currencies. Furthermore, the recent news suggests that Federal Reserve officials are signaling a prolonged period of holding interest rates steady, a move often interpreted as a sign of economic caution, which can support the dollar. This backdrop creates a challenging environment for the Australian Dollar, which is often sensitive to global growth prospects and commodity prices. The correlation between DXY and AUDUSD is typically inverse; as DXY climbs, AUDUSD tends to fall, and vice versa. With DXY showing upward momentum, the bears have a fundamental tailwind.
Navigating the DXY's Influence
The DXY's current position at 99.1 is a significant reference point. Historically, levels around this mark often coincide with shifts in risk sentiment. A firming DXY can signal a 'risk-off' environment, where investors flock to the perceived safety of the US dollar, pulling capital away from riskier assets and currencies like the Australian Dollar. The data from the 1-hour chart for DXY shows a neutral trend with a bullish bias (Power: 50%), while the 4-hour chart indicates a neutral trend with a bearish bias (Power: 50%). This slight divergence suggests that while the immediate pressure might be upward, the longer-term direction is less certain. However, the daily chart for DXY shows a neutral trend with a bullish bias (Power: 50%), reinforcing the idea that the dollar is not yet decisively weakening. This persistent strength in the dollar is a key hurdle for any potential AUDUSD rally.
The Bull Case: Reasons for Optimism
Despite the headwinds from a strengthening dollar and cautious Fed signals, there are arguments to be made for a bullish outlook on AUDUSD. The Australian Dollar's fate is intrinsically linked to commodity prices and China's economic health, and recent data, though mixed, offers glimmers of hope. Furthermore, the technical indicators, particularly on shorter timeframes, present a more constructive picture. On the 1-hour chart, AUDUSD exhibits a strong bullish trend (Power: 81%), with the RSI at 53.62 indicating room for upward movement without immediate overbought conditions. The MACD is also showing positive momentum, with the MACD line above the signal line, suggesting that buying pressure is building. The Stochastic Oscillator, while showing a slight divergence with %K at 58.7 and %D at 74.85, still indicates potential for further gains before reaching extreme overbought territory. This intraday strength suggests that traders are willing to bid the pair up, perhaps anticipating positive outcomes from upcoming economic events or a shift in global risk sentiment.
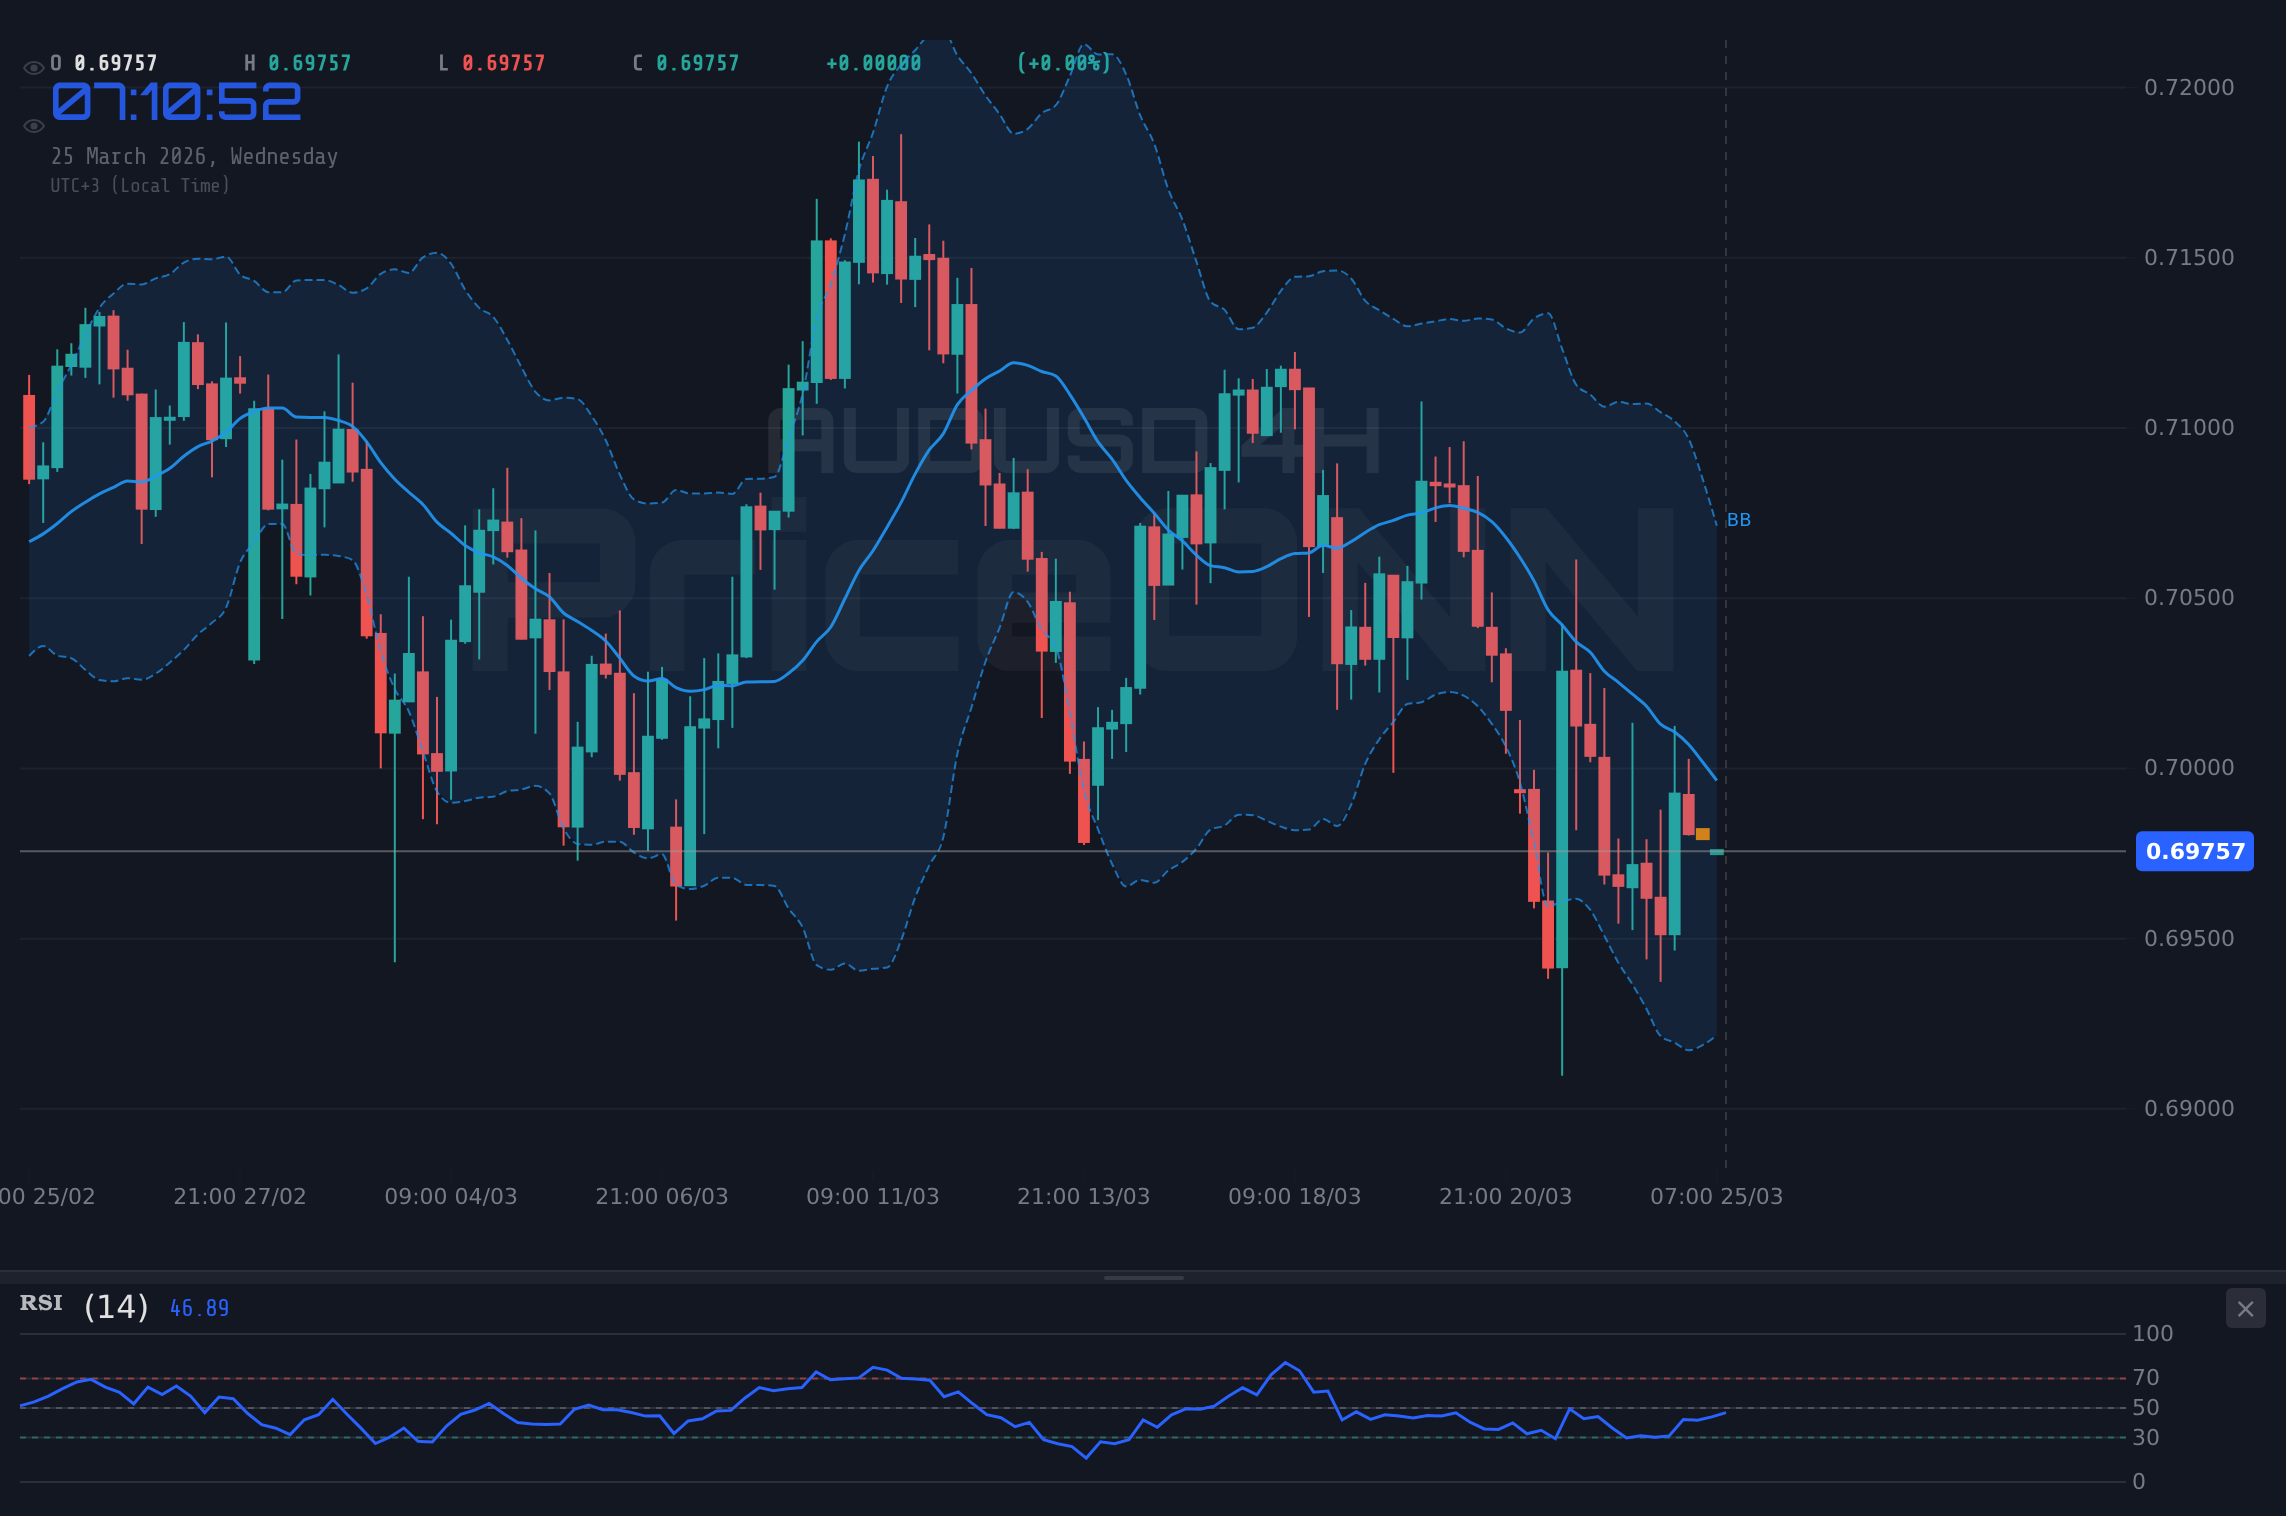
Looking deeper into the 4-hour chart, the trend is also identified as bullish (Power: 83%), with the RSI at 59.7, still comfortably within the neutral zone and pointing higher. This reinforces the idea that short to medium-term traders might be finding value at these levels. The ADX on the 4-hour chart at 16.38 indicates a weak trend, which might suggest that the current upward move lacks strong conviction, but it also means that there isn't a powerful bearish trend to immediately counter it. The Stochastic on this timeframe (K=68.52, D=66.7) further supports a bullish bias, with %K crossing above %D, signaling potential upward momentum. This confluence of bullish signals on the 1-hour and 4-hour charts suggests that, at least in the short term, buyers are more active than sellers, providing a foundation for a potential recovery from the current $0.69754 level.
Australia's Economic Compass
The upcoming Australian inflation data for February is a critical event that could significantly influence the AUDUSD's trajectory. Forecasts suggest the year-over-year CPI will hold steady at 3.8%. While this is still above the Reserve Bank of Australia's (RBA) target band of 2-3%, any deviation from this forecast, particularly a hotter-than-expected reading, could reignite bets on RBA rate hikes. Such speculation would provide a strong fundamental tailwind for the Australian Dollar. Conversely, a softer print could reinforce the market's expectation that the RBA is done with its tightening cycle, potentially putting pressure on the AUD. The news also highlighted that China's green energy stocks have seen a significant surge, with key indices climbing as much as 6% this month. While not directly tied to AUDUSD, a strong performance in China, Australia's largest trading partner, can often translate into improved sentiment for the Australian Dollar, especially if it signals robust economic activity.
The Bear Case: Factors Weighing on the Aussie
On the flip side, the bearish argument for AUDUSD is compelling, primarily anchored by the Federal Reserve's policy stance and the broader strength of the US Dollar. The latest market data shows the DXY at 99.1, and the daily chart for AUDUSD itself paints a somewhat grim picture. The dominant trend on the daily timeframe is a strong downtrend (Power: 94%). The RSI(14) at 36.62 is firmly in the neutral-to-bearish territory, suggesting that selling pressure is more prevalent than buying pressure on a longer timeframe. The MACD is below its signal line, indicating negative momentum, and prices are trading below the middle Bollinger Band, reinforcing the bearish sentiment. This daily technical picture suggests that any short-term rallies might be opportunities for sellers to re-enter the market at better prices.
Adding to the bearish narrative is the ongoing global economic uncertainty and geopolitical tensions. While oil prices experienced a sharp decline recently, as noted in market news, this can sometimes be a double-edged sword for commodity currencies. A broad-based 'risk-off' sentiment, often accompanied by a strengthening dollar, can overshadow the positive impact of individual commodity price movements. The news that Europe's energy security is increasingly reliant on US LNG highlights the complex geopolitical landscape, which can lead to sudden shifts in market sentiment. In such an environment, the US Dollar often benefits as a safe-haven asset, further pressuring pairs like AUDUSD. The breakdown in oil prices, although sharp, is also being watched closely; a sustained drop could signal weakening global demand, a negative for commodity-linked currencies like the Australian Dollar.
The Fed's Shadow and Inflation's Grip
The Federal Reserve's signaling of a prolonged rate pause is a significant factor. While this might seem like a reason for the Fed to cut rates, the underlying reason is often persistent inflation. Fed officials are indicating that rates will remain unchanged as inflation continues to stay above their target. This suggests that while the pace of tightening might be over, the 'higher for longer' narrative for interest rates remains in play. This environment generally supports the US Dollar, as higher interest rates, even if stable, offer attractive yields compared to many other developed nations. The US dollar gaining traction around 99.50 as noted in market updates, further corroborates this view. For AUDUSD, this means that the potential for a significant bullish move might be capped unless the RBA signals a more hawkish stance than the Fed, or if global risk appetite dramatically improves.
The technical indicators on the daily timeframe present a clear bearish bias. The ADX at 27.45 indicates a strong downtrend, suggesting that the current price action is not merely a temporary fluctuation but part of a more established downward move. The Stochastic Oscillator, while showing a potential bullish crossover (%K at 35.78 crossing above %D at 17.48), is still in oversold territory, meaning this bullish signal needs strong confirmation before it can be considered reliable. The combination of a bearish daily trend, cautious Fed policy, and a strong dollar creates a challenging technical landscape for AUDUSD, suggesting that the path of least resistance might still be to the downside, despite the intraday bullish signals.
Technical Crossroads: Indicators Speak
The technical picture for AUDUSD is a complex tapestry of conflicting signals across different timeframes. On the 1-hour chart, the trend is bullish (Power: 81%), with RSI at 53.62 and MACD showing positive momentum. However, the Stochastic %K (58.7) is above %D (74.85), a bearish signal in this context, though not in extreme territory. This suggests short-term traders are stepping in, but the momentum might not be sustainable. The ADX at 22.1 indicates a moderately strong trend, but the direction is less clear when considering the mixed signals.
The 4-hour chart offers a slightly more optimistic view for the bulls, with a bullish trend (Power: 83%), RSI at 59.7, and a bullish Stochastic crossover. Yet, the ADX here is high at 43.58, indicating a strong trend, but the signal is mixed due to the conflicting Stochastic reading. This suggests that while there's potential for upward movement, the trend's conviction is debatable. The daily chart, however, paints a more bearish canvas. The downtrend is strong (Power: 94%), RSI is at 36.62, and MACD momentum is negative. The Stochastic's bullish crossover here is occurring in oversold territory, a classic reversal signal but one that requires significant confirmation. The ADX at 27.45 confirms a strong downtrend. This divergence is key: shorter timeframes show potential for a bounce, while the daily chart warns of further declines.
Intermarket Dynamics at Play
The interplay between AUDUSD, DXY, and commodities like oil is crucial. As mentioned, DXY at 99.1 is a headwind for AUDUSD. The recent sharp decline in oil prices, while concerning for global demand, also impacts commodity currencies. If oil prices stabilize or rebound, it could offer some support to the Australian Dollar. However, the broader 'risk-off' sentiment, which often accompanies dollar strength, can negate these commodity-driven gains. The news about China's economic activity, particularly in green energy stocks, provides a counterpoint, suggesting pockets of growth that could indirectly benefit the Australian economy and its currency. The market is essentially weighing the Fed's hawkish undertones and dollar strength against potential domestic positives for Australia and global commodity price movements.
Scenario Analysis: Paths Forward for AUDUSD
Bearish Descent: Testing Lower Ground
65% ProbabilityRange-Bound Consolidation: Awaiting Clarity
25% ProbabilityBullish Rebound: Catching the Upswing
10% ProbabilityThe Verdict: Caution Prevails
Weighing the evidence, the scales tip towards caution for AUDUSD. The dominant bearish trend on the daily chart, coupled with a firming US Dollar and the Federal Reserve's hawkish undertones regarding inflation, presents significant headwinds. While intraday charts offer some hope for a short-term bounce, the risk-reward profile currently favors the downside. The upcoming Australian inflation data and any fresh commentary from the Fed will be crucial in determining the next major move. For now, the most probable scenario involves further consolidation or a test of lower support levels. Traders should remain vigilant, manage risk diligently, and await clearer signals before committing to significant positions. The market is sending mixed messages, and patience will likely be rewarded.
Frequently Asked Questions: AUDUSD Analysis
What happens if AUDUSD breaks below the $0.69454 support level?
A break below $0.69454 would invalidate any immediate bullish hopes and likely trigger a sell-off towards the next support at $0.68982. This scenario becomes more probable if DXY continues to strengthen or if Australian inflation data disappoints.
Should I consider buying AUDUSD at current levels around $0.69754 given the mixed signals?
Entering long positions at $0.69754 is currently a high-risk proposition given the bearish daily trend and DXY strength. A more prudent approach would be to wait for a confirmed break above resistance at $0.70317 or a clear bullish reversal signal on the daily chart.
Is the RSI at 44.73 on the daily chart a sell signal for AUDUSD?
An RSI reading of 44.73 is in the neutral-to-bearish zone, indicating that sellers have more control than buyers on a longer timeframe. While not an immediate sell signal on its own, it reinforces the bearish outlook and suggests that upside potential is limited without further confirmation.
How might upcoming US inflation data impact AUDUSD this week?
Higher-than-expected US inflation would likely embolden the Fed to maintain its hawkish stance or pause rate hikes for longer, supporting the USD and pushing AUDUSD lower. Conversely, softer inflation could lead to a dollar pullback and a potential relief rally for AUDUSD.
The market is a dynamic interplay of forces, and while current signals suggest caution, opportunities always arise from volatility. Adhering to a disciplined trading plan, managing risk effectively, and waiting for high-probability setups are the keys to navigating these choppy waters. Remember, the market always provides another chance; the crucial aspect is to be prepared when the right moment arrives.
Track markets in real-time
AI-powered analysis, technical indicators and real-time price data.
Join Our Telegram Channel
Breaking market news, AI analysis and trading signals instantly.
Join Channel