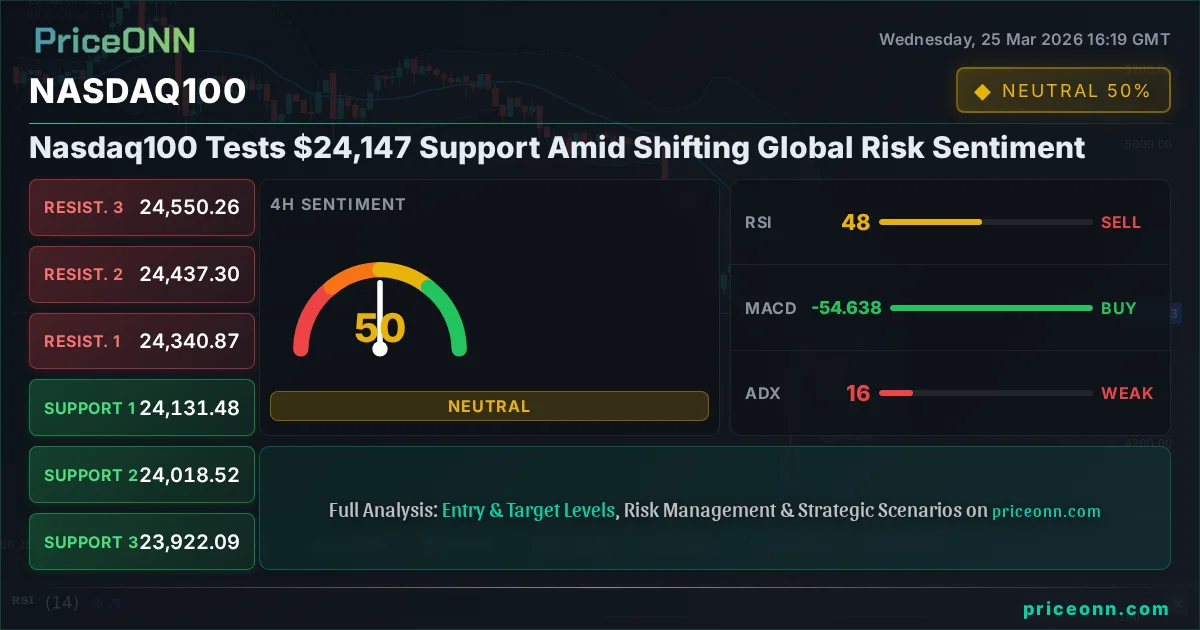
Nasdaq100 Tests $24,147 Support Amid Shifting Global Risk Sentiment
Nasdaq100 hovers around $24,147.24. With the DXY strengthening and geopolitical jitters rising, technical indicators show mixed signals, demanding caution.
The global economic landscape is currently a complex tapestry of conflicting signals. While some indicators point towards resilience, a palpable undercurrent of geopolitical tension and shifting central bank expectations is creating a more challenging environment for risk assets. This is precisely the backdrop against which the Nasdaq100, currently trading at $24,147.24, is navigating its next move. The question on many traders' minds is whether current support levels can hold, or if broader market anxieties will force a deeper correction. Understanding this interplay between macro forces and technical positioning is crucial for deciphering the Nasdaq100's immediate future.
- Nasdaq100 is currently testing support near $23,963, with the price at $24,147.24 showing signs of consolidation.
- The Dollar Index (DXY) is firming, trading around 99.37, which typically exerts downward pressure on tech-heavy indices like the Nasdaq100.
- Geopolitical risks are rising, with concerns about Middle East tensions and their potential impact on oil prices and inflation.
- Technical indicators present a mixed picture: the 1-hour chart shows a potential buy signal, while the 4-hour and daily charts lean towards caution or sell signals, indicating choppiness.
Navigating the Macro Crosscurrents
The 1-hour technical signals for the Nasdaq100 suggest a potential for a bounce, with a 'Buy' consensus among some indicators. However, this is where a deeper dive into the broader market context becomes paramount. The Dollar Index (DXY) is currently trading at 99.37, showing a significant daily gain of 0.51%. Historically, a strengthening dollar often correlates with pressure on major equity indices, particularly those with substantial international revenue streams like the Nasdaq100 components. This dynamic suggests that any bullish technical signals on the Nasdaq100 might face headwinds from a firmer greenback, especially if this trend persists.
Furthermore, the latest economic data releases paint a complex picture. While some figures, like the US ISM Manufacturing PMI at 52.4 (above forecast), suggest underlying economic strength, others hint at potential inflationary pressures or labor market shifts. For instance, the subdued US Nonfarm Payrolls forecast for the upcoming period, coupled with recent geopolitical events, adds a layer of uncertainty. The escalating Middle East tensions, as reported by various news outlets, are not only a geopolitical concern but also a direct threat to energy markets. Brent crude is trading near $100.69, and WTI at $90.63, both showing upward momentum. Higher energy prices can feed into inflation expectations, potentially influencing central bank policy and, consequently, market sentiment towards risk assets like the Nasdaq100.
The correlation between risk appetite and major indices like the S&P 500 and Nasdaq100 cannot be overstated. The S&P 500 is currently trading around 6590.45, showing a slight daily decline. This cautiousness in the broader market mirrors the sentiment seen in other risk assets. When indices like the S&P 500 show signs of weakness, it often signals a 'risk-off' environment, where investors tend to move away from growth-oriented stocks and towards safer havens. This observed correlation is a critical factor to consider when evaluating the Nasdaq100's trajectory. The slight dip in the S&P 500, despite some positive individual data points, suggests that overarching concerns are beginning to weigh on market participants.
Technical Signals: A Divergent View
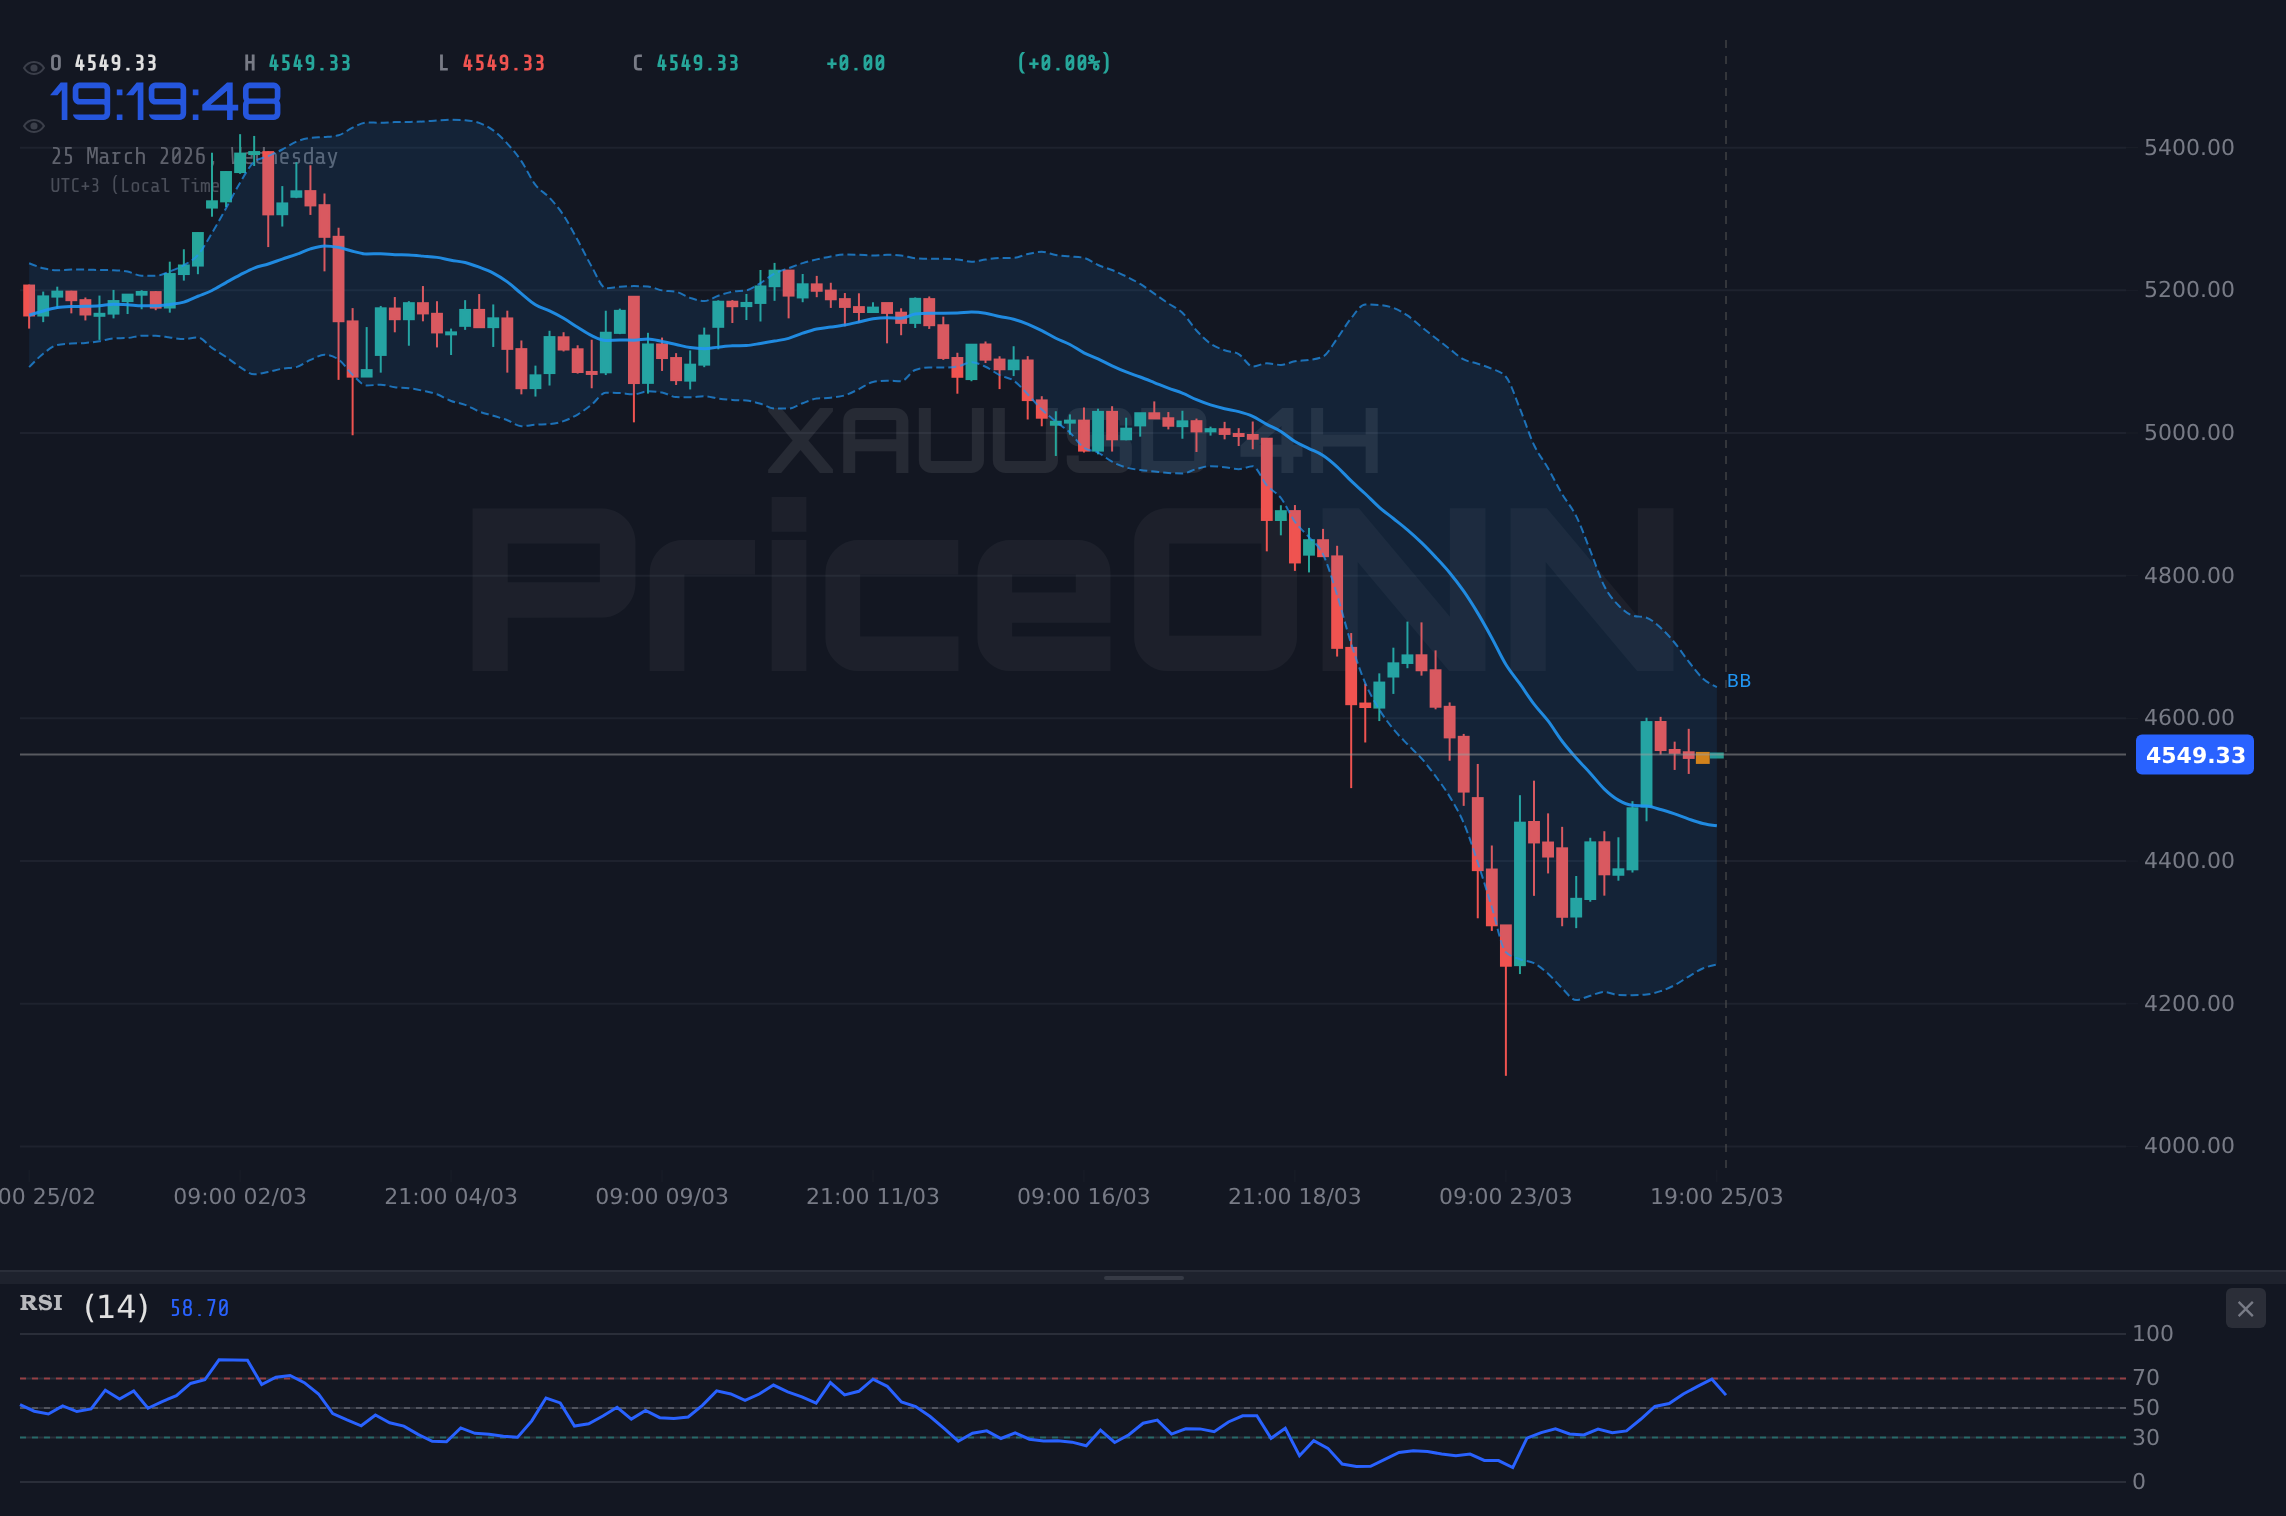
Delving into the Nasdaq100's technicals, the multi-timeframe analysis reveals a divergence that warrants close attention. On the 1-hour chart, the general signal leans towards 'Buy', with indicators like Stochastic (%K: 85.88, %D: 56.9) and RSI(14) at 62.96 suggesting upward momentum. The ADX at 13.39, however, indicates a weak trend, implying that this bullish signal might lack conviction and could be susceptible to reversal. This is a classic scenario where short-term traders might see an opportunity, but longer-term players would be wary of the underlying trend's fragility. The Bollinger Bands on this timeframe are also above the middle band, hinting at a potential upward push, but the low ADX value tempers this optimism.
The 4-hour timeframe presents a more neutral picture, with an equal split of 'Buy' and 'Sell' signals. The RSI(14) sits at 49.78, right in the neutral zone, indicating neither strong buying nor selling pressure. The MACD is positive, suggesting current upward momentum, but the ADX at 19.73 still points to a relatively weak trend. Stochastic is in the upper half, signaling potential upside, but the overall lack of a strong trend here suggests consolidation rather than a decisive move. This mid-term view implies that the market is in a holding pattern, waiting for a clearer catalyst to break the current equilibrium.
However, the daily timeframe paints a more cautionary picture, leaning towards a 'Sell' signal. The RSI(14) is at 38.01, below the 50 mark and indicating a downward bias. The MACD histogram is negative, and the ADX at 45.56 signals a strong downward trend. This is a significant divergence from the short-term bullish signals. It suggests that while there might be short-term fluctuations or bounces, the dominant longer-term trend for the Nasdaq100 is currently bearish. The Bollinger Bands are also trading below the middle band on the daily chart, reinforcing this bearish sentiment. This conflict between short-term and long-term signals is exactly why a purely technical approach can be misleading without considering the broader macro environment.
The Impact of Geopolitics and Economic Data
The current geopolitical climate adds a significant layer of complexity. Reports of escalating Middle East tensions, alongside potential ceasefire hopes, create volatility not just in energy markets but also in broader risk sentiment. When geopolitical risks rise, investors often seek refuge in safe-haven assets. The Dollar Index (DXY) at 99.37 is already showing strength, which is a typical response in such environments. This strength in the dollar can act as a drag on assets like the Nasdaq100, which often exhibits an inverse correlation, especially when driven by capital flows seeking perceived safety.
The oil market's reaction is particularly telling. Brent crude trading near $100.69 and WTI at $90.63, both with upward momentum, highlight the persistent inflationary concerns. If these energy prices continue to climb, they could force central banks to maintain a more hawkish stance than anticipated, or even reconsider rate cuts. This would have direct implications for growth stocks and tech indices. The market's reaction to upcoming economic data, such as employment figures and inflation reports, will be critical in shaping these expectations. For instance, if upcoming US employment data surprises to the downside, it could reinforce recession fears, potentially leading to a 'risk-off' move that would negatively impact the Nasdaq100. Conversely, strong data might fuel hopes for a 'soft landing', but coupled with rising oil prices, could also lead to concerns about sustained inflation.
The interplay between interest rate expectations and equity valuations is a constant theme. The Nasdaq100, with its heavy weighting towards growth and technology companies, is particularly sensitive to changes in the discount rate applied to future earnings. If the Federal Reserve signals a more hawkish stance due to persistent inflation, perhaps driven by high oil prices or strong employment numbers, it could lead to higher bond yields and put downward pressure on equity valuations. Currently, Fed Fund Futures and OIS data (if available) would be crucial here to gauge market expectations for future rate moves. Without specific Fed commentary or futures data in the provided context, we must infer potential policy shifts from inflation and employment indicators.
Intermarket Analysis: DXY, Equities, and Commodities
The relationship between the Nasdaq100 and the Dollar Index (DXY) is a cornerstone of modern market analysis. With the DXY currently at 99.37 and showing strength, it’s essential to monitor how this impacts global markets. A stronger dollar typically makes US exports more expensive and can reduce the profitability of US companies with significant overseas earnings, which are abundant in the Nasdaq100. This inverse correlation is often amplified during periods of global economic uncertainty or when the Fed is perceived to be on a different policy path than other major central banks.
The broader equity market context, represented by the S&P 500 trading around 6590.45, provides further insight. The S&P 500's slight daily dip, despite some positive economic data, suggests that the overall risk sentiment is cautious. When the S&P 500 shows weakness, it often precedes or accompanies declines in the more growth-sensitive Nasdaq100. This is because both indices are influenced by similar macroeconomic factors, such as interest rate expectations, inflation, and global growth prospects. The fact that the Nasdaq100 is currently testing support near $23,963, while the S&P 500 is also showing signs of consolidation, reinforces the idea that broader market sentiment is the dominant driver.
Commodities, particularly oil, serve as a barometer for inflation expectations and geopolitical risk. With Brent crude near $100.69 and WTI at $90.63, both showing upward movement, the market is pricing in potential supply disruptions and sustained demand. Higher oil prices can directly impact corporate costs and consumer spending, feeding into inflation data. This, in turn, can influence central bank policy, creating a ripple effect across all asset classes. For the Nasdaq100, sustained high energy prices could signal a more challenging environment for growth stocks, especially if it leads to tighter monetary policy or slower economic growth.
Bearish Scenario: Downside Momentum Builds
65% ProbabilityConsolidation Scenario: Range-Bound Trading
25% ProbabilityBullish Scenario: Support Holds Firm
10% ProbabilityNavigating Uncertainty: What Lies Ahead?
The current market environment for the Nasdaq100 is characterized by a tug-of-war between short-term technical signals and overarching macroeconomic and geopolitical concerns. While the 1-hour chart might offer glimpses of potential upside, the daily trend and the broader market context, including a firming dollar and rising oil prices, paint a more subdued picture. The critical support level to watch is near $23,963. A decisive break below this level, particularly on increasing volume and accompanied by a strengthening DXY and continued geopolitical unease, would likely trigger further downside towards $23,735.99 and potentially $23,550.80.
Conversely, for the bulls to regain control, the Nasdaq100 would need to not only hold the $23,963 support but also decisively break through the initial resistance at $24,376.04. This would require a shift in broader market sentiment, perhaps driven by more dovish central bank signals or a de-escalation of geopolitical tensions. Without such catalysts, any rallies might be met with profit-taking, especially as the DXY remains firm and oil prices hover at elevated levels. The mixed signals across different timeframes suggest that the market is in a state of flux, making it imperative for traders to exercise patience and focus on risk management.
The upcoming economic calendar, though not explicitly detailed with specific dates for all high-impact events, will be crucial. Any surprises in upcoming employment or inflation data could significantly alter the market's perception of central bank policy. For instance, if the US reveals stronger-than-expected inflation figures, it could embolden the Fed to maintain a hawkish stance, putting further pressure on growth assets. Conversely, signs of cooling inflation or a significant slowdown in job growth might pave the way for a more dovish outlook, potentially benefiting the Nasdaq100. Traders should remain vigilant for any news or data that could shift the narrative from geopolitical risk and inflation concerns towards a more growth-oriented perspective.
Frequently Asked Questions: Nasdaq100 Analysis
What happens if the Nasdaq100 breaks below the $23,963 support level?
If the Nasdaq100 closes decisively below the $23,963 support level, particularly with rising geopolitical tensions and a strengthening dollar, it could trigger a sell-off towards the next support at $23,735.99. This scenario is currently assigned a 65% probability, reflecting the prevailing cautious market sentiment.
Should I consider buying Nasdaq100 at current levels near $24,147 given the mixed signals?
Given the divergence between short-term bullish signals and longer-term bearish trends, caution is advised. A confirmed hold above $23,963 support with increasing volume could present a low-probability (10%) bullish setup targeting $24,376. However, the higher probability (65%) lies with a break below support.
Is the RSI at 38.01 on the daily chart a strong sell signal for the Nasdaq100?
An RSI of 38.01 on the daily chart does indicate a downward bias, suggesting bearish momentum. While not yet deeply oversold, this reading aligns with the daily timeframe's overall 'Sell' signal and supports the bearish scenario if key support levels fail.
How might rising oil prices around $100 impact the Nasdaq100's outlook this week?
Sustained high oil prices near $100 can fuel inflation concerns, potentially leading to a more hawkish central bank stance. This would increase the discount rate on future earnings, negatively impacting growth stocks within the Nasdaq100 and reinforcing the bearish outlook.
| Indicator | Value | Signal | Interpretation |
|---|---|---|---|
| RSI (14) | 38.01 | Bearish | Daily: Downward bias, below 50 |
| MACD Histogram | - | Bearish | Daily: Negative momentum |
| Stochastic | K=45.64, D=29.76 | Bullish | Daily: Crossover, but overall trend is key |
| ADX | 45.56 | Strong Trend | Daily: Strong downtrend indicated |
| Bollinger Bands | Below Mid | Bearish | Daily: Price below middle band |
Track markets in real-time
AI-powered analysis, technical indicators and real-time price data.
Join Our Telegram Channel
Breaking market news, AI analysis and trading signals instantly.
Join Channel