SP500 Tests $6,596.20 Support Amid Recession Fears and Oil Shock
SP500 is testing critical support at $6,596.20 as surging oil prices and rising recession odds create market headwinds. What's next for equities?
This is precisely where you need to pay attention: the S&P 500 is currently hovering around the $6,596.20 mark, a level that's becoming increasingly critical as geopolitical tensions and economic anxieties converge. Having watched the market closely, it's clear that the bulls are facing a significant test, with the specter of recession looming larger than it has in months. The recent surge in oil prices, coupled with a general downturn in risk appetite, is creating a potent cocktail of headwinds for the equity markets, forcing traders to re-evaluate their positions and risk management strategies.
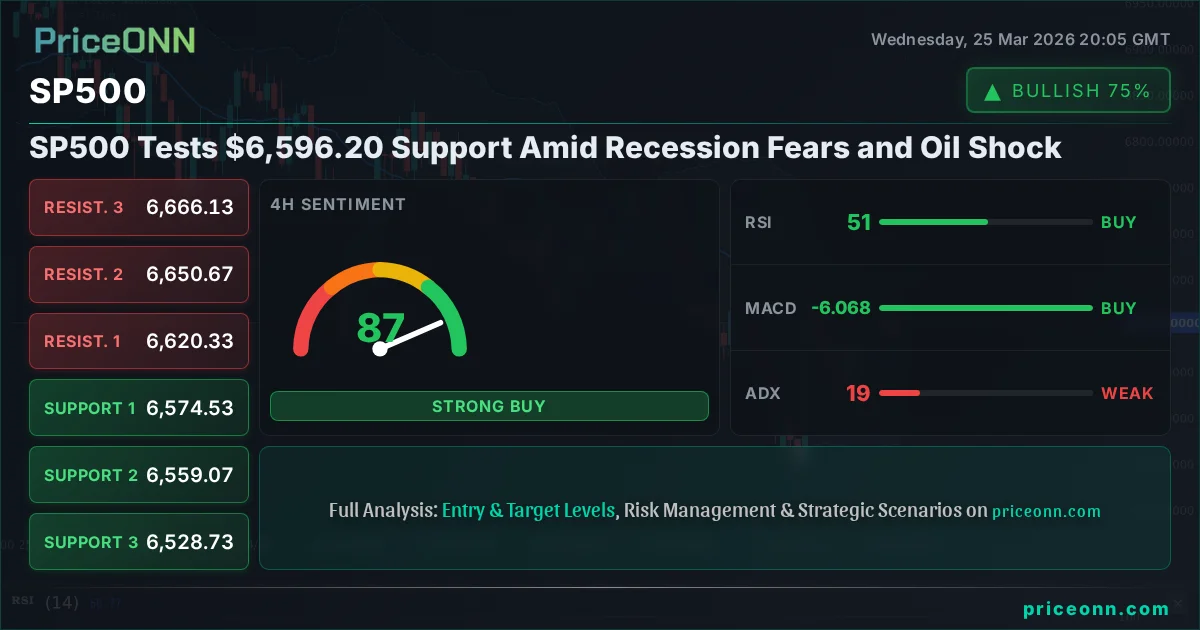
- The S&P 500 is testing crucial support at $6,596.20, with the 4-hour ADX at 19.1 indicating a choppy, ranging market.
- A daily close above the resistance level of $6,633.63 would be needed to signal a potential shift in momentum.
- RSI at 50.22 on the 1-hour chart suggests a neutral stance, but the MACD histogram showing negative momentum indicates underlying selling pressure.
- The strong correlation with DXY, currently at 99.4, means dollar strength continues to exert pressure on risk assets like the S&P 500.
The confluence of factors pushing against the S&P 500 right now is undeniable. We're seeing a palpable shift in market sentiment, moving away from the risk-on euphoria of recent times towards a more cautious, risk-averse posture. This isn't just a blip; the odds of a recession are now being quoted by Wall Street economists as exceeding 45%, a significant jump that underscores the growing economic slack and the potential for further downside. The latest breaking news highlights this sentiment, with reports indicating that Middle East tensions are not only impacting energy markets but also threatening industrial output, a clear sign of broader economic contagion. This macro backdrop is precisely why understanding the current price action at $6,596.20 is paramount for any serious trader.
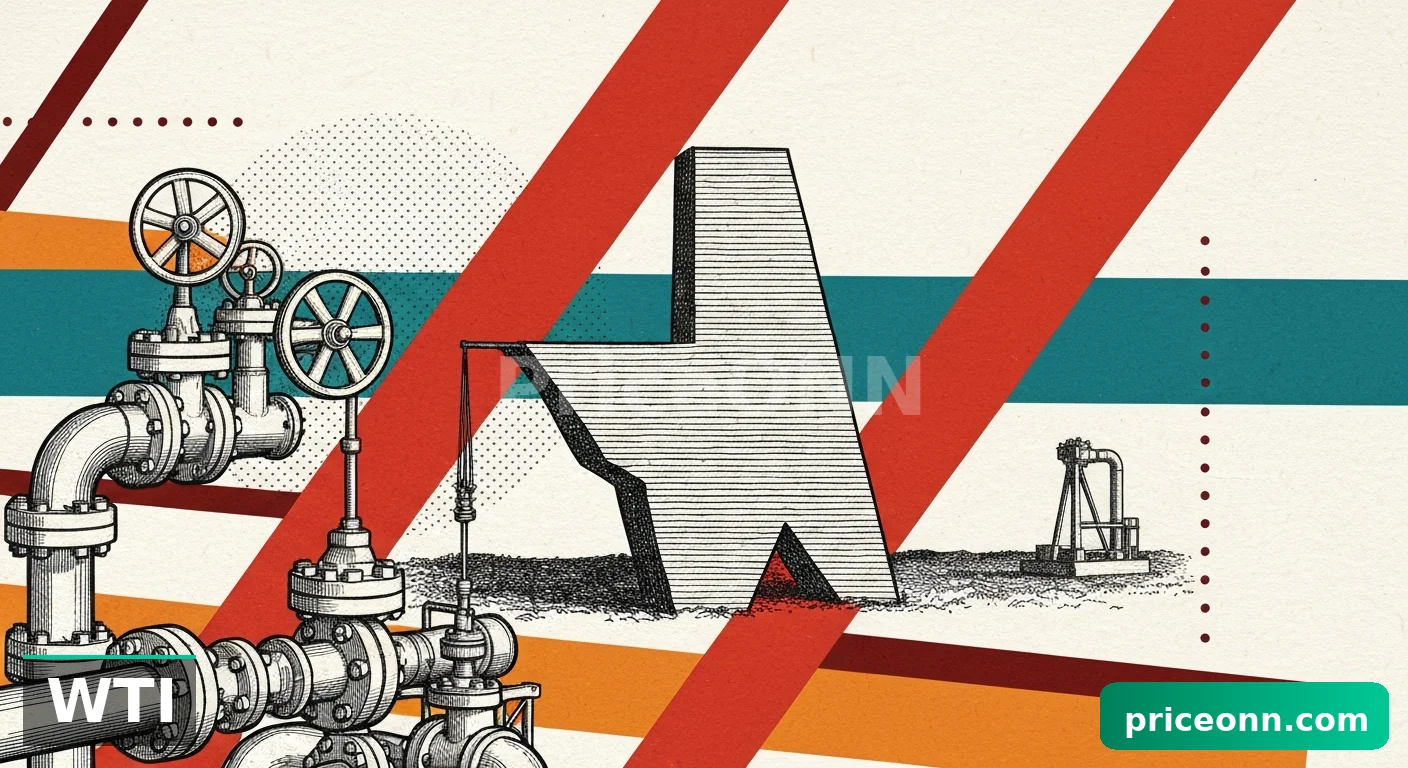
The Roaring Oil Price and Its Ripple Effect
Let's start with the most immediate catalyst: the sharp ascent in crude oil prices. Brent crude is trading at $101.90, and WTI at $91.59, both showing significant daily gains. This isn't just about energy costs; it's a potent inflation signal. As oil prices climb, the cost of transportation, manufacturing, and virtually every other sector of the economy rises. This directly feeds into inflation expectations, which in turn influences central bank policy. The market is now grappling with the uncomfortable reality that persistently high energy prices could force central banks, like the Federal Reserve, to maintain a hawkish stance for longer, or even consider further tightening, despite the growing recessionary signals. This dynamic creates a difficult environment for equities, as higher rates tend to dampen corporate earnings and reduce the present value of future cash flows.
The correlation between oil prices and inflation is well-documented, and its impact on stock markets is often direct. When oil prices spike, as they have recently, it puts immediate pressure on consumer spending and corporate margins. This, combined with the geopolitical instability in the Middle East that's fueling the oil surge, paints a picture of elevated uncertainty. The news flow around naphtha shortages and their impact on petrochemical output in Japan is a stark reminder of how interconnected global supply chains are and how vulnerable they are to geopolitical shocks. For the S&P 500, trading near $6,596.20, this means that any positive momentum is likely to be met with selling pressure, especially if inflation fears continue to dominate the narrative.
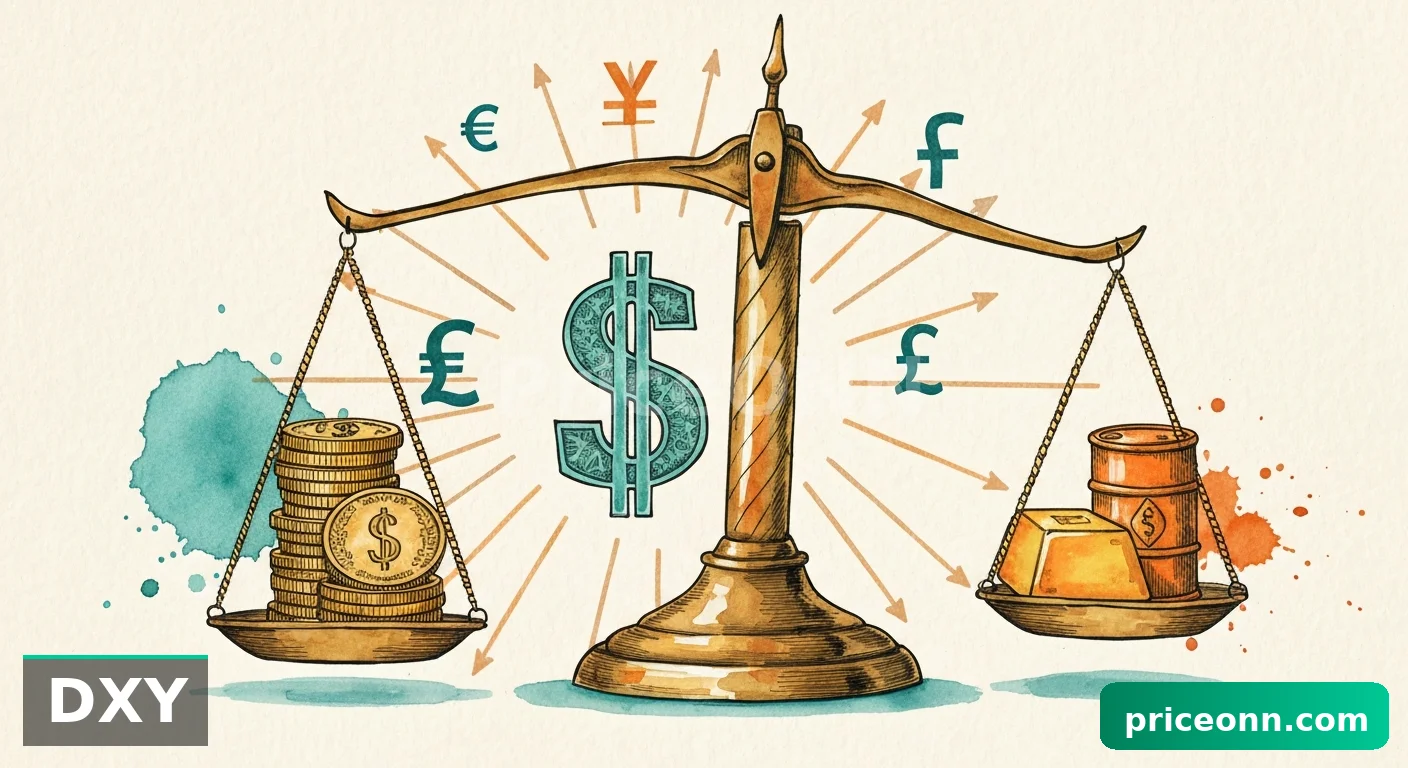
DXY Strength and the Dollar's Dominance
Complementing the pressure from oil prices is the strength of the US Dollar Index (DXY). Currently trading at 99.4, the DXY's upward trajectory has significant implications for global markets. A stronger dollar typically makes US exports more expensive and can put pressure on multinational corporations' earnings. More importantly, it often correlates inversely with risk assets like stocks and commodities. When the dollar strengthens, it signals a preference for safe-haven assets, pulling capital away from riskier investments. This is particularly relevant for gold, which, despite a recent rally to $4,540.50, faces headwinds from a robust dollar. For the S&P 500, the DXY's current level suggests that global liquidity might be tightening, making it harder for equities to find sustained upward momentum.
The relationship between the DXY and the S&P 500 is a key indicator of risk sentiment. As the DXY pushes higher, it often coincides with a pullback in major stock indices. The data shows a DXY at 99.4, and the S&P 500 is indeed testing support around $6,596.20. This suggests that the prevailing market condition is one of risk aversion, where investors are favoring the perceived safety of the US dollar over the potential returns of equities. The Fed's policy path is a major driver here; if the market anticipates continued hawkishness due to inflation concerns (exacerbated by oil prices), the dollar could remain strong, further pressuring the S&P 500. The fact that the 1-hour ADX for DXY is only 15.36, indicating a weak trend, might suggest this dollar strength is currently more of a reaction than a sustained trend, but its immediate impact on risk assets is undeniable.
Equity Market Technicals: A Mixed Picture at Key Levels
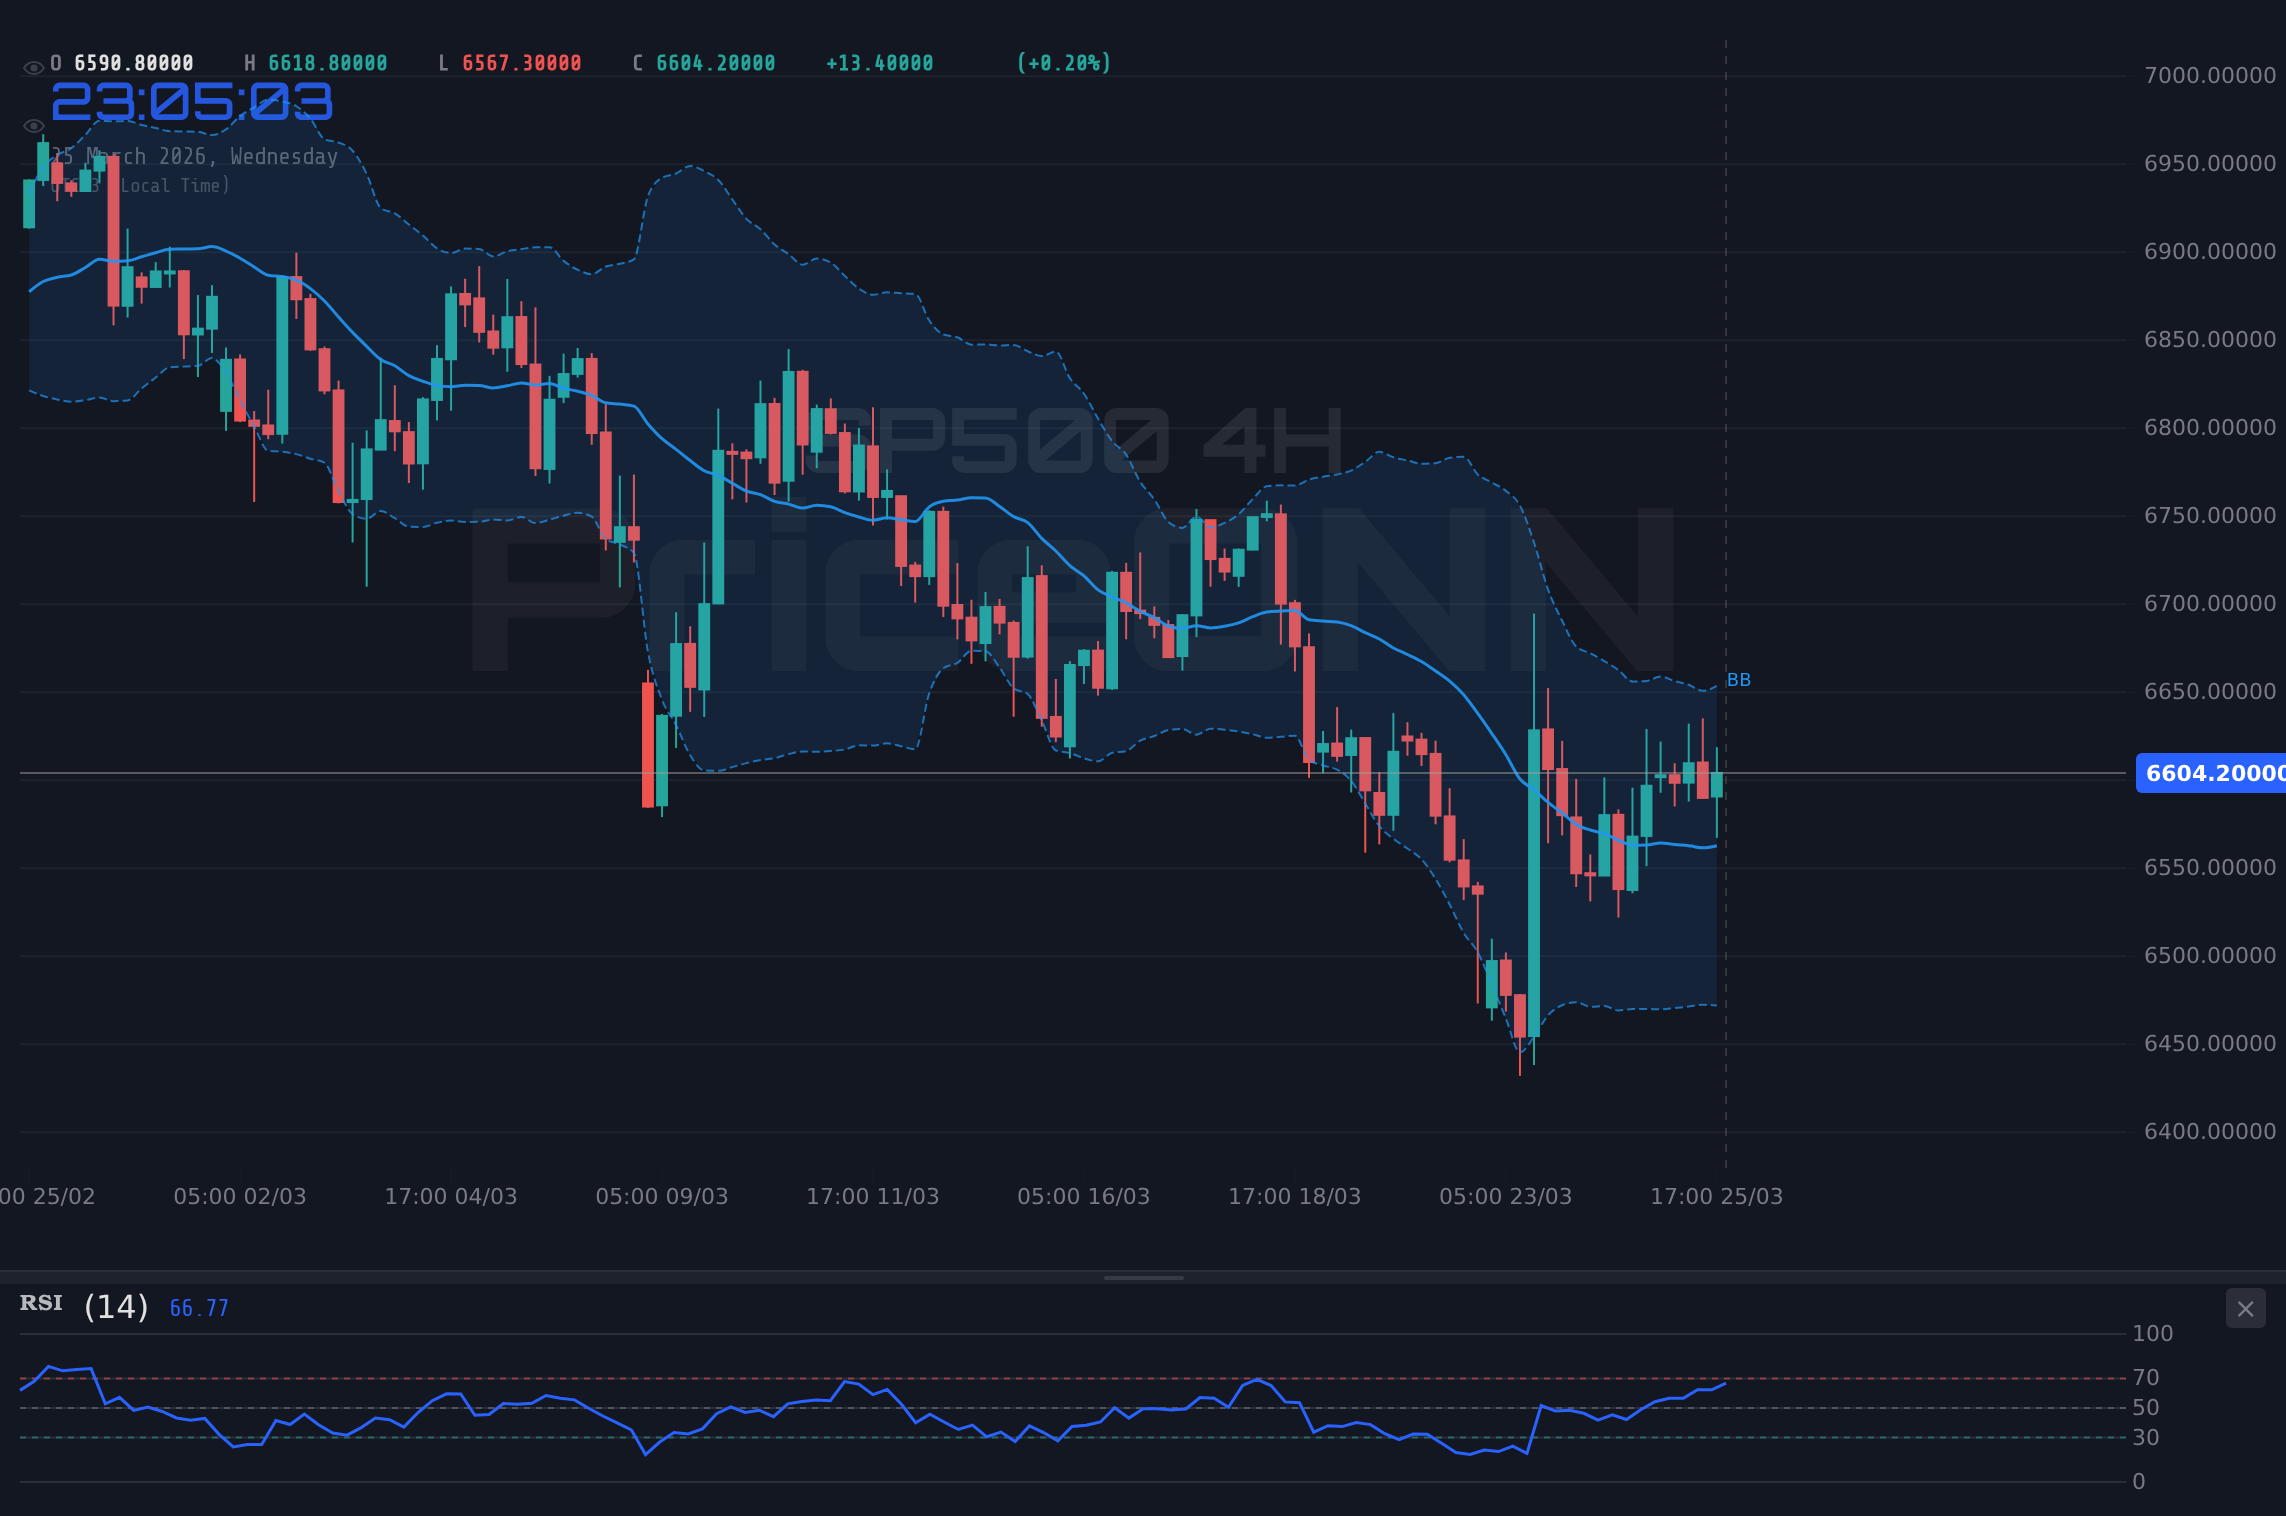
Technically, the S&P 500 presents a complex picture at the $6,596.20 support level. On the 1-hour chart, the RSI is sitting at a neutral 50.22, indicating a lack of strong directional conviction in the very short term. However, the MACD is in negative territory, with the MACD line below the signal line, suggesting bearish momentum is currently in play. The Stochastic Oscillator, with K at 43.64 and D at 43.66, is also teetering on a bearish signal, reinforcing the idea that the immediate pressure is to the downside. The ADX on the 1-hour chart at 12.76 signifies a weak trend, which aligns with the general choppiness we're seeing across many markets right now – a characteristic of a 'WATCH_ZONE' scenario where a breakout hasn't yet committed.
Diving deeper into the 4-hour timeframe, the picture becomes slightly more constructive, though still lacking a clear mandate. The RSI is at 50.63, again in neutral territory but with a slight upward inclination, suggesting some underlying buying interest could emerge. The MACD here is positive, with the MACD line above the signal line, offering a counterpoint to the 1-hour bearish signal. However, the Stochastic is in the upper half of its range (K=68.4, D=64.13), showing a bullish crossover but not yet in extreme overbought territory. The ADX at 19.1 on the 4-hour chart still points to a weak trend, reinforcing the idea that we're in a consolidation phase rather than a strong directional move. This duality across timeframes is why a 'WATCH_ZONE' decision is appropriate; confirmation is needed before committing capital.
The daily chart paints a starkly bearish picture, however. The RSI is down at 38.37, firmly in the lower half of the neutral zone and showing a downward trend. The MACD is bearish, below its signal line, and the histogram is negative, all pointing towards selling pressure. The Bollinger Bands are below the middle band, indicating a bearish inclination. The Stochastic is showing a bullish crossover (K=46.23, D=29.86), which might suggest a potential short-term bounce, but this is in stark contrast to the broader bearish signals. The ADX on the daily chart is a significant 45.56, confirming a strong downtrend. This daily perspective is crucial: while short-term fluctuations might occur, the longer-term trend remains decidedly bearish, making the $6,596.20 support level a critical battleground.
Recession Fears Mount: What the Data Implies
The economic calendar, even with some data points missing, provides context. The recent US Manufacturing PMI came in at 52.4, above forecast (51.5), which might seem positive, but the Services PMI at 51.1 was below expectations (52). This divergence suggests that while manufacturing might be holding up, the services sector, which is a larger part of the economy, is showing signs of slowing. Furthermore, the mixed signals from the employment data – a strong ADP number (6.926k) versus potentially weaker official figures yet to be released – add to the uncertainty. These conflicting indicators are precisely what fuels recession fears. When economic data is inconsistent, it becomes harder for policymakers and markets to chart a clear course, leading to increased volatility and risk aversion.
The narrative around potential rate cuts is also evolving rapidly. While some expected the Fed to pivot towards easing, the persistent inflation, partly driven by oil prices, is putting that expectation in doubt. If the Fed holds rates higher for longer, it will further dampen economic activity and increase the probability of a recession. This is a critical factor for the S&P 500. Investors are constantly trying to price in the Fed's next move, and any sign of continued hawkishness will likely weigh on stock prices. The lack of specific upcoming high-impact USD events in the provided snippet means the market will be highly sensitive to any subtle hints from Fed officials or any shifts in inflation data that could alter rate expectations.
Cross-Market Correlations: The Interconnectedness of Risk
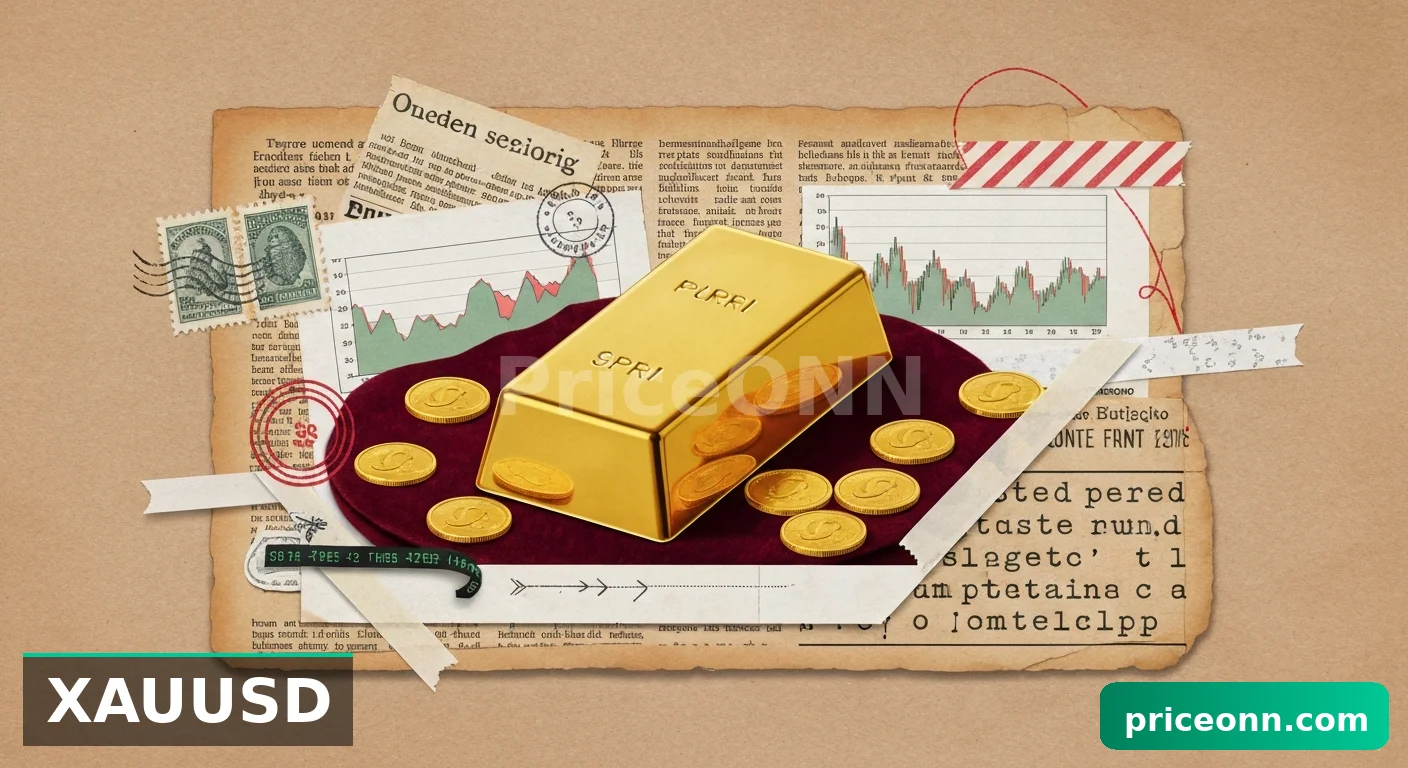
Examining other markets provides vital context. Gold, currently at $4,540.50, is showing a strong upward trend on the daily chart (ADX 27.45), but its short-term indicators are mixed. Silver (XAGUSD) at 72.17 is showing a stronger buy signal on the 4-hour chart, suggesting precious metals might be anticipating some form of economic distress or safe-haven demand. However, the strong DXY at 99.4 acts as a significant counterforce. The inverse correlation between the dollar and commodities like gold and silver is a classic dynamic, and the dollar's current strength is capping their upside potential, which in turn can limit any immediate relief rally in the S&P 500.
The performance of other equity indices also offers clues. The Nasdaq 100 is trading at 24,175.98, showing a bearish signal on the 1-hour chart and a strong downtrend on the daily (ADX 40.91). The Dow Jones 30, at 46,454.50, presents a mixed picture with a bullish 4-hour trend but a strong daily downtrend (ADX 41.32). This divergence within the equity space suggests that while certain sectors might be holding up better, the overall sentiment is cautious. The fact that the S&P 500 is testing support at $6,596.20 while the Nasdaq shows a stronger daily downtrend indicates that the broader market sentiment is leaning negative. This reinforces the need for caution and emphasizes that any bounce in the S&P 500 needs to be viewed with skepticism until stronger confirmation emerges.
Trade Scenarios for the S&P 500 at Key Levels
Bearish Scenario: Testing the Depths
65% ProbabilityNeutral Scenario: Choppy Waters Ahead
25% ProbabilityBullish Scenario: A Fleeting Respite?
10% ProbabilityFrequently Asked Questions: S&P 500 Analysis
What happens if the S&P 500 breaks below the $6,596.20 support level?
If the S&P 500 closes decisively below $6,596.20, particularly on the daily chart, it would signal a continuation of the bearish trend. The immediate downside target would likely be the $6,550.83 support, with further potential towards $6,528.73 if selling pressure intensifies.
Should I consider buying the S&P 500 at current levels around $6,596.20 given the mixed signals?
Buying at current levels requires extreme caution due to the dominant daily downtrend (ADX 45.56) and the strong DXY at 99.4. A high-probability entry would only emerge on a confirmed break above $6,633.63 resistance, or a clear reversal pattern forming at support with confirmation from multiple indicators.
Is the RSI at 50.22 a sell signal for the S&P 500 right now?
An RSI of 50.22 on the 1-hour chart is largely neutral, indicating a lack of strong conviction. While it doesn't signal a direct sell, it doesn't offer bullish confirmation either. The negative MACD momentum on the same timeframe suggests that even with a neutral RSI, the immediate pressure might still favor sellers until a clear uptrend is established.
How will rising oil prices and potential recession fears impact the S&P 500 this week?
Rising oil prices at $101.90 (Brent) and $91.59 (WTI) fuel inflation concerns, potentially keeping the Fed hawkish and pressuring the S&P 500. If recession odds continue to climb past 45%, as economists suggest, this will likely lead to further downside pressure on equities as investors seek safer assets.
Track markets in real-time
AI-powered analysis, technical indicators and real-time price data.
Join Our Telegram Channel
Breaking market news, AI analysis and trading signals instantly.
Join Channel