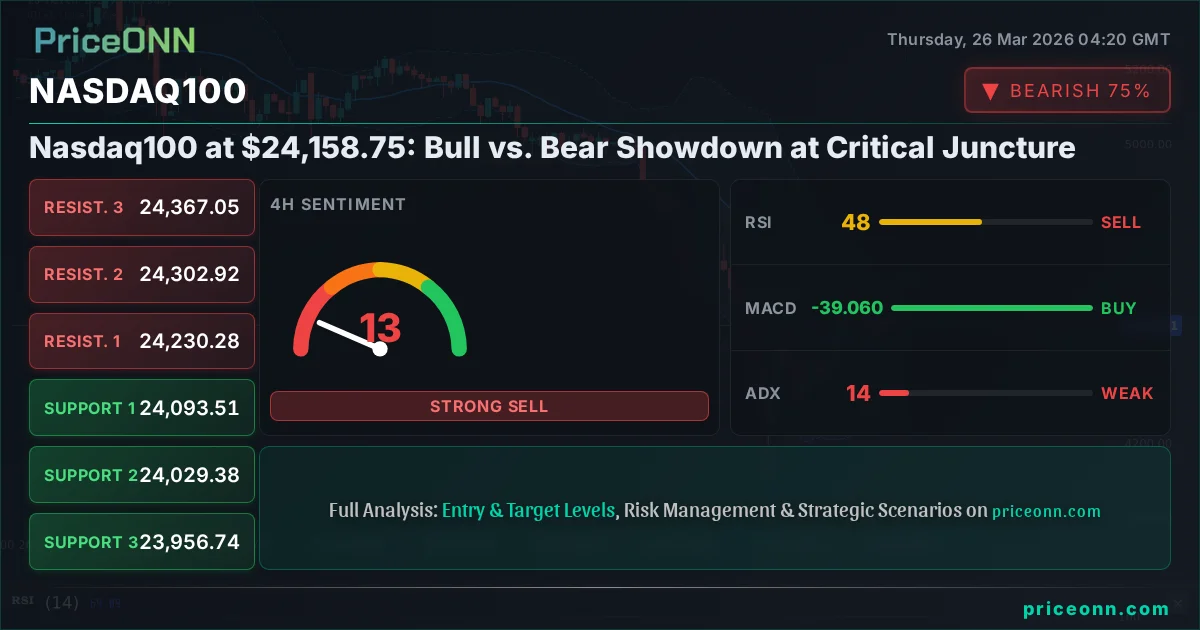
Nasdaq100 at $24,158.75: Bull vs. Bear Showdown at Critical Juncture
Nasdaq100 hovers around $24,158.75. With mixed signals and key levels in play, is the rally sustainable or are bears poised to strike?
Is the Nasdaq100 ready to stage a significant comeback, or are the bears circling for another attack? This is the central tension gripping the tech-heavy index as it trades precariously around the $24,158.75 mark. After a period of consolidation following recent volatility, the market is at a critical juncture. The bulls are fighting to defend key support levels, hoping to reignite the upward momentum that has characterized much of the past year. Conversely, bears are looking to capitalize on any weakness, aiming to push the index lower and retest more significant downside targets. Understanding the interplay between these opposing forces, underpinned by a complex web of macroeconomic data, geopolitical undercurrents, and intermarket correlations, is crucial for navigating the current trading landscape. This analysis delves into the arguments for both sides, examining the technical indicators and fundamental drivers that will likely dictate the Nasdaq100's next major move.
- With RSI at 48.2 on the 4-hour chart, the index shows neutral momentum, hinting at indecision rather than a strong directional bias.
- Critical support for the Nasdaq100 sits at $23,956.74, a level that has seen significant buying interest previously.
- The MACD histogram on the 1D chart is negative, suggesting bearish momentum is building, contradicting some shorter-term signals.
- Correlation with the DXY, currently at 99.39, remains a key factor; a stronger dollar typically exerts downward pressure on US equity indices.
The Nasdaq100's current position around $24,158.75 represents a battleground where conflicting signals and economic narratives are clashing. The bulls see a temporary pause, a healthy consolidation before the next leg higher, fueled by robust corporate earnings and the persistent narrative of technological innovation. They point to the resilience shown at support levels and the potential for a renewed risk-on sentiment to lift equities. On the other hand, the bears are increasingly vocal, citing elevated valuations, persistent inflation concerns that could deter Fed rate cuts, and growing geopolitical instability. The fact that the index is trading with a generally bearish signal across multiple daily indicators, despite some short-term bullish readings, adds weight to their argument. The divergence in signals across different timeframes - from the neutral 1H trend to the strong bearish trend on the 1D ADX at 42.35 - underscores the choppiness and lack of conviction in the market right now. This complex technical picture necessitates a deeper dive into the evidence supporting each viewpoint.
The Bull Case: Innovation and Fed Patience
Rallying on Tech Strength and Soft Landing Hopes
The optimistic outlook for the Nasdaq100 is primarily anchored in the enduring strength of its constituent technology companies and the hope for a 'soft landing' in the global economy. Despite broader economic headwinds, many tech giants continue to report strong earnings, driven by artificial intelligence, cloud computing, and digital transformation trends. These companies are not just surviving but thriving, showcasing pricing power and innovation that justifies their current valuations in the eyes of many bulls. The narrative is that these secular growth trends are powerful enough to overcome cyclical economic slowdowns. The bulls argue that the Federal Reserve's current stance, while cautious, is not overly restrictive. They believe that if inflation continues to moderate, even without immediate rate cuts, the Fed's patience will eventually lead to a stable economic environment, supporting continued equity performance. This perspective suggests that any dips are merely opportunities to accumulate positions at more attractive prices before the next upward move.
Technically, the bulls find some solace in the shorter-term indicators. The 1H Stochastic is showing a crossover with %K at 37.15 and %D at 26.73, suggesting a potential for upward momentum. While the 1H RSI at 49.86 is not yet in overbought territory, it indicates a potential shift away from the recent bearish lean. The 4-hour chart presents a slightly more encouraging picture, with the Bollinger Bands showing price above the middle band, indicating an upward bias in that timeframe. The MACD on the 4H chart is also positive, with the MACD line above the signal line, reinforcing the idea of strengthening bullish momentum. These shorter-term signals, if sustained, could provide the foundation for a move higher. The bulls are watching the resistance level at $24,230.28 closely; a decisive break above this could signal a more sustained rally, potentially targeting higher levels.
Correlation with a Weakening Dollar and Risk Appetite
Another pillar of the bullish argument rests on the correlation between equity markets and the US Dollar Index (DXY). Currently, the DXY is trading around 99.39, and while it showed some upward movement on the 1H and 4H charts, its longer-term trend on the daily timeframe is showing negative momentum. A weakening dollar, or even a stabilization after recent strength, often correlates with increased risk appetite, which directly benefits growth-oriented assets like the Nasdaq100. Investors tend to move capital from the perceived safety of the dollar into equities when the global economic outlook appears more stable or when interest rate differentials become less favorable for dollar accumulation. Furthermore, the S&P 500, currently at 6587.1, has shown a similar pattern of consolidation, with its daily ADX at 45.79 indicating a strong downtrend, but its 4H chart showing some bullish divergence. If the broader market sentiment shifts towards 'risk-on,' the Nasdaq100 is poised to benefit significantly, potentially pulling away from its current support levels.
The bulls also look at the commodity markets for cues. While oil prices have been volatile, Brent crude is trading above $102.1, and WTI at $92.1, indicating sustained demand, which can sometimes be a proxy for global economic activity. While high oil prices can fuel inflation concerns, they can also signal robust industrial production and consumer demand, both of which are beneficial for tech companies that supply essential services and products. In this view, the current price action is a temporary pause, and the underlying fundamentals - technological advancement and a potentially resilient economy - remain intact, setting the stage for a renewed rally towards higher resistance levels.
The Bear Case: Inflation, Geopolitics, and Valuation Concerns
The Weight of Macroeconomic Headwinds
The bears present a formidable counter-argument, emphasizing the persistent macroeconomic challenges that could derail the Nasdaq100's rally. Inflation remains a key concern. Although some data points might suggest moderation, the 'stubborn' nature of inflation, as highlighted by some economists, means central banks might be forced to maintain higher interest rates for longer. This is a direct threat to growth stocks, as higher rates increase the cost of capital, reduce the present value of future earnings, and make safer investments like bonds more attractive. The Fed Funds Futures and OIS markets are constantly repricing rate cut expectations, and any shift towards a 'higher for longer' interest rate environment would be a significant headwind for the Nasdaq100. The current ADX on the daily chart at 42.35 indicates a strong downtrend, and the daily MACD is firmly negative, with the MACD line below the signal line, reinforcing this bearish outlook.
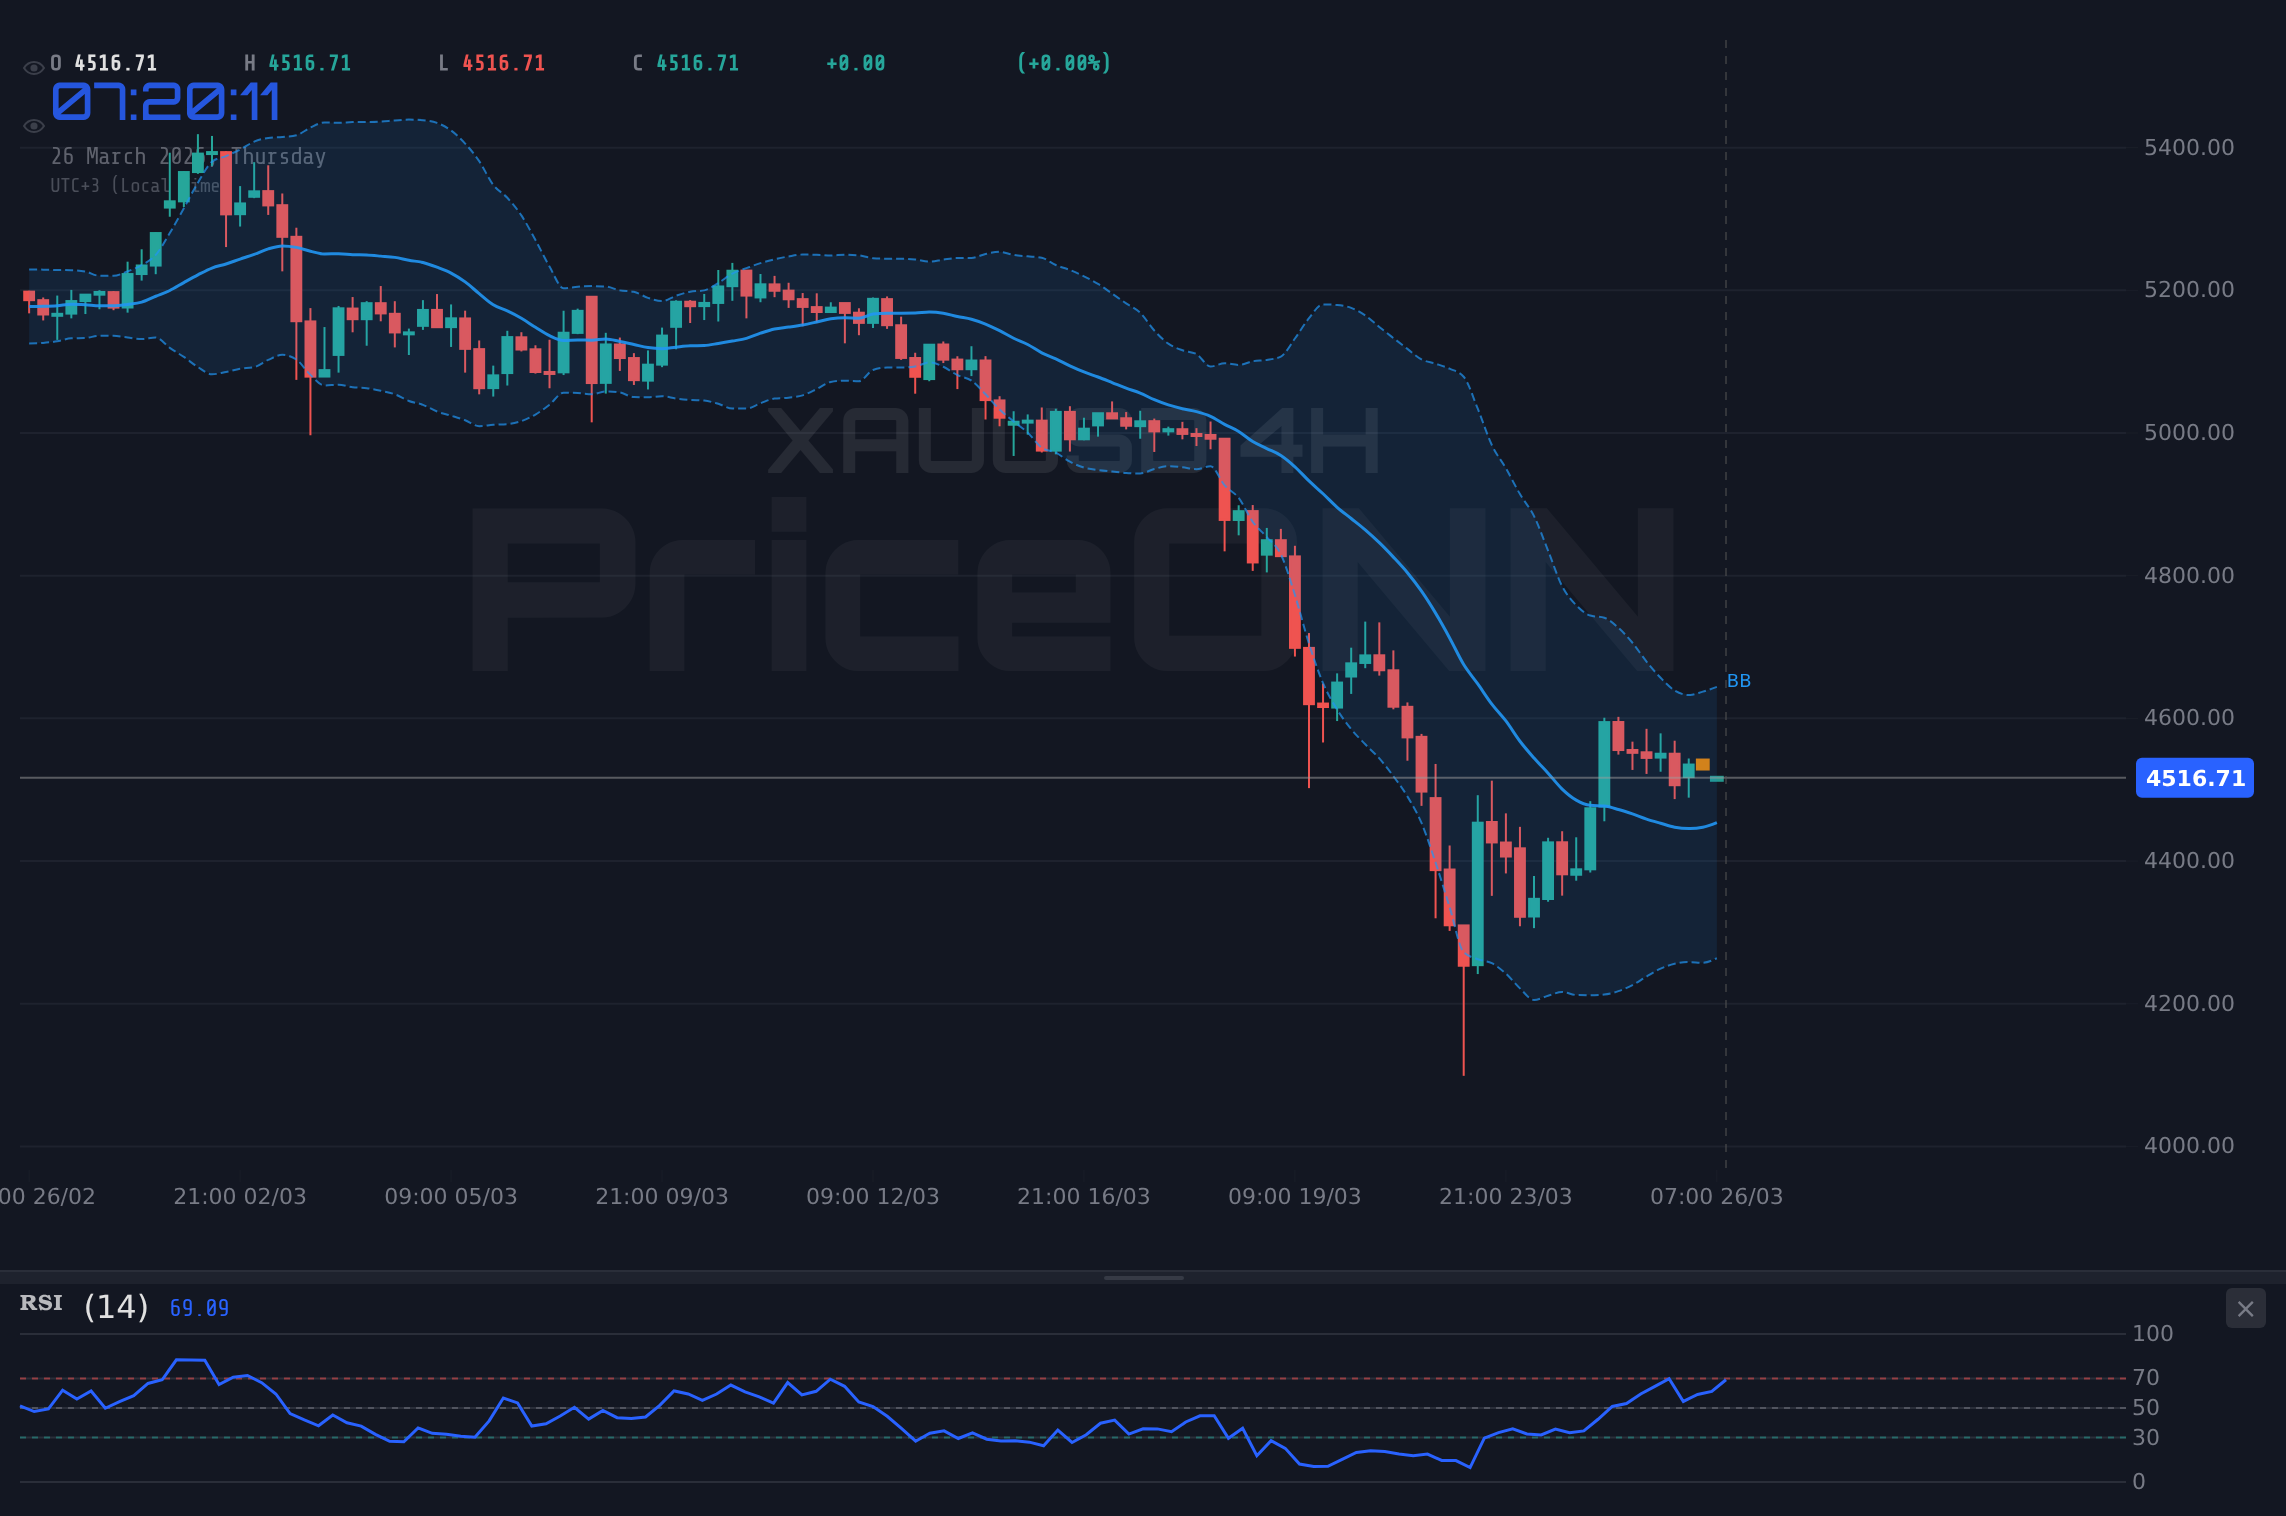
Furthermore, the geopolitical landscape remains fraught with tension. News regarding potential US-Iran ceasefire hopes may have temporarily eased oil prices, but the underlying geopolitical risks - from ongoing conflicts to trade disputes - continue to cast a shadow over global markets. Increased geopolitical uncertainty typically leads to a 'risk-off' environment, where investors flee to safe-haven assets like the US Dollar (DXY at 99.39 and showing strength on shorter timeframes) and gold (XAUUSD trading around $4,518.01). A strengthening dollar, in particular, tends to put downward pressure on US equities, including the Nasdaq100. The fact that the S&P 500 has a strong daily ADX of 45.79 and is showing a bearish trend further supports the idea that broader market sentiment could turn negative, dragging the Nasdaq100 down with it.
Valuation Concerns and Technical Weakness
From a valuation perspective, many argue that tech stocks, particularly on the Nasdaq100, are trading at stretched multiples. While earnings growth has been strong, it may not be sufficient to justify current price-to-earnings ratios, especially in a higher interest rate environment. This makes the index vulnerable to sharp corrections if earnings growth falters or if market sentiment shifts. The bears are closely watching the support level at $23,956.74. A decisive break below this level, especially on increased volume, could trigger a cascade of selling as stop-loss orders are hit and technical traders pivot to short positions. The RSI on the daily chart at 40.66, while not yet oversold, is trending downwards, indicating weakening buying pressure. Similarly, the 1H Stochastic is showing a bearish crossover with %K at 34.25 and %D at 51.97, signaling potential downside momentum on the hourly chart.
The conflicting signals across different timeframes are, for bears, a sign of underlying weakness rather than indecision. While the 1H and 4H charts might show pockets of bullishness, the dominant daily trend, supported by a strong ADX of 42.35, suggests that the longer-term picture is bearish. The MACD on the daily chart is also negative, reinforcing the bearish momentum. The bears believe that the market is overdue for a significant correction, and the current price consolidation is merely a temporary pause before a larger downward move. They are looking for confirmation of a break below key support levels, such as $23,956.74, to signal the start of a more substantial decline, potentially targeting the next significant support at $23,800.67.
Navigating the Crossroads: Technicals and Scenarios
Interpreting the Conflicting Technical Signals
The technical indicators offer a mixed bag, reflecting the current market tension. On the daily timeframe, the ADX at 42.35 signals a strong downtrend, and the MACD is negative, painting a bearish picture. The RSI at 40.66 is trending down, suggesting bearish momentum. However, the daily Stochastic shows a bullish crossover (%K at 42.79, %D at 36.83), and the Bollinger Bands are above the middle band, hinting at potential upside. This conflict is mirrored on shorter timeframes. The 1H chart shows a bearish MACD and RSI leaning down, but a bullish Stochastic crossover. The 4H chart offers a slightly more bullish leaning with positive MACD and price above the middle Bollinger Band, yet the Stochastic shows a bearish crossover and the RSI is still in neutral territory at 48.2. This divergence is typical of a market consolidating or preparing for a significant move, where short-term signals can be misleading.
The dollar index (DXY) at 99.39, showing strength on shorter timeframes but negative daily momentum, adds another layer of complexity. A rising DXY typically pressures the Nasdaq100, but if the dollar's strength proves temporary, it could support a bullish move in equities. Gold prices, currently around $4,518.01, have seen a rally, often acting as a safe haven. If geopolitical tensions escalate, gold could continue to rise, potentially pulling capital away from riskier assets like tech stocks. Conversely, if tensions ease, gold might correct, releasing capital back into the equity markets. The interplay between these assets is crucial; a consistent move in one direction across DXY, gold, and the major indices would provide a clearer signal.
Scenario Analysis for the Nasdaq100
Bearish Descent: Testing Lower Grounds
65% ProbabilityConsolidation Zone: Choppy Waters Ahead
25% ProbabilityBullish Breakout: Renewed Upside Momentum
10% ProbabilityThe prevailing sentiment leans towards the bearish scenario, given the strength of the daily downtrend indicated by the ADX at 42.35 and the negative MACD. The probability assigned reflects this technical picture. A break below the immediate support at $23,956.74 is seen as the most likely catalyst for downside continuation, potentially leading to tests of $23,800.67 and then the psychological level of $23,600.00. The neutral scenario anticipates a period of sideways trading, a common occurrence when conflicting signals emerge, with price likely to oscillate between the immediate support and resistance levels of $23,956.74 and $24,230.28. The bullish scenario, while less probable in the current technical climate, remains a possibility if key resistance levels are decisively broken, especially if accompanied by a shift in broader market sentiment and a weakening dollar.
Traders should exercise caution given the conflicting signals and the high ADX reading on the daily chart, which suggests significant trend strength in the bearish direction despite shorter-term counter-trends. Always use stop-losses and manage position sizing appropriately, especially when trading around key support and resistance levels.
Frequently Asked Questions: Nasdaq100 Analysis
What happens if Nasdaq100 breaks below $23,956.74 support?
A break below $23,956.74, the first key support level on the 4-hour chart, would likely trigger a bearish scenario. This could lead to a rapid decline targeting $23,800.67, which is the second support level on the daily chart.
Should I buy Nasdaq100 at current levels of $24,158.75 given the mixed signals?
Buying at $24,158.75 is risky due to conflicting technical indicators and a strong daily downtrend signal (ADX 42.35). A more conservative approach would be to wait for a clear break above resistance at $24,230.28 or a decisive move down to retest support near $23,956.74 before committing.
Is the RSI at 48.2 a sell signal for Nasdaq100 right now?
An RSI of 48.2 on the 4-hour chart is in neutral territory and not a direct sell signal, but it leans towards bearish momentum. It indicates a lack of strong buying pressure, aligning with the broader bearish trend, but confirmation from other indicators like MACD or a break of support is needed.
How will the DXY's current level of 99.39 affect Nasdaq100 this week?
The DXY at 99.39, showing strength on shorter timeframes, could exert downward pressure on the Nasdaq100. If the dollar continues to strengthen, it may reinforce the bearish scenario for equities by increasing the cost of capital and reducing risk appetite.
The path forward for the Nasdaq100 hinges on its ability to navigate the current technical crosscurrents and macroeconomic uncertainties. While short-term indicators offer flickers of hope for the bulls, the dominant daily trend and persistent inflation concerns lend weight to the bearish outlook. The $23,956.74 support level is the immediate line in the sand; a decisive break here could confirm the bears' thesis. Conversely, a strong push above $24,230.28, backed by improving risk sentiment and a softening dollar, could reignite the bullish narrative. For now, patience and careful risk management are paramount. As the market digests incoming economic data and geopolitical developments, the next few trading sessions will be critical in defining the Nasdaq100's trajectory.
Track markets in real-time
AI-powered analysis, technical indicators and real-time price data.
Join Our Telegram Channel
Breaking market news, AI analysis and trading signals instantly.
Join Channel