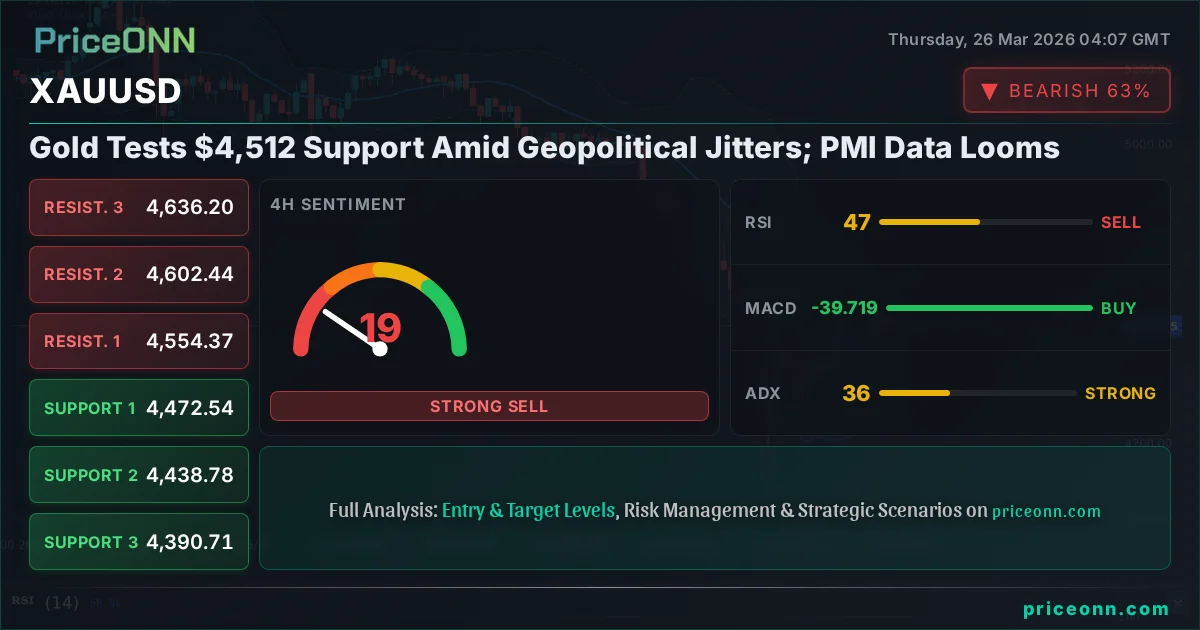
Gold Tests $4,512 Support Amid Geopolitical Jitters; PMI Data Looms
XAUUSD hovers near $4,512.31 as geopolitical tensions rise and traders await crucial PMI data. Technical indicators show mixed signals, with ADX pointing to a weak trend.
The geopolitical landscape is once again casting a long shadow over global markets, and gold, the perennial safe haven, is finding itself at a critical juncture. As traders eye the $4,512.31 level, a complex interplay of shifting risk appetites, looming economic data, and persistent geopolitical tensions is shaping the immediate outlook for the precious metal. While recent headlines suggest a potential de-escalation in some areas, the underlying fragility of the global order means that volatility remains a key characteristic of the current trading environment. This analysis delves into the confluence of factors influencing XAUUSD, from the strength of the dollar to the subtle whispers in technical indicators, aiming to provide a clear roadmap for navigating these choppy waters.
- XAUUSD is currently trading at $4,512.31, hovering near key support levels amid geopolitical uncertainty.
- The Dollar Index (DXY) at 99.4 shows strength, typically pressuring gold prices, but other factors are at play.
- Technical indicators present a mixed picture: ADX at 17.72 suggests a weak trend on the 1H chart, while the 4H shows a stronger downward trend (ADX: 35.95).
- Upcoming PMI data releases for USD and EUR will be crucial in shaping the short-term direction.
- Geopolitical developments, particularly concerning oil prices and potential de-escalations, are closely watched for their impact on safe-haven demand.
Navigating Geopolitical Crosscurrents
The narrative surrounding gold prices is rarely a simple one, and the current environment is no exception. While recent news hinted at potential diplomatic breakthroughs, the specter of escalating conflicts, particularly in the Middle East, continues to underpin demand for safe-haven assets. This delicate balance means that any perceived easing of tensions can quickly be overshadowed by renewed uncertainty, creating a volatile trading environment for commodities like gold. We saw this play out recently, with reports suggesting a potential ceasefire impacting oil prices, which in turn can influence inflation expectations and, consequently, gold's appeal. However, the underlying geopolitical risks remain, acting as a constant, albeit fluctuating, support for the yellow metal.
The current price of XAUUSD at $4,512.31 reflects this ongoing tug-of-war. On one hand, the market is attempting to price in a more stable geopolitical outlook, which would typically weigh on gold. On the other hand, the sheer scale of potential disruptions, coupled with persistent inflation concerns that central banks are still grappling with, provides a floor for gold. It’s this inherent tension that makes precise forecasting challenging but also presents opportunities for astute traders who can identify shifts in market sentiment.
The Dollar's Influence and Intermarket Dynamics
No discussion of gold is complete without examining the role of the US Dollar Index (DXY). With the DXY currently trading at 99.4, its strength acts as a significant headwind for dollar-denominated assets like gold. A stronger dollar generally makes gold more expensive for holders of other currencies, potentially dampening demand. The DXY’s upward trend on the 1H and 1D charts suggests this pressure could persist, especially if risk appetite wanes and investors flock to the perceived safety of the greenback. The 1H chart shows the DXY at 99.4, with RSI at 65.63, indicating a positive momentum that could continue to challenge gold’s ascent.
However, the relationship isn't always perfectly inverse. Geopolitical events can sometimes cause both the dollar and gold to rally simultaneously as investors seek refuge in perceived safe havens. Currently, the DXY is showing a strong uptrend on the 1H and 1D charts, with ADX readings around 31.32 on the daily chart indicating a robust trend. This makes the $4,512.31 price of gold particularly sensitive. If the DXY continues its march higher, it will require significant buying pressure from other factors to keep gold prices elevated. Conversely, any sign of dollar weakness, perhaps triggered by shifting Federal Reserve expectations or improved global risk sentiment, could provide a significant tailwind for XAUUSD.
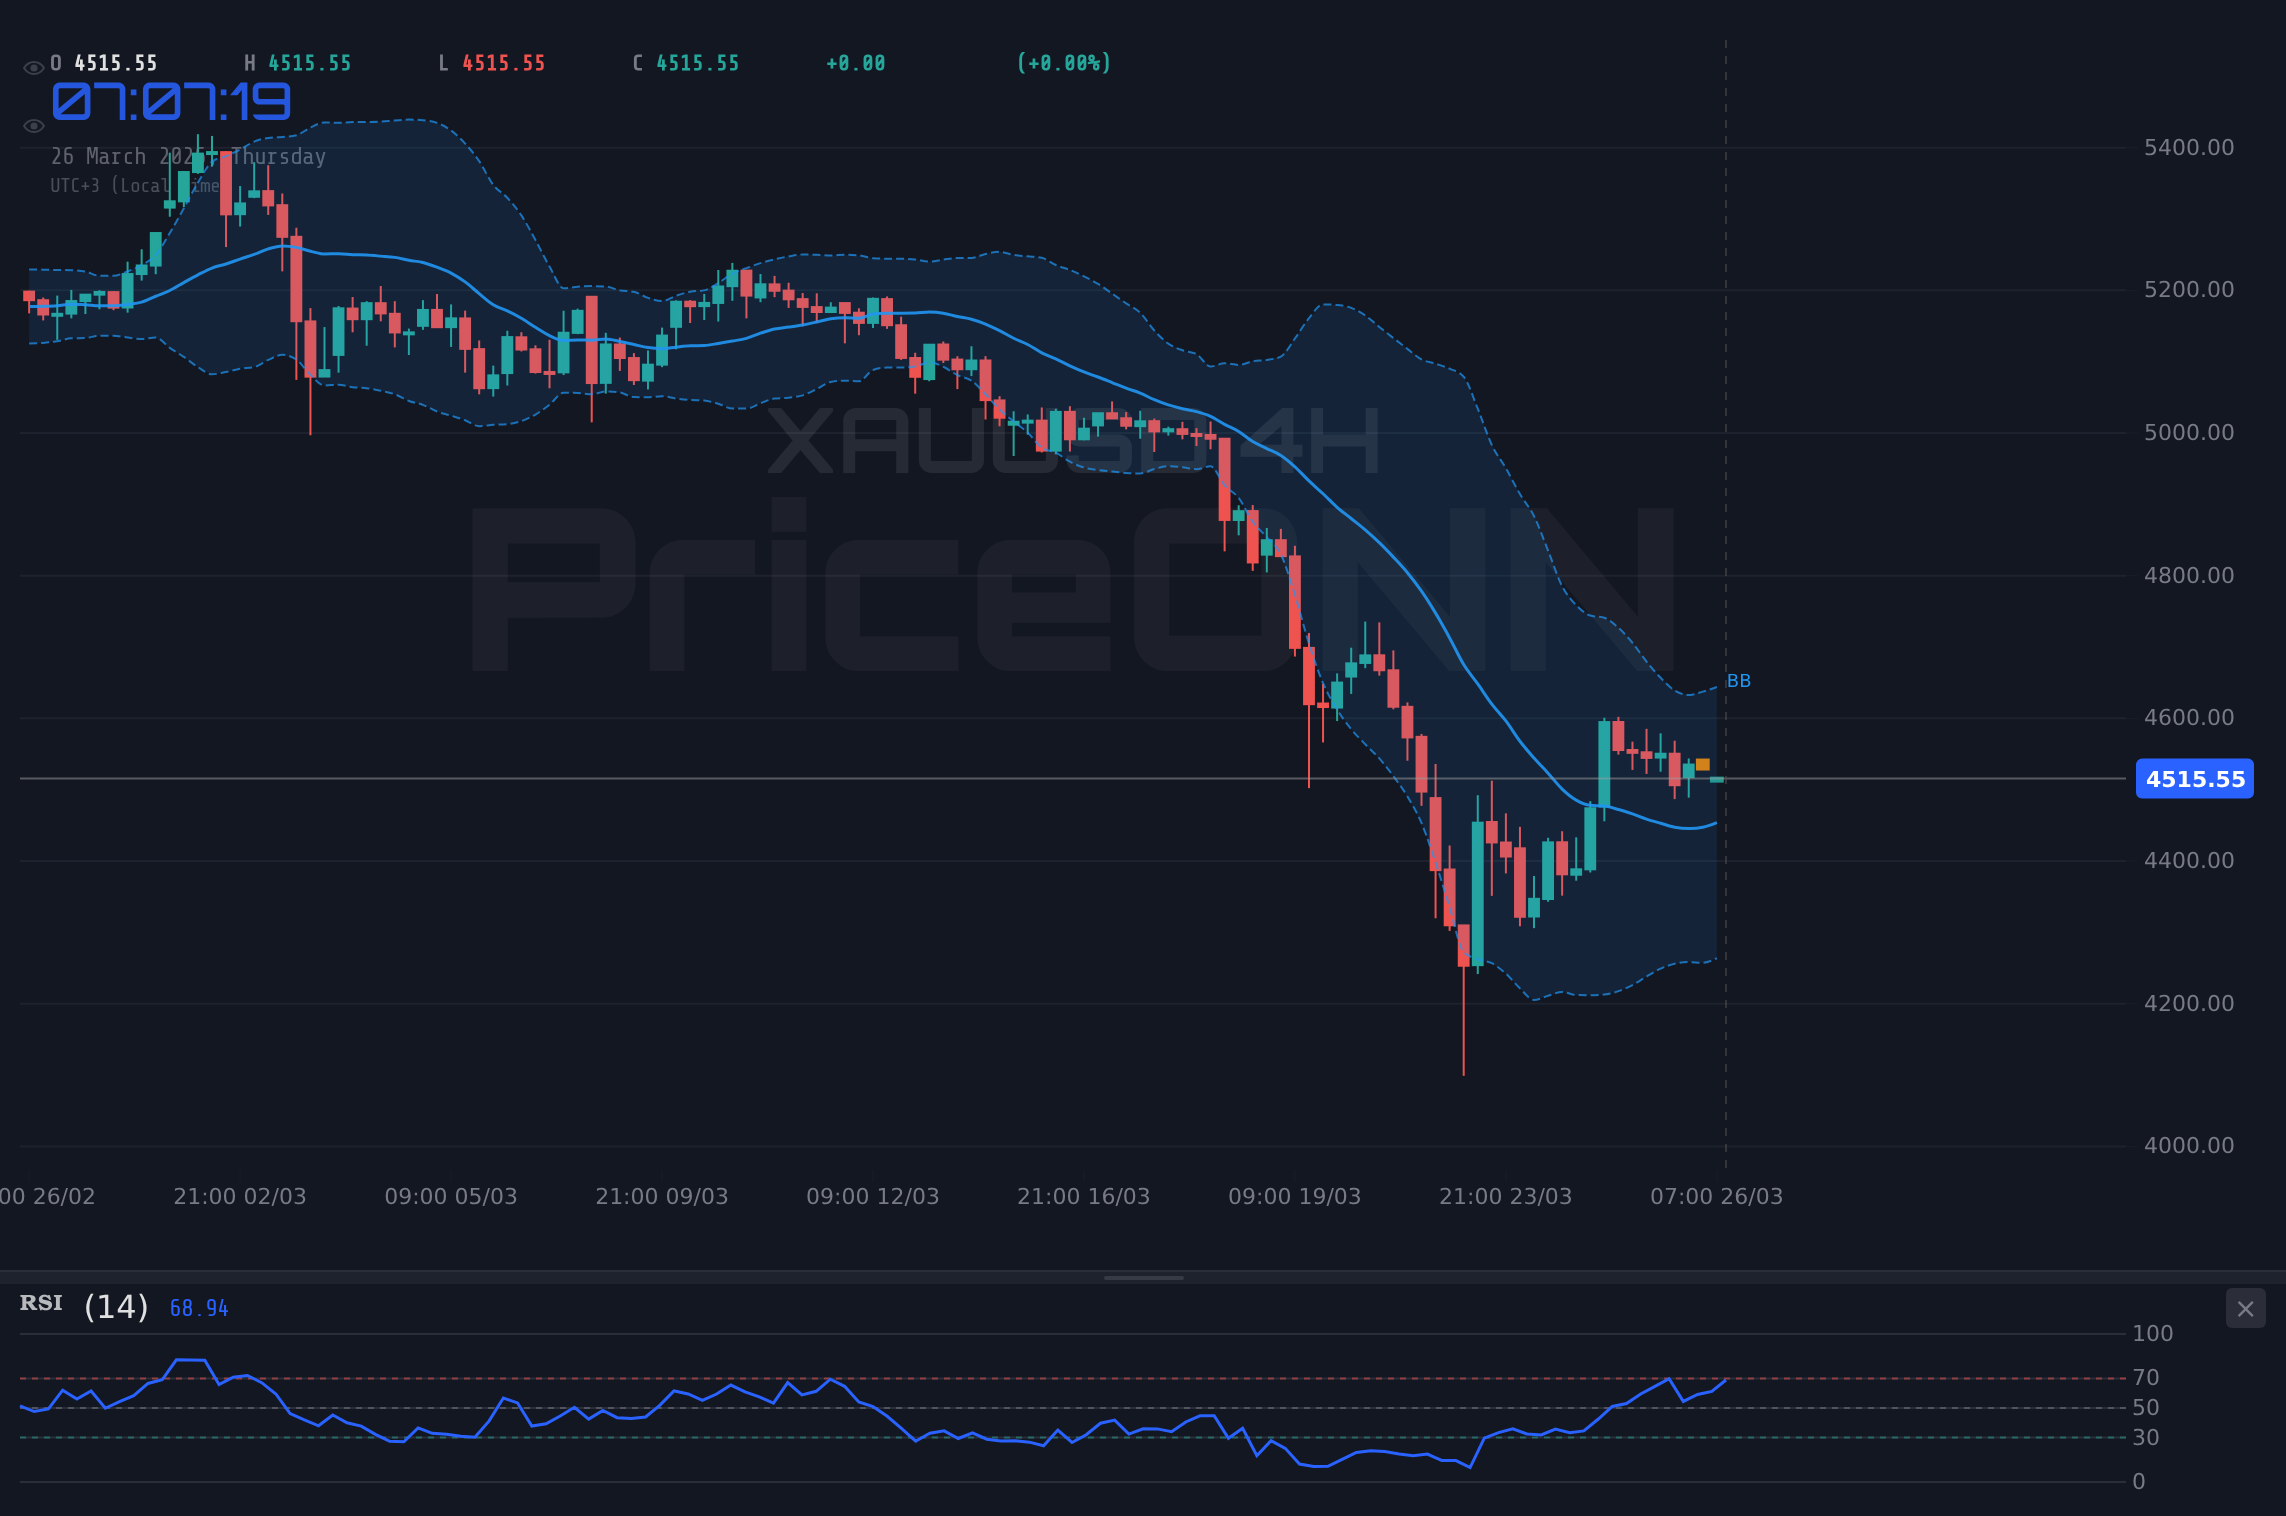
Technical Picture: A Tale of Two Timeframes
Examining the technical indicators for XAUUSD reveals a nuanced picture, with different timeframes offering conflicting signals. On the 1-hour chart, the trend is neutral with a strength of 50%, and indicators like RSI at 47.91 suggest a slight downward bias. MACD shows negative momentum, and prices are trading below the middle Bollinger Band, pointing towards potential short-term weakness. Stochastic, however, offers a sliver of hope with a reading of K=39.02 and D=36.72, indicating a potential upward signal as %K crosses above %D. The ADX at 17.72 reinforces the idea of a weak, indecisive trend in the immediate term.
Contrast this with the 4-hour chart. Here, the trend is still neutral but shows a stronger downward trend as indicated by ADX 35.95. RSI at 46.67 continues to lean bearish, and Stochastic is showing a bearish signal (%K < %D). However, MACD is displaying positive momentum, and prices are trading above the middle Bollinger Band, hinting at upward potential. This divergence between timeframes suggests consolidation is likely in the short term, with traders needing to watch for a clear break of either support or resistance levels to establish a more defined direction. The general signal on the 1H is SELL (2 Buy, 6 Sell, 0 Neutral), and on the 4H is also SELL (3 Buy, 5 Sell, 0 Neutral), indicating a bearish leaning across shorter timeframes.
The daily chart paints an even clearer, albeit concerning, picture for gold bulls. The trend is definitively downwards with a strength of 90%, and ADX at 29.06 confirms a strong bearish trend. RSI at 33.63 hovers in the lower neutral territory, suggesting room for further downside before becoming oversold. MACD is firmly in negative momentum territory, below its signal line, and prices are hugging the lower Bollinger Band. Stochastic, in a rare bullish sign on this timeframe, shows %K > %D, but its overall reading is still in the lower range. The overwhelming signal on the daily chart is SELL (2 Buy, 6 Sell, 0 Neutral), underscoring the prevailing bearish sentiment in the longer term. This conflict between shorter-term potential bounces and the dominant daily downtrend is the core of the current market tension.
Economic Calendar: Key Data on the Horizon
As we navigate this complex market environment, the upcoming economic calendar holds significant sway, particularly for gold and currency markets. The focus will undoubtedly be on Purchasing Managers' Index (PMI) data from major economies. For the US, the latest PMI figures are expected to show a slight contraction in manufacturing activity, with the actual figure anticipated at 52.4 against a forecast of 51.5. While this is still above the 50 mark separating expansion from contraction, any significant deviation could trigger volatility. Similarly, the Eurozone’s PMI data will be closely watched; the forecast for manufacturing PMI is 52, with the previous reading at 51.7. A weaker-than-expected reading from either region could dampen risk appetite and potentially boost gold prices as a safe-haven alternative.
Furthermore, the release of US Nonfarm Payrolls data, previously reported at 205,000 with a forecast of 211,000, will provide crucial insights into the labor market's health. Stronger-than-expected employment figures could reinforce expectations of tighter monetary policy from the Federal Reserve, potentially strengthening the dollar and pressuring gold. Conversely, a weaker report might fuel speculation of a Fed pivot, which could support gold. The interplay between inflation expectations, labor market strength, and central bank policy remains the dominant fundamental driver, and these upcoming data releases will offer critical clues.
The Strategic Outlook: Levels to Watch
For traders looking to position themselves in XAUUSD, understanding the key support and resistance levels is paramount. On the 1-hour chart, immediate support is seen at $4,497.76, followed by $4,486.77 and $4,467.87. Resistance lies at $4,527.65, $4,546.55, and $4,557.54. These levels indicate a tight trading range in the very short term.
However, the longer-term daily chart presents more significant levels. Support is established at $4,440.66, $4,375.01, and $4,294.28. Crucially, the current price of $4,512.31 sits just above the 1-hour support of $4,497.76, making it a pivotal point. A decisive break below this level could accelerate selling towards the daily support. On the resistance side, the $4,527.65 level on the 1H chart is the immediate hurdle, with the daily resistance at $4,587.04 representing a more significant barrier. A sustained move above $4,587.04 would be required to challenge the prevailing bearish sentiment on the daily timeframe.
Bearish Scenario: Testing the Lower Bounds
65% ProbabilityConsolidation Scenario: Range-Bound Trading
25% ProbabilityBullish Scenario: A Bounce from Support
10% ProbabilityFrequently Asked Questions: XAUUSD Analysis
What happens if XAUUSD breaks below the $4,497.76 support level?
A break below $4,497.76 on the 1-hour chart would invalidate the short-term consolidation and could signal a move towards the 4-hour support at $4,472.54. This scenario is currently assigned a 65% probability, driven by the prevailing bearish sentiment on longer timeframes.
Should I buy XAUUSD at current levels around $4,512.31 given the mixed technical signals?
Buying at current levels carries risk due to the conflicting signals across timeframes and the weak trend indicated by ADX. A more prudent approach would be to wait for a confirmed break above $4,527.65 resistance for a bullish setup, or a clear break below $4,497.76 support for a bearish entry. Patience is key here, with a 25% probability assigned to range-bound trading.
Is the RSI at 47.91 on the 1H chart a sell signal for XAUUSD?
An RSI of 47.91 on the 1-hour chart is in the neutral zone and leaning towards bearish, suggesting a slight downward momentum. However, it's not an extreme oversold or overbought reading. Combined with negative MACD momentum and prices below the middle Bollinger Band, it supports a cautious stance, but a confirmed break of immediate support would be a stronger sell signal.
How will upcoming PMI data affect XAUUSD this week?
Weaker-than-expected PMI figures from the US or Eurozone could boost gold's safe-haven appeal by increasing recession fears and potentially altering central bank policy expectations. Conversely, stronger data might support the dollar and weigh on gold. Traders should monitor the actual releases closely, as they could provide the catalyst needed to break the current range.
The path forward for gold is intricately linked to the interplay of geopolitical stability, economic data, and central bank policy. While the current technical picture presents a bearish lean on longer timeframes, the immediate price action around $4,512.31 suggests a period of consolidation or a potential short-term bounce. Traders must remain vigilant, paying close attention to the $4,497.76 support level and the $4,527.65 resistance. The upcoming PMI data will be a critical test, potentially providing the clarity needed to navigate this uncertain market. Remember, disciplined risk management is paramount when facing such conflicting signals and volatile conditions. The market always offers opportunities; the key is to wait for the right setup and execute with conviction.
Technical Outlook Summary
| Indicator | Value | Signal | Interpretation |
|---|---|---|---|
| RSI (14) | 47.91 | Bearish | Neutral zone, slight downward bias on 1H. |
| MACD | Negative | Bearish | Negative momentum on 1H, below signal line. |
| Stochastic | K:39.02, D:36.72 | Bullish | Potential upward signal on 1H (%K > %D). |
| ADX | 17.72 | Weak Trend | Indicates indecisive movement on 1H. |
| Bollinger | Below Mid Band | Bearish | Suggests downward pressure on 1H. |
Track markets in real-time
AI-powered analysis, technical indicators and real-time price data.
Join Our Telegram Channel
Breaking market news, AI analysis and trading signals instantly.
Join Channel