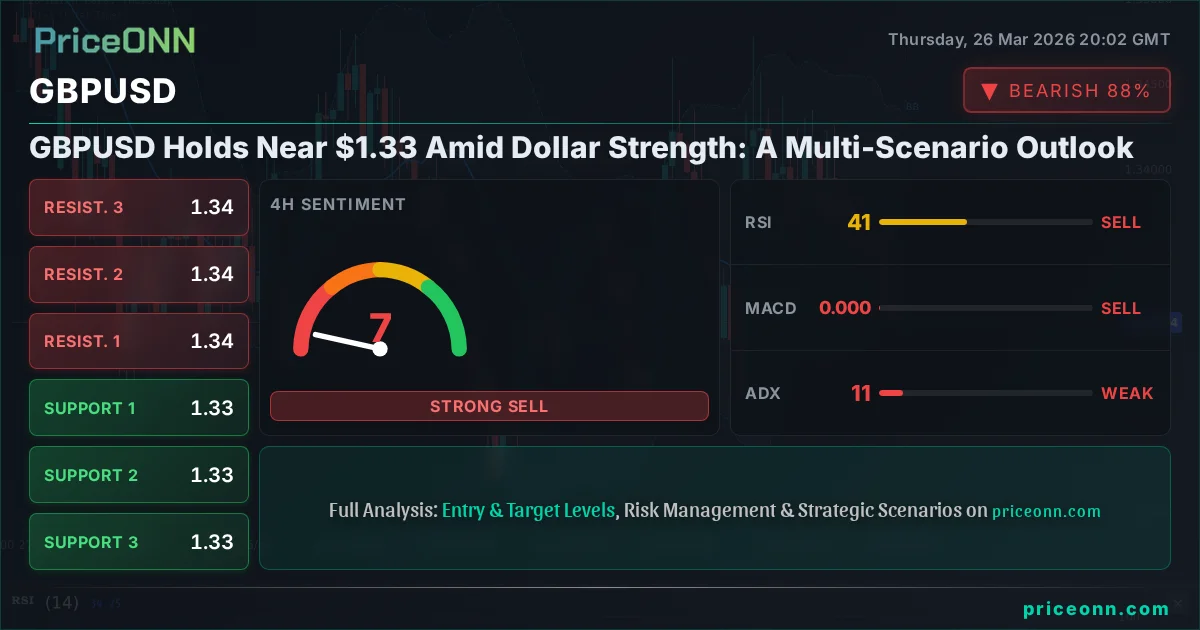
GBPUSD Holds Near $1.33 Amid Dollar Strength: A Multi-Scenario Outlook
GBPUSD hovers near $1.33 as the DXY strengthens. This analysis explores bullish, bearish, and neutral scenarios, key levels, and market drivers.
The currency pair GBPUSD is currently navigating a critical juncture, trading precisely at $1.33. This level represents more than just a price point; it's a battleground where the persistent strength of the US Dollar clashes with the resilience of the British Pound. In a market environment characterized by shifting risk sentiment and divergent central bank outlooks, understanding the forces at play around this $1.33 mark is paramount for any serious trader or investor.
- GBPUSD is trading at $1.33, with key intraday support at $1.33086 and resistance at $1.33422.
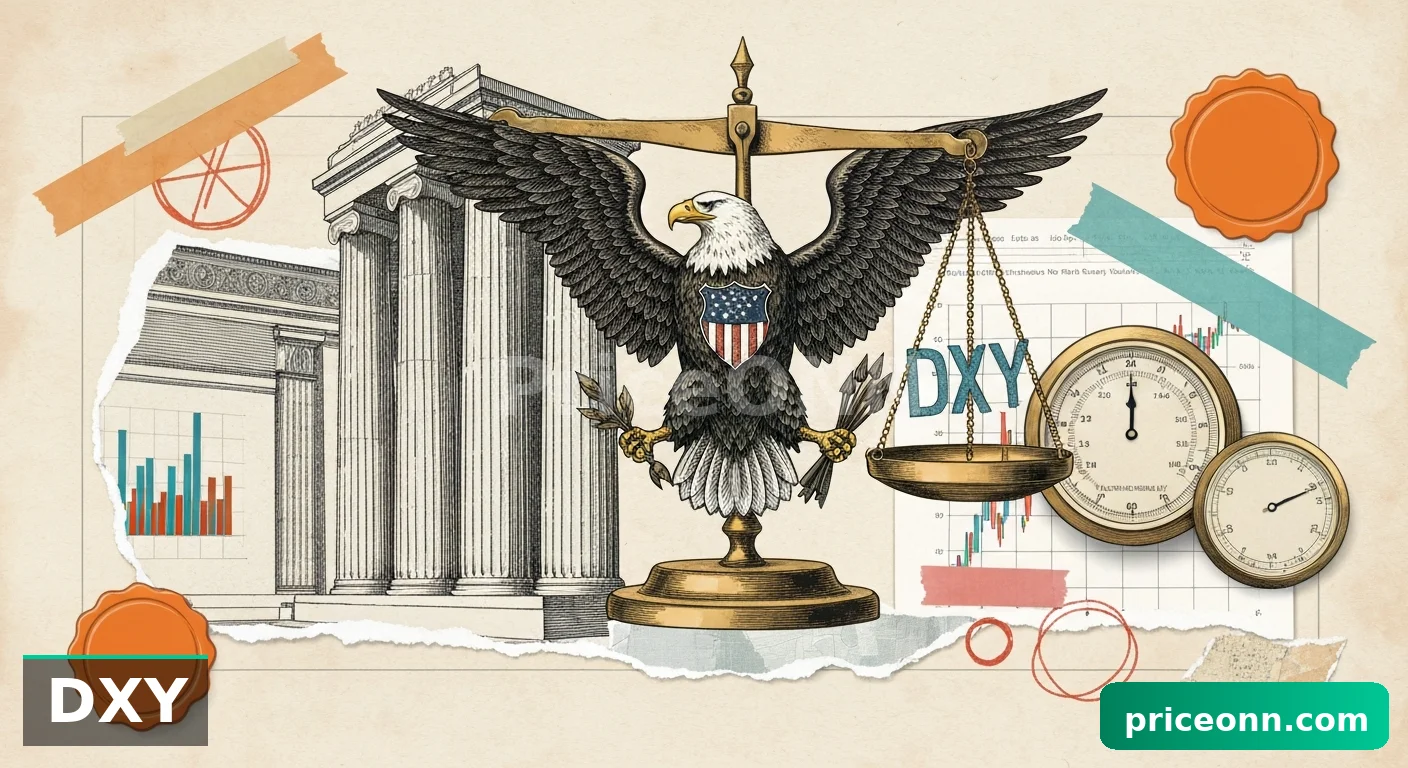
- The DXY is strong at 99.79, indicating dollar strength that typically pressures GBPUSD.
- RSI at 36.21 on the 1H chart suggests bearish momentum, while Stochastic shows an oversold condition.
- The ADX at 20.48 indicates a moderate downtrend, suggesting caution for aggressive trades.
The Battle for $1.33: Dollar Dominance vs. Pound's Stand
The US Dollar Index (DXY) has been a dominant force recently, currently standing at 99.79. This strength is a significant headwind for GBPUSD, as a stronger dollar typically translates to a weaker pound. Historically, when the DXY strengthens, pairs like GBPUSD tend to face downward pressure due to the inverse correlation. The current DXY reading suggests that market participants are favoring the dollar, likely driven by a combination of global risk aversion and expectations surrounding Federal Reserve policy. This broad-based dollar strength creates a challenging environment for Sterling.
On the GBPUSD chart, the 1-hour timeframe reveals immediate support at $1.33086 and resistance at $1.33422. The technical indicators paint a mixed but predominantly bearish picture for the short term. The RSI(14) is hovering at 36.21, well within the neutral zone but leaning towards oversold territory, indicating that selling momentum might be waning but the downtrend is still intact. The Stochastic Oscillator, with %K at 6.39 and %D at 36.16, clearly signals a bearish trend and is approaching oversold conditions, suggesting potential for a short-term bounce but not necessarily a trend reversal. The ADX, at 20.48, indicates a moderate downtrend, meaning that while a trend exists, it's not yet overwhelmingly strong, leaving room for volatility and potential reversals.
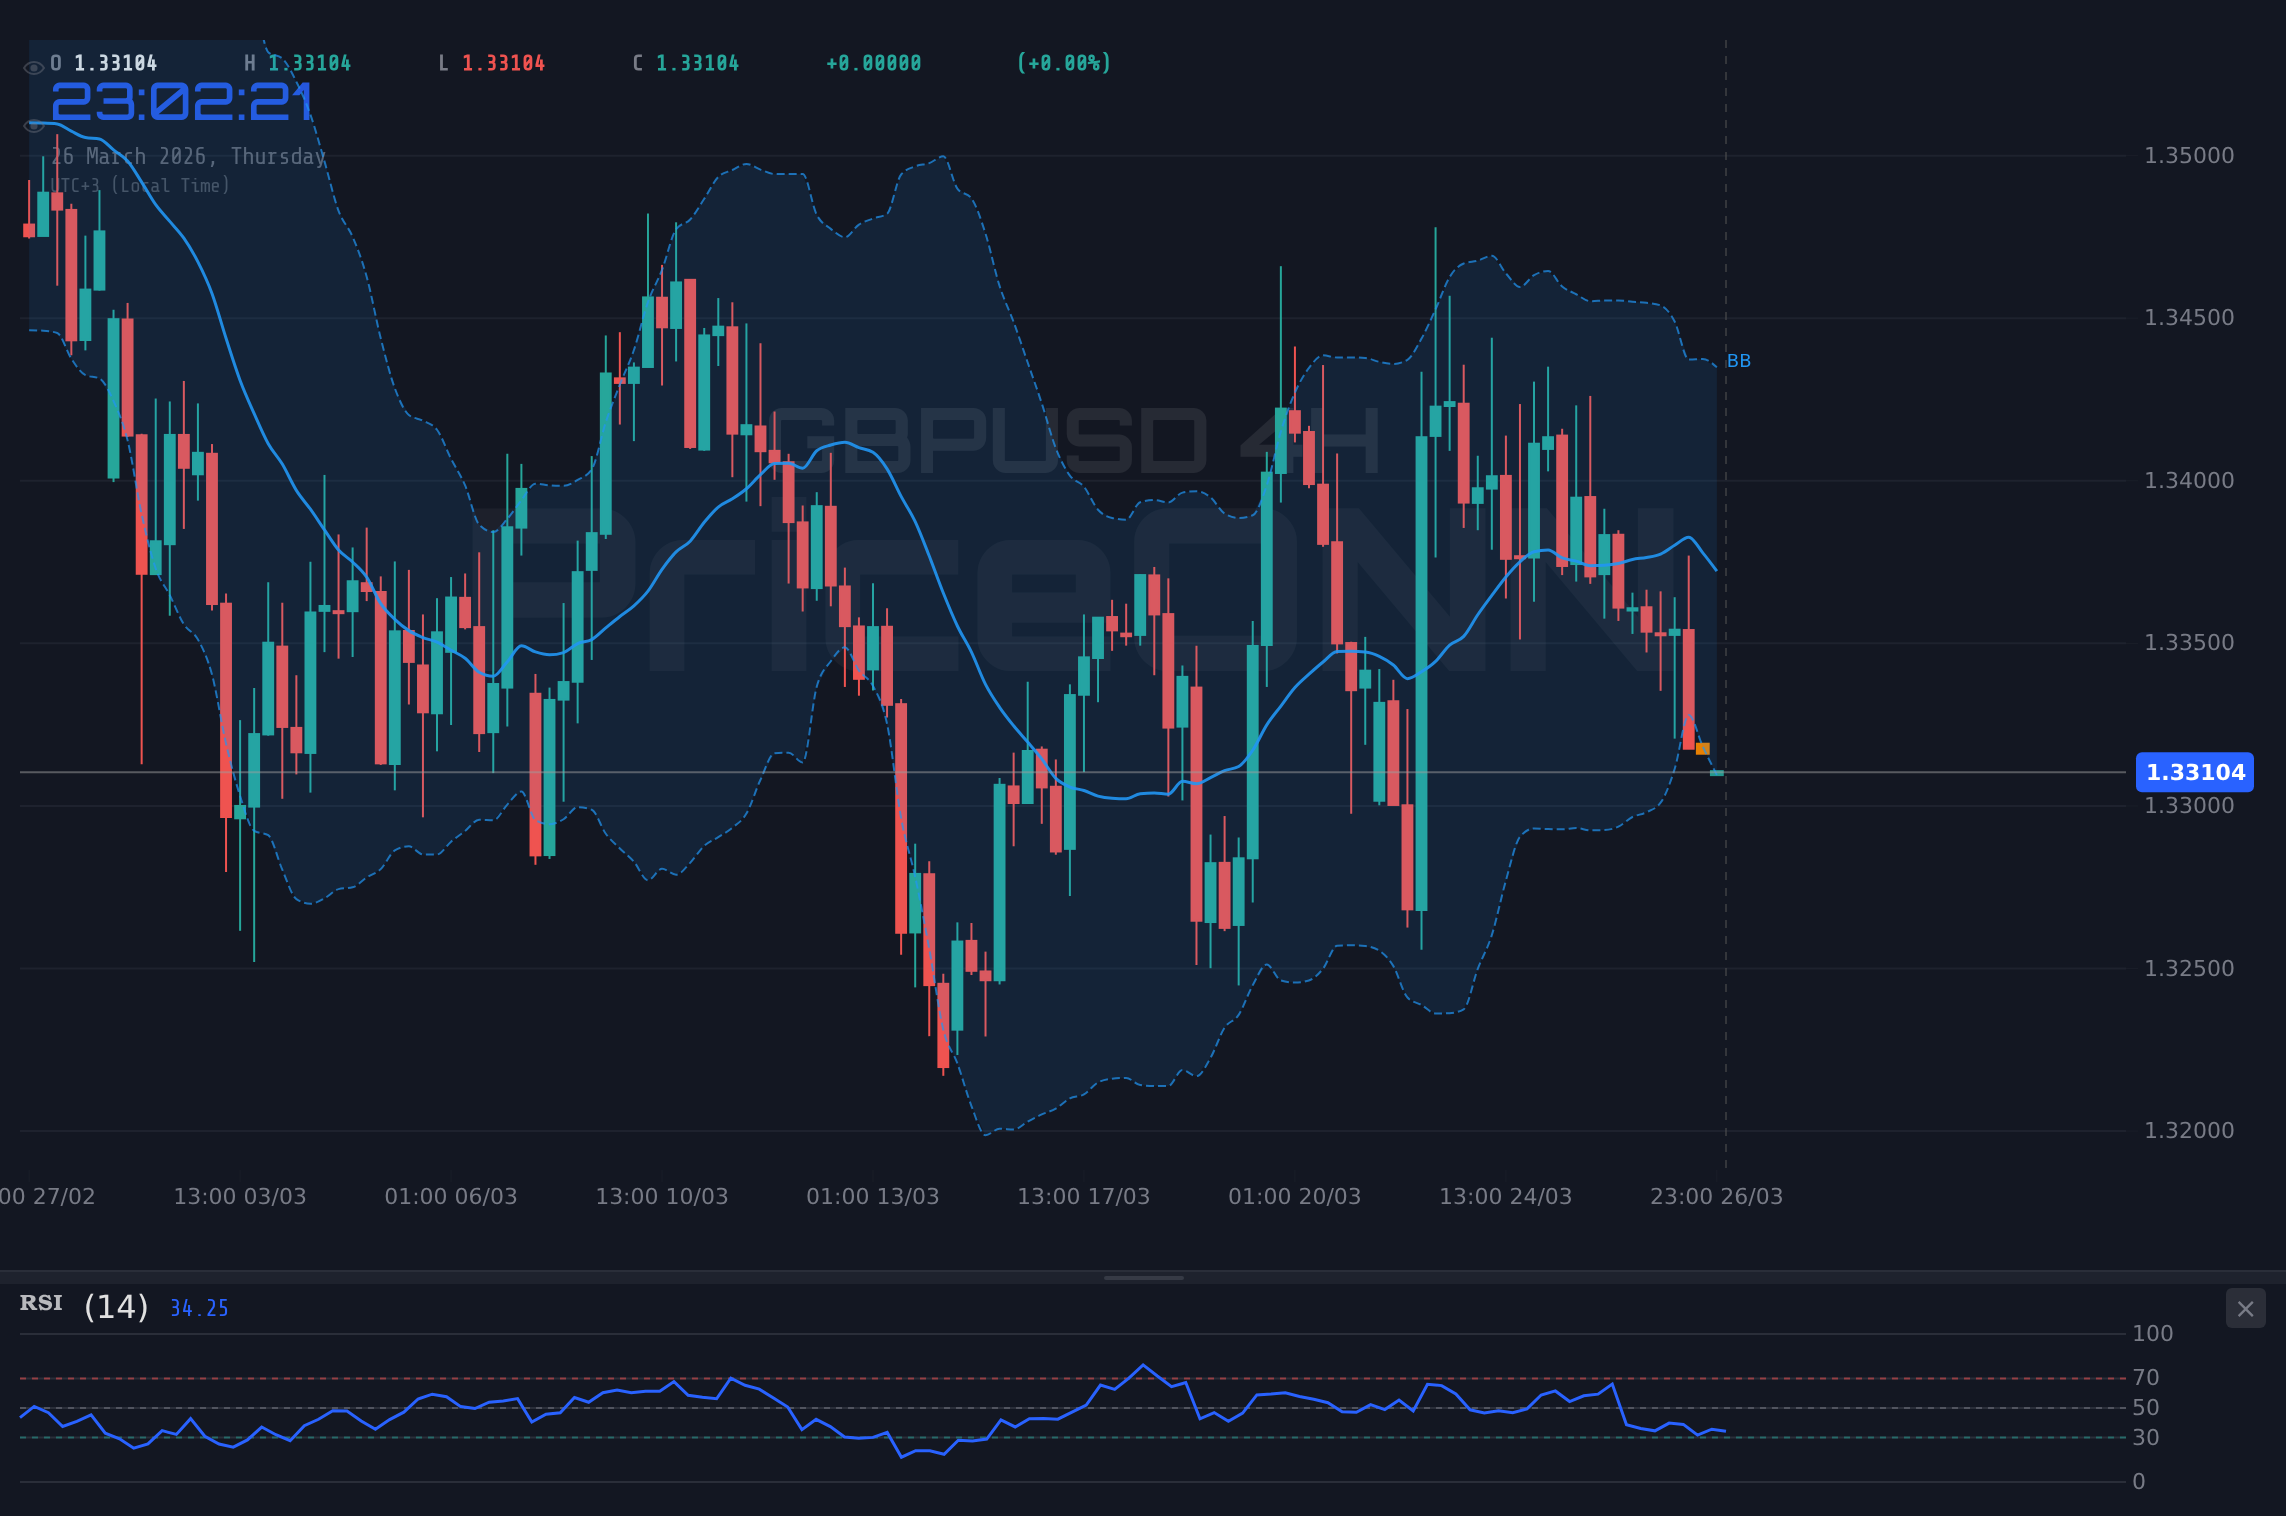
The 4-hour chart offers a slightly different perspective, showing a neutral trend with 50% strength, but the overall signal remains 'SELL'. Support levels are identified at $1.33285, $1.33029, and $1.3285, with resistance at $1.3372, $1.33899, and $1.34155. The RSI here is at 40.55, still in the neutral zone and indicating a bearish inclination. However, the Stochastic Oscillator %K at 16.41 and %D at 16.5 is deeply oversold, hinting at a potential short-term bottoming process. The ADX at 11.28 signifies a weak trend, confirming the choppiness and range-bound nature of this timeframe. This divergence between the stronger dollar sentiment and the oversold conditions on intraday charts creates a complex trading landscape.
The Bull's Roadmap: Reclaiming the $1.3350 Level
For a bullish scenario to gain traction, GBPUSD needs to overcome immediate resistance and demonstrate sustained buying pressure. The first critical hurdle is the $1.33422 resistance level on the 1-hour chart. A decisive break and close above this level, ideally accompanied by increasing trading volume, would signal a potential shift in short-term momentum. Following this, the next significant resistance to watch would be $1.3372 on the 4-hour chart. If bulls can successfully push price above this level, it could open the door for a move towards the $1.3400 handle, a psychologically important level and a key resistance zone.
The conditions for this bullish scenario to unfold are multi-faceted. Firstly, a pullback in the DXY from its current highs would be a major catalyst. If the dollar index shows signs of topping out or reversing, it would immediately alleviate pressure on GBPUSD. Secondly, positive economic data from the UK, particularly any signs of cooling inflation or a surprisingly resilient labor market, could bolster Sterling. While the current data does not strongly support this, unexpected positive surprises could trigger such a move. Thirdly, a shift in global risk sentiment towards 'risk-on' would also benefit GBPUSD, as it tends to move inversely to safe-haven assets and positively with risk appetite.
Looking at the technical indicators, for this bullish case to solidify, we would need to see a confluence of signals. The RSI would need to climb decisively above 50, ideally breaking into bullish territory above 60. The Stochastic Oscillator should complete its oversold bounce and ideally form a bullish crossover above 20, then push towards 50. Crucially, the ADX would need to show a strengthening trend, ideally moving above 20 and showing directional conviction. A close above the 1-hour resistance at $1.33422 and subsequently the 4-hour resistance at $1.3372 would be the primary technical triggers. The ultimate target in this scenario, assuming broader market conditions improve and UK data surprises positively, could extend towards the daily resistance levels, potentially targeting $1.34155, and if momentum sustains, even $1.349.
The Bull's Charge: Reclaiming Higher Ground
15% ProbabilityWhere Bears Take Control: Testing the $1.3280 Support
The bearish scenario appears more probable given the current market setup, characterized by a strong dollar and risk-off sentiment. The immediate downside target is the 1-hour support level at $1.33086. A breach of this level would likely accelerate selling pressure, pushing GBPUSD towards the next significant support on the 1-hour chart at $1.3285. If this level also gives way, the focus would shift to the 4-hour support at $1.3285, a level that has acted as a floor previously. A break below $1.3285 would confirm a bearish continuation, potentially opening the path towards the $1.3250 psychological level and further down to the daily support at $1.32554.
The conditions that would favor this bearish outlook include the continued strength of the DXY, potentially driven by hawkish rhetoric from the Federal Reserve or escalating geopolitical tensions that increase demand for the dollar as a safe haven. Any signs of economic weakness in the UK, such as disappointing inflation data (suggesting the Bank of England might need to consider rate cuts sooner rather than later) or a deterioration in employment figures, would further weigh on Sterling. The ongoing geopolitical tensions, such as those mentioned in recent news regarding oil tankers and Middle East conflicts, often contribute to a 'risk-off' environment, benefiting the dollar and pressuring riskier currencies like GBP.
Technically, the bearish scenario would be confirmed by a failure to hold the $1.33086 support. This would likely be accompanied by RSI remaining below 40 and MACD showing sustained negative momentum. Stochastic should remain in oversold territory or complete a bearish crossover below 50. The ADX, which is already indicating a downtrend, would likely strengthen further, moving above 25. A decisive break below $1.33086, followed by a close below $1.3285, would be the key technical triggers. The targets in this scenario would be the immediate support levels, moving towards $1.3285, then $1.32554, and potentially testing the lower bounds of the 4-hour range near $1.3200 if the selling pressure intensifies significantly.
The Bear's Grip: Testing Lower Support Levels
65% ProbabilityThe Waiting Game: Consolidation Around $1.33
A neutral scenario, where GBPUSD remains largely range-bound around the $1.33 mark, is also a distinct possibility, especially if conflicting signals prevent a clear directional move. This could occur if the DXY stalls its ascent without a significant pullback, and UK economic data remains mixed, offering neither strong support nor significant weakness for Sterling. In such a scenario, price action might oscillate between the immediate support and resistance levels identified on the 1-hour chart ($1.33086 - $1.33422).
The technical indicators can often reflect this consolidation. The RSI might hover stubbornly in the 40-60 range, refusing to move decisively into overbought or oversold territory. The MACD could remain close to the zero line, with its histogram fluctuating between small positive and negative values, indicating a lack of strong momentum. Stochastic might oscillate within the oversold or overbought zones without completing clear crossovers, or it could move sideways without strong directional bias. The ADX reading would likely remain low, below 20, signifying a lack of a strong trend. This 'waiting game' often precedes a more significant move, as market participants gather more information or wait for clearer catalysts.
For consolidation to persist, key economic events would need to be relatively neutral or have their impact absorbed by the market. For instance, if upcoming UK inflation figures come in exactly as forecasted, or if Fed statements offer no new hawkish surprises, the market might lack the impetus for a significant breakout in either direction. Geopolitical events that do not significantly alter risk sentiment could also contribute to this stalemate. In this range-bound environment, traders might look for opportunities at the edges of the range - buying near support and selling near resistance, albeit with tighter stop-losses due to the increased risk of whipsaws in a choppy market.
The Sideways Shuffle: Range-Bound Trading
20% ProbabilityThe Most Likely Path and Key Triggers to Watch
Considering the prevailing market conditions - a strong DXY at 99.79, ongoing geopolitical concerns contributing to a risk-off sentiment, and mixed technical signals on GBPUSD - the bearish scenario holds the highest probability at 65%. The dollar's strength is a formidable force, and without clear catalysts for Sterling to strengthen or for the dollar to weaken significantly, the path of least resistance for GBPUSD appears to be downwards. The technical indicators on the shorter timeframes (1H and 4H) also lean bearish, with RSI and Stochastic showing downward momentum or oversold conditions that could precede further declines rather than reversals.
However, the presence of significant support levels and the potential for oversold bounces cannot be ignored. The 4-hour chart's ADX of 11.28 suggests that the market lacks strong directional conviction, meaning that while a downtrend is favored, sharp reversals or consolidations are possible. The key is to monitor the triggers that would either confirm the bearish thesis or invalidate it. A decisive break below $1.33086 would be the primary signal for the bearish scenario, while a sustained move above $1.33422, especially if accompanied by a pullback in the DXY, would signal a potential shift towards the neutral or even bullish outlook.
What I'm watching closely this week includes: Firstly, the trajectory of the DXY. Any significant pullback from current levels around 99.79 would be a major development for GBPUSD. Secondly, UK economic data releases. While today's calendar was light, upcoming employment or inflation figures could provide the necessary catalyst for Sterling. Finally, the price action around the $1.33086 support level. A failure to hold this level could initiate the most probable bearish move. Conversely, holding this level and seeing a bounce could lead to a retest of higher resistance levels, although the broader dollar strength makes sustained upside challenging.
Frequently Asked Questions: GBPUSD Analysis
What happens if GBPUSD breaks below the $1.33086 support level?
A break below $1.33086 would likely trigger further selling pressure, confirming the bearish scenario. The next key downside target would be the $1.3285 support level, with potential extension towards $1.32554 if momentum accelerates.
Should I consider buying GBPUSD at current levels near $1.33 given the oversold Stochastic signal?
While the oversold Stochastic on the 1H and 4H charts suggests potential for a short-term bounce, the overall bearish trend and strong DXY make it a risky proposition. A confirmed bullish trigger, such as a break above $1.33422 coupled with a DXY pullback, would be needed for a more confident entry, carrying a lower probability (15%).
Is the RSI at 36.21 a reliable sell signal for GBPUSD right now?
An RSI of 36.21 indicates bearish momentum but is not yet in extreme oversold territory. It suggests that the downtrend is intact but doesn't necessarily signal an immediate, strong sell entry on its own. Confirmation from other indicators and price action, like a break below support, is crucial.
How will continued DXY strength around 99.79 impact GBPUSD's outlook this week?
Continued DXY strength around 99.79 exerts significant downward pressure on GBPUSD, reinforcing the bearish scenario. It suggests that the dollar remains the preferred safe-haven currency, making it challenging for Sterling to find sustained upside momentum without a clear reversal in the dollar index.
Track markets in real-time
AI-powered analysis, technical indicators and real-time price data.
Join Our Telegram Channel
Breaking market news, AI analysis and trading signals instantly.
Join Channel