NZDUSD Drops to $0.57729: Key Levels Under Pressure as Risk Dims
NZDUSD is trading at $0.57729 after a 0.56% daily drop. With risk sentiment souring and key technical indicators flashing caution, attention turns to critical support levels. Is a further decline imminent?
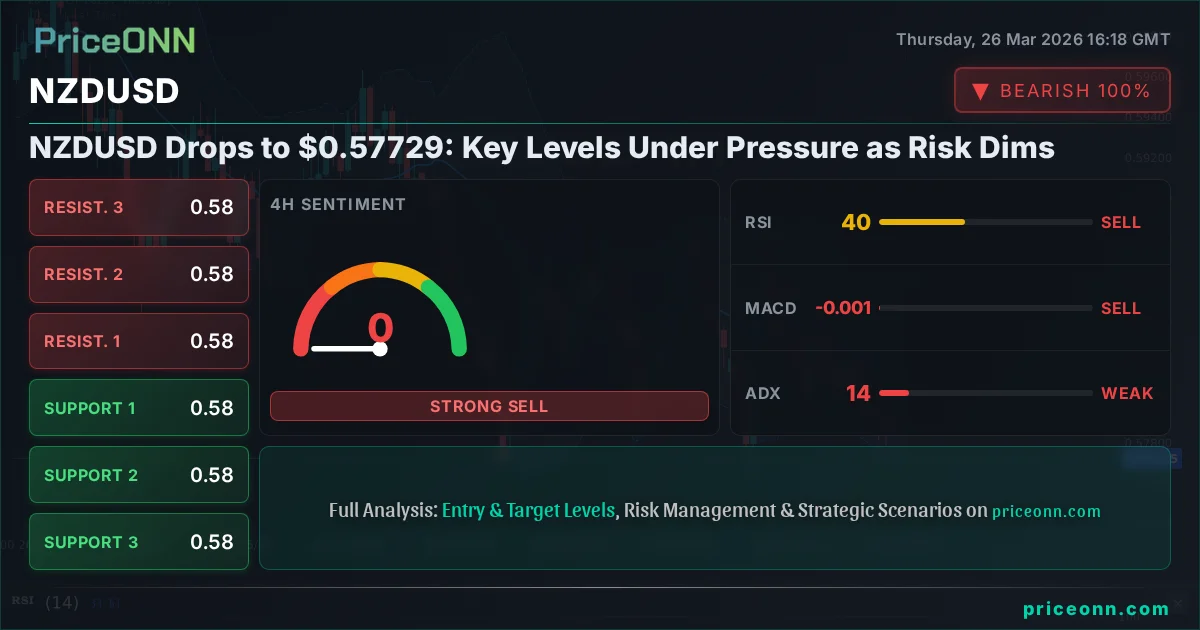
The New Zealand Dollar is facing significant headwinds, currently trading at precisely $0.57729, down 0.56% on the day. This move comes as broader market sentiment shifts towards risk aversion, a dynamic that typically weighs on commodity-linked currencies like the NZD. The sharp decline in crude oil prices and a notable dip in major equity indices like the S&P 500 and Nasdaq suggest a 'risk-off' environment is taking hold, directly impacting the risk appetite for assets such as the NZDUSD pair. Examining the technical landscape on multiple timeframes reveals a consistent bearish bias, with indicators pointing towards further potential downside unless key levels are defended.
- The NZDUSD is trading at $0.57729, reflecting a 0.56% daily decline amid a risk-off market sentiment.
- Critical support for NZDUSD is currently eyed at $0.5774, a level whose breach would signal further downside.
- The ADX at 14.36 indicates a weak trend, suggesting choppiness, but the RSI at 37.25 and Stochastic's upward cross hint at potential for a short-term bounce before the downtrend resumes.
- Geopolitical tensions and rising oil prices, coupled with a strengthening DXY at 99.65, are creating a challenging environment for the Kiwi.
The current price action for NZDUSD at $0.57729 paints a picture of bearish pressure, especially when viewed against the backdrop of global market dynamics. The DXY, or Dollar Index, has climbed to 99.65, a move that historically correlates with weakness in riskier currencies and precious metals. This strengthening dollar is a significant factor, potentially exacerbating the downward trend for NZDUSD. Furthermore, the surge in Brent crude oil past $105 per barrel, while seemingly a positive for commodity currencies, is occurring within a broader context of geopolitical uncertainty and potential inflation fears. However, the market's reaction suggests that the fear element is currently outweighing the commodity price boost, leading investors to seek the safety of the dollar.
Navigating the Bearish Tide: Technical Indicators at Play
Delving into the technical indicators for NZDUSD reveals a cautious outlook. On the 1-hour chart, the trend is decidedly bearish with a strength of 93%, signaling that short-term momentum is firmly to the downside. The Relative Strength Index (RSI) at 37.25 sits in neutral territory but leans towards a bearish inclination, indicating room for further price depreciation before hitting oversold conditions. However, the Stochastic Oscillator presents a conflicting signal: its K line (25.23) has crossed above the D line (14.65), suggesting a potential short-term upward bounce. This divergence warrants attention. The Moving Average Convergence Divergence (MACD) histogram is negative and below the signal line, reinforcing the bearish momentum. The Average Directional Index (ADX) at 25.36 confirms a strong downward trend, but the Stochastic's potential for a short-term reversal cannot be ignored.
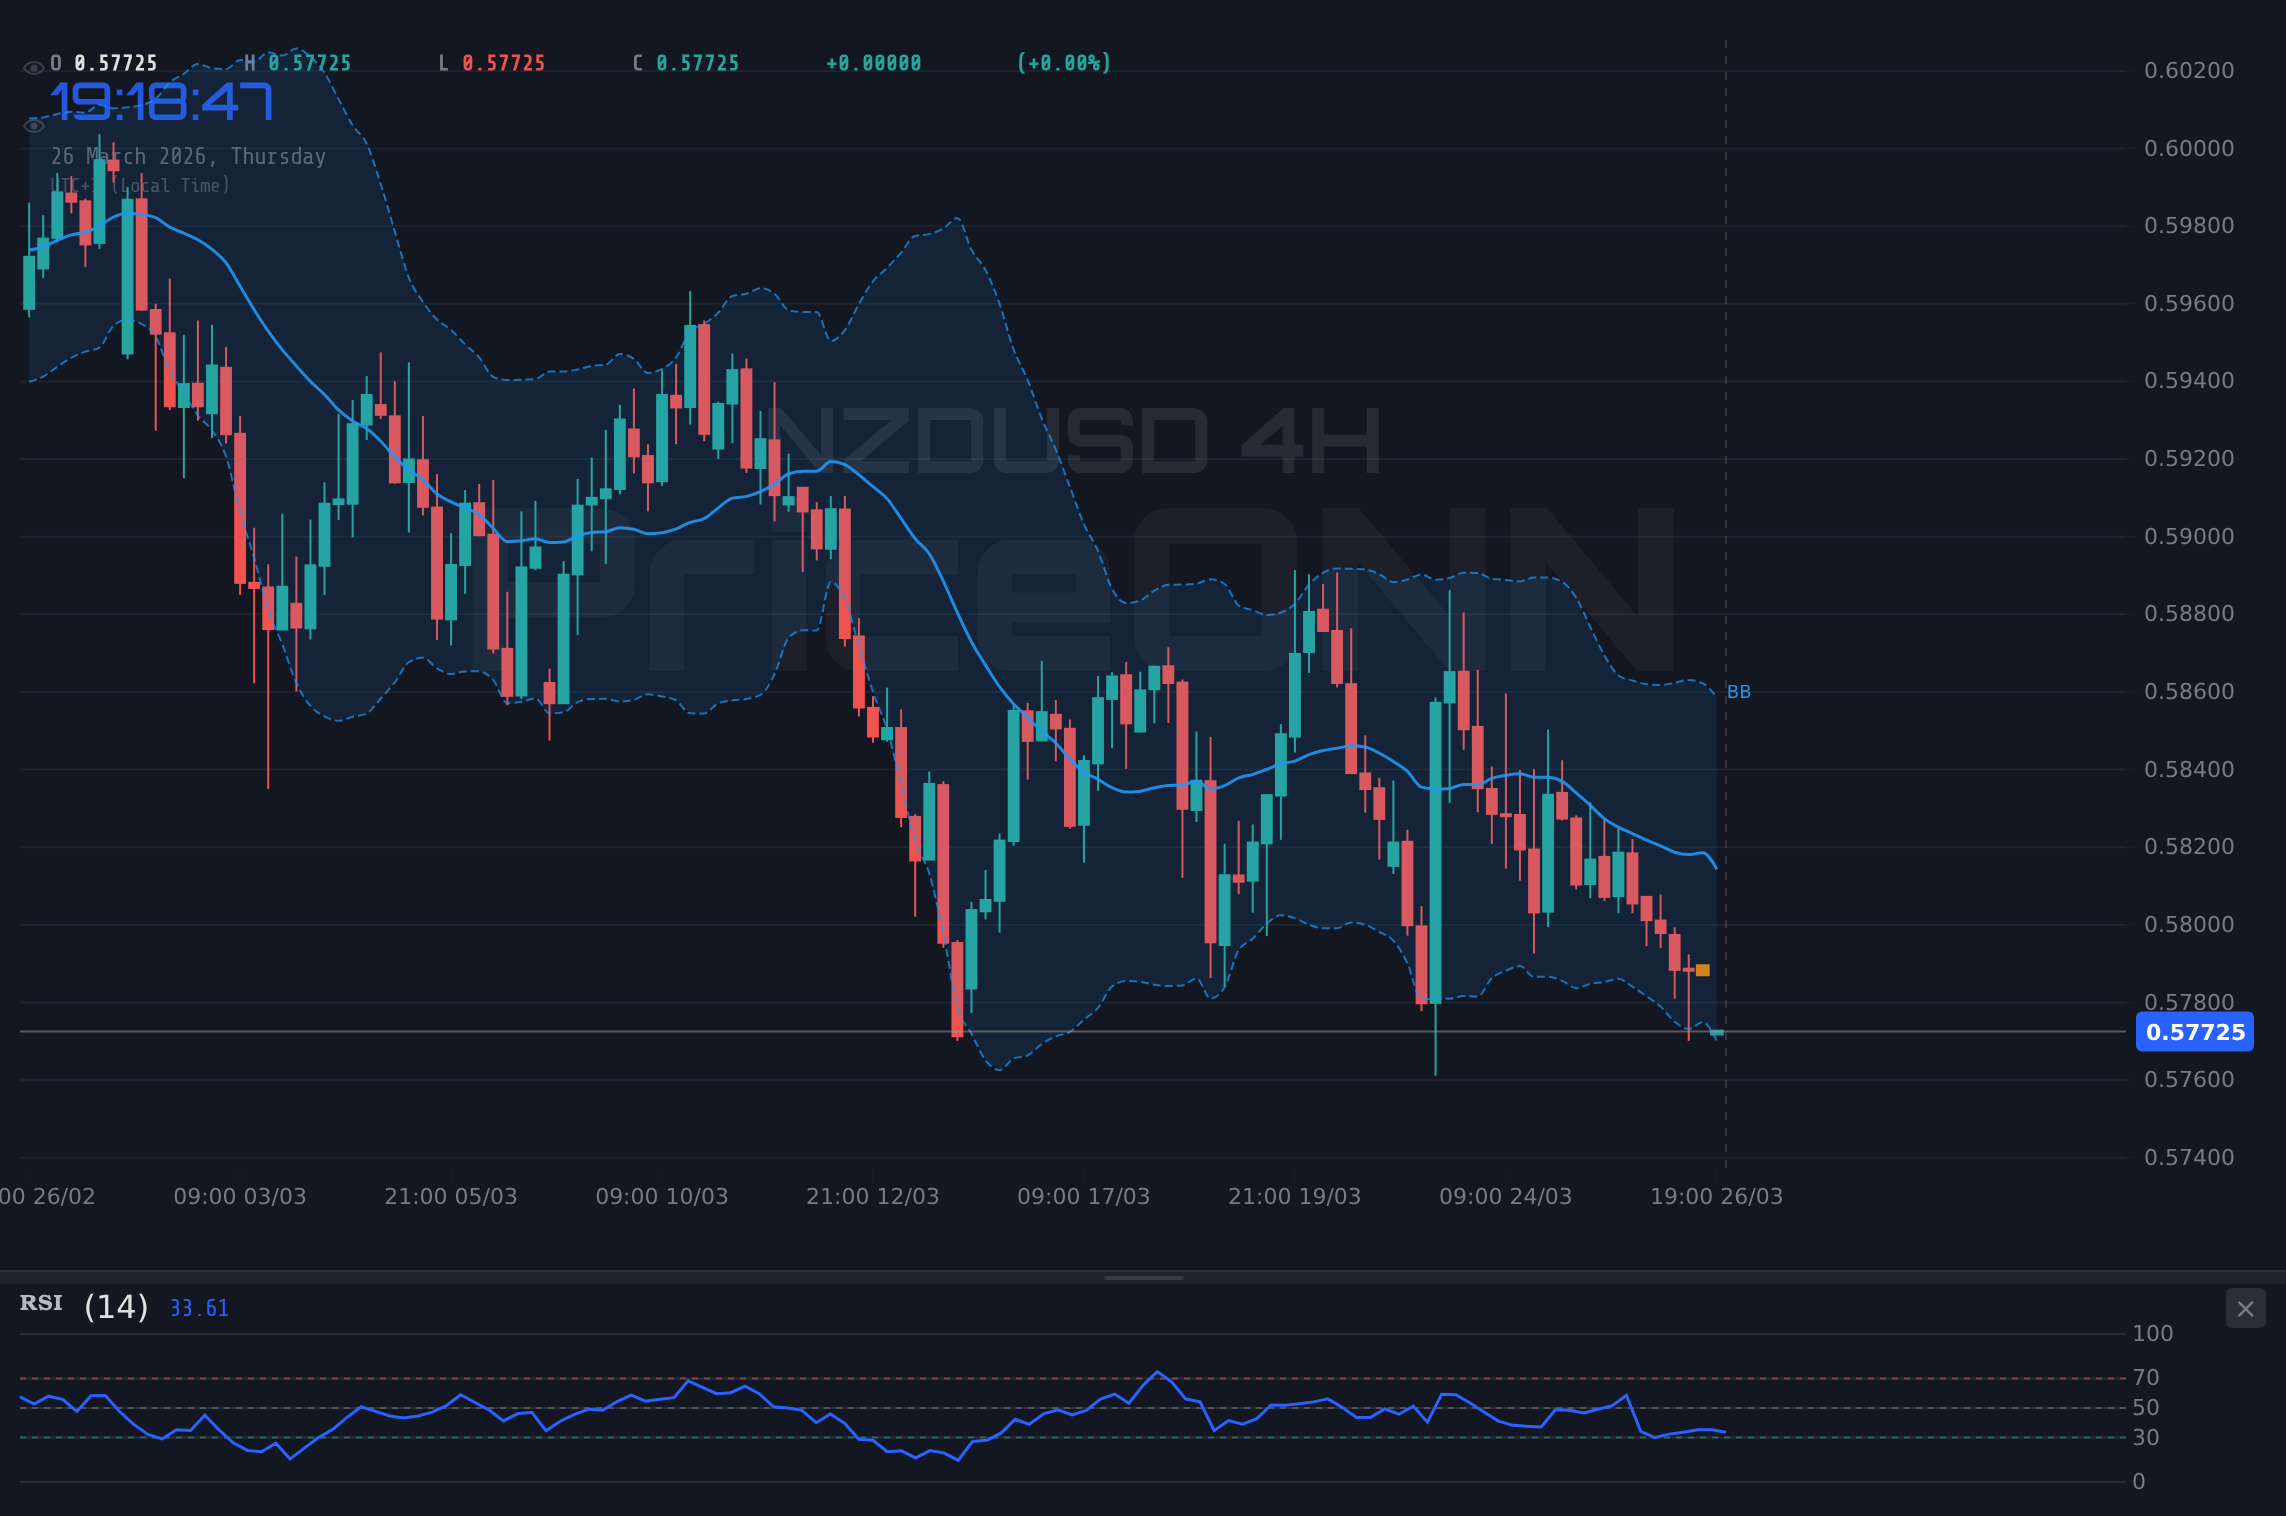
Moving to the 4-hour timeframe, the bearish trend is even more pronounced, with a strength of 97%. The RSI here is at 39.96, still in neutral territory but reinforcing the prevailing downward pressure. The Stochastic Oscillator is in oversold territory, with the K line (16.19) below the D line (21.08), signaling a potential downside continuation rather than a reversal. The MACD remains negative, and the ADX at 15.89 suggests a weaker trend compared to the 1-hour chart, perhaps indicating a period of consolidation or increased choppiness before the next significant move. This lack of strong trending momentum on the 4-hour chart, despite the clear bearish direction, highlights the current market's indecision and the potential for sharp, albeit short-lived, counter-trend moves.
On the daily chart, the picture becomes slightly more nuanced. While the overall trend is still considered bearish, its strength is rated at 87%, suggesting that the longer-term conviction is high. The RSI at 38.59 continues to hover in the neutral zone, offering little definitive directional clarity but leaning bearish. The MACD histogram is negative, aligning with the broader bearish sentiment. The Stochastic Oscillator is showing a bearish signal (%K below %D), and crucially, the ADX at 33.34 indicates a strong downward trend. However, the Bollinger Bands on the daily chart are positioned below the middle band, with the price trading near the lower band, indicating oversold conditions that could precede a bounce. This observation is critical: while the dominant trend is down, the daily timeframe suggests potential for a technical rebound, even if temporary.
The Crucial Levels: Where Does NZDUSD Go Next?
The current price of $0.57729 for NZDUSD places it precariously close to significant support levels. On the 1-hour chart, the first support is identified at $0.5774, followed by $0.57667. A decisive break below $0.5774 would likely trigger further selling pressure, potentially targeting the $0.57667 level. Resistance on this timeframe is capped at $0.5790, $0.57987, and $0.5806. Breaking above these levels would be necessary to challenge the immediate bearish sentiment.
Looking at the 4-hour timeframe, the key support levels are $0.57798, $0.57712, and $0.57614. A breach of $0.57712 could accelerate the downward move towards $0.57614. Resistance is seen at $0.57982, $0.5808, and $0.58166. The confluence of these levels across different timeframes provides a clear roadmap for traders. The immediate focus remains on the $0.5774 support. A failure to hold this level, especially with the DXY strengthening and risk appetite waning, paints a grim picture for the Kiwi dollar in the short term.
On the daily chart, the primary support is situated at $0.57915, with subsequent levels at $0.57776 and $0.57521. Resistance is faced at $0.58309, $0.58564, and $0.58703. The fact that the current price of $0.57729 is below the first daily support level of $0.57915 is a significant bearish signal. It suggests that the downward momentum is strong enough to overcome longer-term protective barriers. The market is essentially testing the resolve of buyers at these lower levels, and the prevailing 'risk-off' sentiment globally is not conducive to a strong rebound in risk-sensitive assets like the NZD.
Trade Stance: Waiting for Confirmation Amidst Choppy Signals
The current technical picture for NZDUSD presents a complex scenario. While the dominant trend across multiple timeframes is bearish, indicated by the strong ADX readings and negative MACD histograms, conflicting signals from oscillators like the Stochastic suggest potential for short-term volatility or even a brief retracement. The ADX reading of 14.36 on the 1-hour chart specifically points to a choppy market, where clear directional conviction is lacking, and price action could be erratic. This 'WATCH_ZONE' recommendation is appropriate given the confluence of bearish trend indicators and conflicting oscillator signals. A valid trading setup would require clearer confirmation.
For a bearish position to be considered more robust, a decisive break and hold below the $0.5774 support level on the 1-hour chart would be a critical trigger. This would confirm the bearish momentum and invalidate the short-term bullish signals from the Stochastic. Conversely, for any bullish sentiment to regain traction, NZDUSD would need to break convincingly above the immediate resistance at $0.5790 and ideally clear the $0.57987 level. Until such a decisive move occurs, navigating this market requires patience and strict risk management. The current environment, characterized by geopolitical tensions and a strengthening dollar, favors a cautious approach, waiting for clearer signals rather than anticipating moves in a potentially range-bound or choppy market.
The correlation with the DXY at 99.65 is a key factor to monitor. As the dollar index shows strength, it inherently creates selling pressure on pairs like NZDUSD. Any signs of weakness in the DXY, perhaps due to shifting US interest rate expectations or geopolitical de-escalation, could offer a reprieve for the Kiwi. However, with current global tensions and the Fed's uncertain policy path, the dollar's strength appears to be a more persistent theme. Oil prices, while surging, are not currently providing enough of a counter-balance to the dollar's strength and risk-off sentiment for NZDUSD. The market is pricing in a complex interplay of factors, and clarity is currently lacking, necessitating a 'wait-and-see' approach.
Bearish Scenario: Kiwi Under Pressure
70% ProbabilityConsolidation Scenario: Choppy Waters Ahead
20% ProbabilityBullish Scenario: Short-Covering Rally?
10% ProbabilityFrequently Asked Questions: NZDUSD Analysis
What happens if NZDUSD breaks below the $0.5774 support level?
A break below $0.5774 would validate the bearish short-term trend, likely triggering stop-losses and accelerating the decline towards the $0.57667 level. This would align with the prevailing risk-off sentiment and dollar strength.
Is the current RSI reading of 37.25 a buy signal for NZDUSD at $0.57729?
No, an RSI at 37.25 is not a direct buy signal; it indicates bearish momentum but is not yet in oversold territory. While the Stochastic shows a potential short-term bounce, the overall trend and other indicators suggest caution, and a buy signal would require confirmation above key resistance levels.
How is the DXY's strength at 99.65 impacting NZDUSD's trend analysis?
The DXY's rise to 99.65 exerts significant downward pressure on NZDUSD due to their inverse correlation. This dollar strength exacerbates the bearish sentiment for the Kiwi, making it harder for NZDUSD to find footing and potentially signaling further declines unless the DXY reverses sharply.
How might upcoming economic data influence NZDUSD's outlook from current levels?
Upcoming US economic data, particularly any surprises in inflation or employment figures, could influence the DXY and thus NZDUSD. A weaker-than-expected US report might offer a brief respite for NZDUSD by weakening the dollar, while strong data would likely reinforce the bearish trend.
Track markets in real-time
AI-powered analysis, technical indicators and real-time price data.
Join Our Telegram Channel
Breaking market news, AI analysis and trading signals instantly.
Join Channel