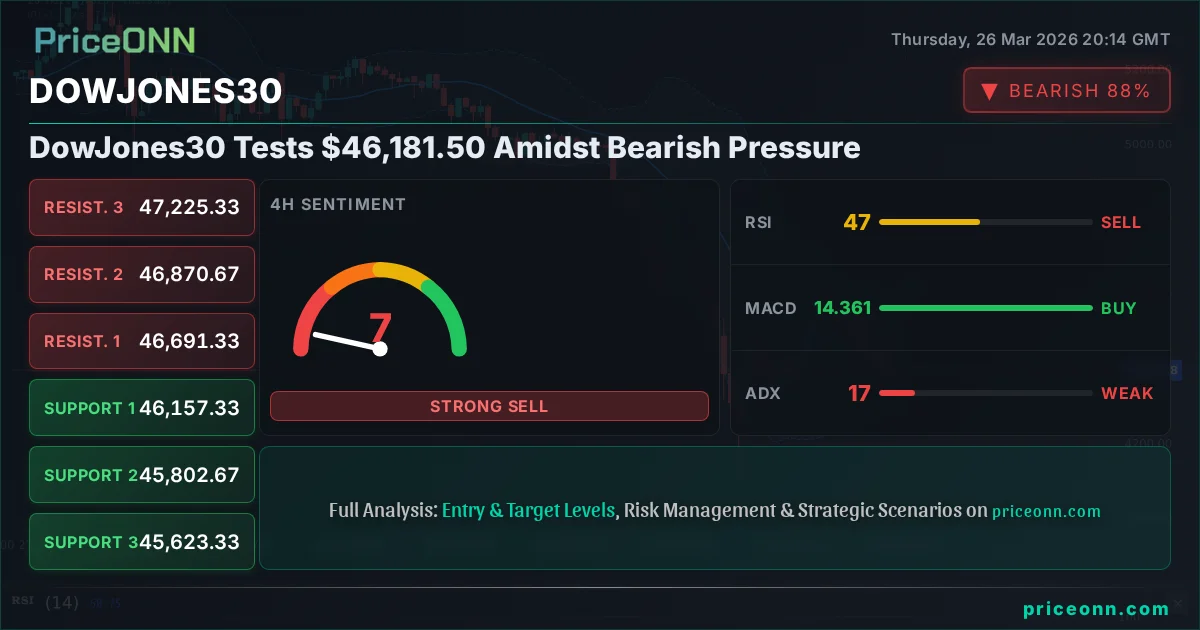
DowJones30 Tests $46,181.50 Amidst Bearish Pressure
DowJones30 is currently testing critical support at $46,181.50. With the dollar strengthening and risk appetite waning, bears are firmly in control, eyeing further downside.
The Dow Jones Industrial Average (DJIA) is currently facing significant headwinds, trading at $46,181.50. This level is becoming a focal point as market sentiment sours, driven by a strengthening dollar and a palpable shift towards risk-off behavior across global markets. The bears appear to be tightening their grip, pushing the index towards key support levels, and demanding a closer look at the underlying drivers and potential implications for traders and investors alike. This isn't just a minor pullback; it's a scenario demanding careful navigation, where every tick of the price action and every piece of macroeconomic data carries significant weight.
- The Dow Jones Industrial Average is trading at $46,181.50, testing crucial support levels.
- With RSI at 47.87 on the 1H chart, the index shows a bearish trend, indicating potential for further decline.
- Critical support sits at $45,874, tested amidst a strong dollar (DXY at 99.62) and risk-off sentiment.
- The current market environment suggests a cautious approach, with bears eyeing further downside towards $45,601.67.
The Grip of the Bears: What's Driving the Dow Jones Lower?
Dollar Strength and Risk Aversion
The Dow Jones Industrial Average's current struggle at $46,181.50 is intrinsically linked to the broader market's risk sentiment, which appears to be tilting decidedly bearish. A key indicator of this shift is the U.S. Dollar Index (DXY), currently trading at 99.62 and showing a strong upward trend on multiple timeframes. As the dollar strengthens, it typically exerts downward pressure on commodities like gold and silver, and often correlates with a risk-off environment that weighs on equity indices. The DXY's ascent suggests that global investors are seeking the safety of the greenback, a move that often precedes or accompanies a broader sell-off in riskier assets, including equities like the Dow Jones.
This dynamic is further amplified by the performance of major equity benchmarks. The S&P 500 is down 1.27% to 6507.35, and the Nasdaq 100 has plunged 1.88% to 23704.43. This synchronized decline across major U.S. indices paints a clear picture: risk appetite is diminishing. When tech-heavy indices like the Nasdaq experience sharp drops, it signals a broader deleveraging event, where investors shed assets perceived as more speculative or growth-oriented. The Dow Jones, while more value-oriented, is not immune to these broader market forces. The correlation is undeniable; as risk assets fall, demand for safe havens like the dollar typically rises, creating a negative feedback loop that pushes indices like the Dow Jones lower.
Geopolitical Tensions and Economic Uncertainty
Adding fuel to the bearish fire are the persistent geopolitical tensions, particularly those emanating from the Middle East. Reports of escalating Black Sea tensions involving a Russian oil tanker being hit, coupled with ongoing US-Iran negotiations, create an environment of uncertainty that is detrimental to market stability. Such events can disrupt supply chains, particularly in energy markets, and heighten fears of wider conflict. Even if the direct impact on the Dow Jones's constituent companies might seem indirect, the overarching fear and uncertainty tend to spook investors, leading them to reduce exposure to equities. This is where the price of oil becomes a critical barometer. Brent crude is trading at $102.81, showing a daily rise of 1.18%, and WTI at $92.14, up 0.68%. While rising oil prices can sometimes be seen as a sign of robust global demand, in the current climate, they are more likely interpreted as an inflationary threat, potentially forcing central banks to maintain a hawkish stance or even hike rates further, which is negative for stock valuations.
The economic calendar, while showing some mixed signals, leans towards caution. The US ISM Manufacturing PMI came in at 52.4, slightly above the forecast of 51.5, suggesting some resilience in the manufacturing sector. However, the US ISM Services PMI at 51.1 missed the forecast of 52, indicating a potential slowdown in the services sector, which is a larger component of the US economy. Furthermore, the US ADP Non-Farm Employment Change showed a significant miss, coming in at 6.926 against a forecast of -1.3, which might seem positive but needs to be viewed in the context of overall market risk appetite. The market seems more focused on the potential for sticky inflation and the implications for interest rates than on isolated positive data points. The Bank of England also released its Interest Rate decision, holding steady at 3%, but the previous data hinted at some underlying inflationary pressures. This complex economic backdrop, marked by inflation concerns and geopolitical risks, creates an environment where investors are more inclined to reduce risk, benefiting the dollar and pressuring equity indices.
Technical Breakdown: Charting the Dow Jones's Path
Short-Term Momentum (1H Chart)
On the 1-hour chart, the Dow Jones Industrial Average at $46,181.50 displays a clear bearish trend with a strength of 91%. The Relative Strength Index (RSI) is hovering at 47.87, which is in neutral territory but leaning towards bearish, suggesting that while oversold conditions are not present, the upward momentum is lacking. The MACD indicator is showing negative momentum, with the MACD line below its signal line, reinforcing the bearish bias. Bollinger Bands are also positioned below the middle band, indicating downward pressure. Stochastic Oscillator readings show K=20.39 and D=37.68, a bearish signal with %K below %D and both in oversold territory, suggesting potential for a short-term bounce but within a dominant downtrend. The ADX at 14.63 indicates a weak trend, which can often accompany choppy, range-bound conditions or precede a more significant move. However, the overall signal leans towards selling, with 7 out of 8 indicators suggesting a sell. This short-term picture is concerning for bulls, pointing towards continued weakness in the immediate future.
The immediate support levels on the 1H chart are at $45,982, $45,917, and $45,874. Resistance is found at $46,090, $46,133, and $46,198. The current price of $46,181.50 is very close to the upper resistance, highlighting the precarious position. A close above $46,198 would be needed to alleviate immediate selling pressure, but given the broader market context and the bearish signals across other timeframes, such a move seems unlikely without a significant shift in sentiment or a major catalyst. The weak ADX suggests that any bounce might be short-lived, and the market could be consolidating before a larger move, likely to the downside given the prevailing trend.
Medium-Term Trend (4H Chart)
Shifting to the 4-hour timeframe, the bearish trend remains dominant, with a strength of 94%. The RSI is at 47.9, still in neutral territory but reflecting the prevailing bearish sentiment. The MACD shows positive momentum, with the MACD line above its signal line, which is a slight divergence from the 1H chart and could indicate that while the immediate trend is down, there might be underlying buying interest attempting to emerge. However, Bollinger Bands are below the middle band, reinforcing the bearish outlook. Stochastic Oscillator readings (K=35.6, D=46.35) provide a bearish signal, with %K below %D, suggesting further downside potential in this timeframe. The ADX at 17.06 still indicates a weak trend, suggesting a lack of conviction in the current move, but the overall signal remains heavily skewed towards selling (7 out of 8 indicators). This mixed picture between the MACD and other indicators warrants caution, but the dominant trend and the majority of signals point downwards.
Key support levels on the 4H chart are identified at $46,157.33, $45,802.67, and $45,623.33. Resistance levels are seen at $46,691.33, $46,870.67, and $47,225.33. The current price of $46,181.50 is sitting precariously close to the first support level. A break below $46,157.33 would likely accelerate the downward move, targeting the subsequent support levels. The divergence in MACD momentum on this timeframe compared to the 1H chart is something to watch; it could signal a potential bottoming process or simply a pause before further declines. However, the overall bearish sentiment and the majority of indicators suggest that the path of least resistance remains to the downside.
Daily Outlook (1D Chart)
On the daily chart, the Dow Jones Industrial Average at $46,181.50 is firmly entrenched in a bearish trend, with a strength of 96%. The RSI stands at 34.41, firmly in the neutral zone and close to oversold territory, suggesting that the index is becoming technically oversold on a daily basis. This could present a potential buying opportunity if other factors align, but it doesn't negate the prevailing trend. The MACD exhibits negative momentum, with the MACD line below its signal line, confirming the bearish sentiment. Bollinger Bands are trading below the middle band, indicating a downtrend. The Stochastic Oscillator readings (K=51.95, D=30.72) show a bullish signal, with %K above %D, suggesting a potential upward reversal or at least a pause in the selling pressure. However, the ADX at 41.28 indicates a strong downtrend, meaning that even with potential oversold conditions on RSI and bullish signals from Stochastic, the underlying trend is powerful and could continue to push prices lower.
The significant daily support levels are located at $46,154.67, $45,896.33, and $45,601.67. The resistance levels are much higher, at $46,707.67, $47,002.33, and $47,260.67. The current price of $46,181.50 is teetering just above the $46,154.67 support. A decisive break below this level would confirm the bearish outlook and open the door for a move towards the lower support zones. The conflicting signals between the Stochastic (bullish) and ADX (strong downtrend) on the daily timeframe highlight the current market's indecision or a potential turning point. However, given the overwhelming bearish sentiment across shorter timeframes and the broader market correlation, the probability favors a continuation of the downtrend, especially if the $46,154.67 support fails.
Market Correlations and Intermarket Dynamics
The Dollar's Dominance: DXY's Impact
The current strength of the U.S. Dollar Index (DXY), trading at 99.62, is a dominant factor influencing the Dow Jones and other risk assets. On the 1-hour chart, the DXY exhibits a strong upward trend (100% strength) with RSI at 64.39 and MACD showing positive momentum. The 4-hour chart shows a neutral trend (50% strength) but with RSI at 62.62 and Stochastic in overbought territory, suggesting potential for continued strength or a pause. The daily chart also points to a rising trend (91% strength) with RSI at 59.44. This consistent dollar strength implies that global capital is flowing into USD-denominated assets, often at the expense of other currencies and riskier investments. For the Dow Jones, this typically means increased selling pressure, as a stronger dollar makes U.S. exports more expensive and can signal tighter monetary policy expectations, which dampens equity valuations. The correlation is clear: as DXY rises towards the 100 mark, the Dow Jones faces increasing challenges to maintain its current levels, let alone rally.
Equities in Retreat: SP500 and Nasdaq's Signal
The simultaneous decline in the S&P 500 (down 1.27% to 6507.35) and Nasdaq 100 (down 1.88% to 23704.43) provides a stark warning for the Dow Jones. The S&P 500 is in a bearish trend on the 1H and 4H charts, with RSI readings below 40. The Nasdaq 100 shows a consistent bearish trend across all timeframes, with RSI readings in the 30s and strong ADX values indicating a firm downtrend. This broad-based equity weakness suggests a systemic risk-off move is underway. Investors are likely reallocating capital away from equities and towards perceived safe-haven assets, such as the U.S. dollar and potentially U.S. Treasuries (though yield movements are complex). The Dow Jones, representing 30 of the largest U.S. companies, is not immune to this flight to safety. When the broader equity market is in distress, even relatively stable components of the Dow are susceptible to selling pressure driven by fear and margin calls across the market.
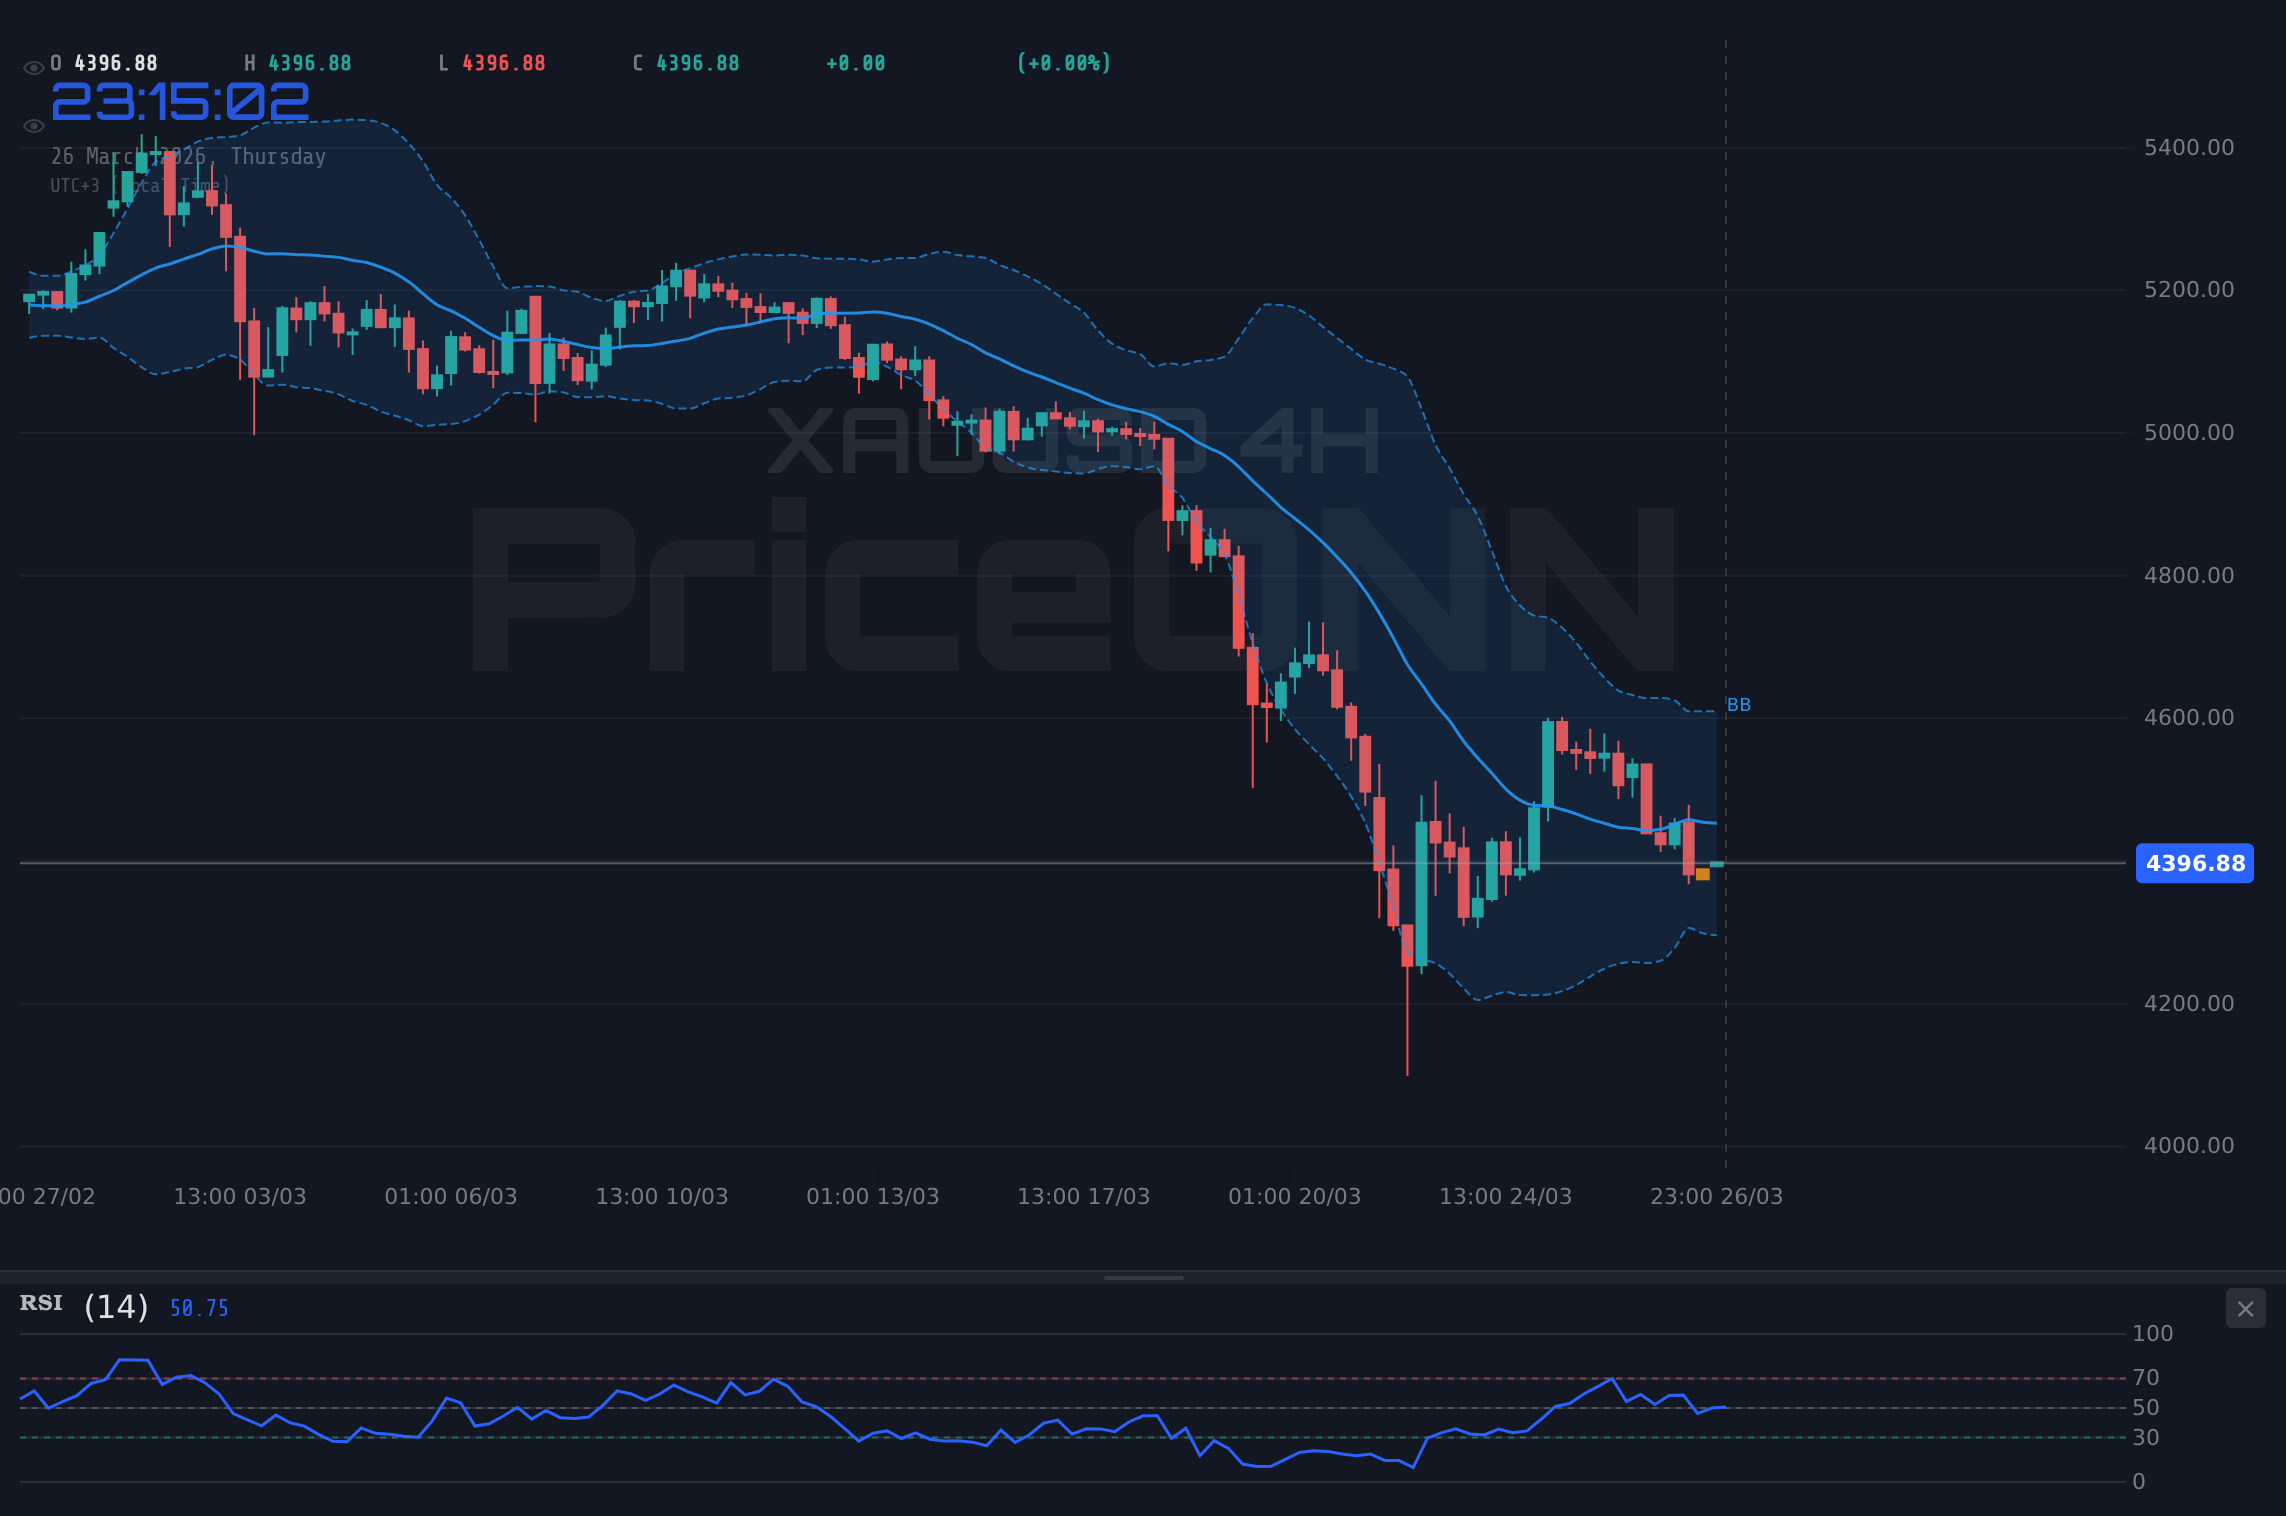
Commodities and Inflation: A Complex Dance
Commodity markets are also reflecting the current market anxieties. Gold (XAUUSD) is down significantly by 2.67% to $4386.06, and Silver (XAGUSD) has tumbled 4.51% to $67.99. This sharp decline in precious metals, often seen as safe-haven assets themselves, indicates that investors are not just fleeing equities but are actively liquidating positions across various asset classes, possibly to raise cash or move into the dollar. The news mentions gold tumbling amid renewed Middle East tensions and rate hike fears, and silver's sharp downturn as the dollar strengthened. This suggests that the primary driver for precious metals is currently dollar strength and the prospect of higher-for-longer interest rates, rather than geopolitical uncertainty acting as a sole safe-haven bid. The rise in oil prices (Brent +1.18% to $102.81, WTI +0.68% to $92.14) adds another layer of complexity. While rising oil can signal strong demand, in this context, it's more likely interpreted as an inflationary pressure, which could keep central banks hawkish and further pressure equity markets like the Dow Jones.
Navigating the Dow Jones: Scenarios and Outlook
Bearish Scenario: The Path of Least Resistance
Given the confluence of bearish technical signals and negative market correlations, the most probable scenario involves a continued decline for the Dow Jones Industrial Average. The current price of $46,181.50 is teetering on the edge of significant support at $46,154.67 on the daily chart. A decisive break below this level, confirmed by a close below it, would likely trigger further selling. The 1H and 4H charts already show strong bearish momentum, with RSI readings in the lower neutral to oversold territory and MACD confirming downward pressure. The ADX on the daily chart at 41.28 indicates a strong downtrend, suggesting that the bears have considerable control. If this scenario unfolds, the next logical targets would be the subsequent support levels identified at $45,896.33 and then $45,601.67. This path is supported by the strong dollar (DXY at 99.62), widespread risk aversion seen in other equity indices, and persistent inflation concerns potentially keeping interest rates elevated.
Bearish Scenario: Bears Tighten Their Grip
65% ProbabilityNeutral Scenario: Consolidation Before the Next Move
While the bearish case is strong, the market is not always a straight line down. On the 4-hour chart, the ADX is at 17.06, indicating a weak trend, and the MACD shows some positive momentum, hinting at potential consolidation. The daily Stochastic Oscillator is also showing a bullish signal. If the Dow Jones fails to break decisively below $46,154.67, it could enter a period of consolidation between the current resistance at $46,198 (1H) and the support at $46,154.67. This range-bound environment might persist until a clearer catalyst emerges, such as key economic data releases or significant geopolitical developments. During consolidation, price action can become choppy, with smaller bounces and pullbacks within a tight range. This scenario is less likely given the strong bearish signals on shorter timeframes and the prevailing risk-off sentiment, but it remains a possibility if key support levels miraculously hold without a fundamental shift.
Neutral Scenario: A Temporary Pause
25% ProbabilityBullish Scenario: A Fading Hope?
A bullish scenario would require a significant shift in market sentiment, a strong catalyst, or a clear indication that the current selling pressure is overdone. For the Dow Jones to rally from $46,181.50, it would first need to decisively break through the immediate resistance levels on the 1H chart, particularly above $46,198. A stronger confirmation would be a sustained move above the daily resistance at $46,707.67. This would likely be accompanied by a weakening dollar (DXY falling significantly), a surge in risk appetite (S&P 500 and Nasdaq rallying), and perhaps dovish signals from central banks or a de-escalation of geopolitical tensions. The RSI on the 1H and 4H charts are currently too low to support a strong rally without a significant reversal, and the ADX on the daily chart (41.28) indicates a strong downtrend that would need to be overcome. This scenario appears least likely in the current environment, but it cannot be entirely dismissed if unexpected positive news emerges.
Bullish Scenario: A Surprise Reversal
10% ProbabilityConclusion: Patience and Prudence
The Dow Jones Industrial Average is currently at a critical juncture, trading at $46,181.50 amidst a prevailing bearish sentiment. The confluence of a strengthening dollar, declining risk appetite in equity markets, persistent geopolitical tensions, and inflation concerns creates a challenging environment. Technical indicators on shorter timeframes point towards further downside, with key support levels at $46,154.67, $45,896.33, and $45,601.67 being closely watched. While the daily chart shows some oversold conditions and conflicting signals, the dominant trend and broader market correlations favor a bearish continuation. Traders should exercise extreme caution, manage risk diligently, and wait for clear confirmation before committing to any positions. Patience appears to be the most prudent strategy as the market digests current economic and geopolitical pressures.
Frequently Asked Questions: DowJones30 Analysis
What happens if DowJones30 breaks below $46,154.67 support?
A decisive break below $46,154.67 on the daily chart would confirm the bearish trend, likely triggering a sell-off towards the next support at $45,896.33. This would be driven by increased risk aversion and dollar strength, aligning with the prevailing market sentiment.
Should I buy DowJones30 at current levels of $46,181.50 given the RSI at 47.87?
Buying at current levels of $46,181.50 with RSI at 47.87 is a risky proposition. While the RSI is in neutral territory, the overall trend is bearish, and other indicators signal further downside. A more prudent approach would be to wait for confirmation of a bottoming process or a clear break of resistance, potentially above $46,707.67.
Is the MACD negative momentum a sell signal for DowJones30 trend analysis?
Yes, negative MACD momentum, particularly when the MACD line is below its signal line as seen on the 1H and 1D charts, is a strong sell signal. It indicates that bearish momentum is building and can precede further price declines, reinforcing the bearish outlook for the Dow Jones.
How will the current DXY strength affect DowJones30 this week?
The current DXY strength, trading at 99.62 with a rising trend, is likely to continue pressuring the Dow Jones this week. A strong dollar typically correlates with risk-off sentiment, making equities less attractive and potentially leading to further declines for the index as investors favor the greenback.
Track markets in real-time
AI-powered analysis, technical indicators and real-time price data.
Join Our Telegram Channel
Breaking market news, AI analysis and trading signals instantly.
Join Channel