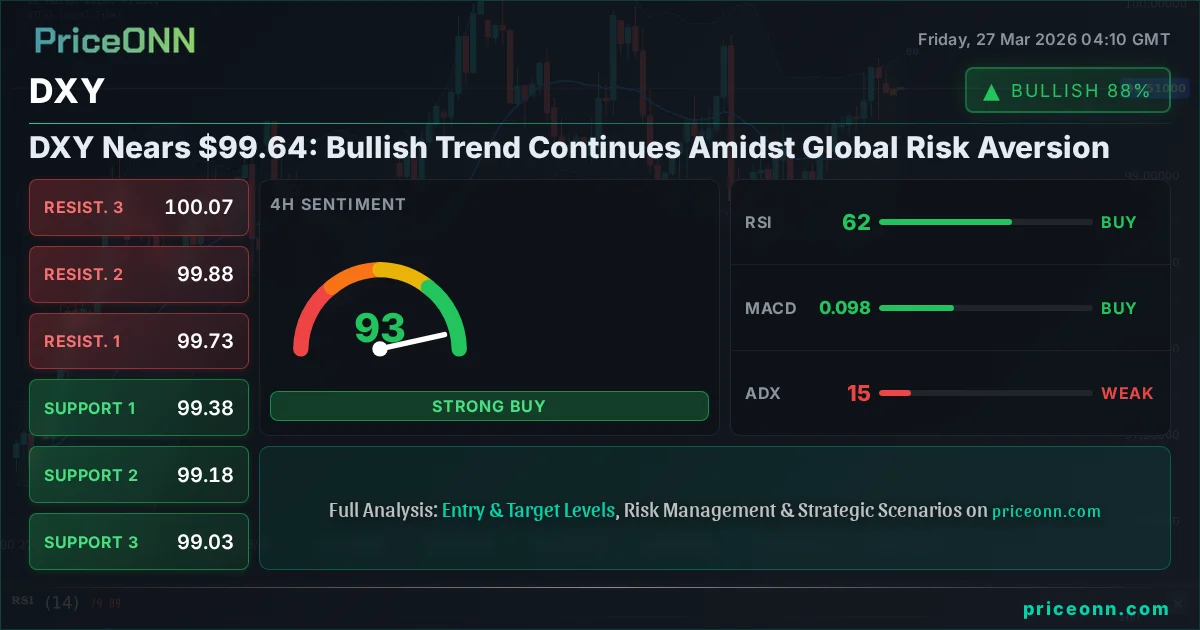
DXY Nears $99.64: Bullish Trend Continues Amidst Global Risk Aversion
The US Dollar Index (DXY) is consolidating near $99.64, showing resilience as global risk aversion mounts. Key technicals suggest a continued bullish bias, but caution is warranted.
The DXY's persistent strength, currently hovering around $99.64, is more than just a technical pattern; it's a clear signal of shifting global risk sentiment. In a market environment increasingly dominated by geopolitical anxieties and a cautious approach to risk assets, the dollar index is acting as the ultimate safe haven. This isn't merely a temporary fluctuation; the underlying factors supporting the dollar suggest this trend has room to run, presenting both challenges and opportunities for traders and investors navigating these choppy waters.
- The DXY is consolidating near $99.64, with daily RSI at 59.6 indicating continued bullish momentum but approaching overbought territory.
- Critical support for the DXY is identified at $99.31, a level that has held firm, while resistance looms at $99.76, a key psychological and technical barrier.
- Technical indicators like MACD and Stochastic on the daily chart show mixed signals, suggesting potential consolidation before the next directional move.
- Global risk aversion, driven by escalating Middle East tensions and concerns over energy supply, is providing a strong tailwind for the dollar's safe-haven appeal.
The narrative surrounding the US Dollar Index (DXY) has shifted significantly. What was once a complex interplay of Federal Reserve policy expectations and inflation data has now been amplified by a surge in global risk aversion. The recent escalation of geopolitical tensions, particularly in the Middle East, coupled with concerns about energy security and supply chain vulnerabilities, has investors flocking to traditional safe-haven assets. The DXY, currently trading just shy of the $99.76 resistance level at $99.64, is a primary beneficiary of this flight to safety. Its upward trajectory, supported by a confluence of technical and fundamental factors, paints a compelling picture for dollar bulls, even as other markets grapple with uncertainty.
Looking at the 1-day time frame, the DXY's trend is firmly established as bullish, with a strong conviction of 91%. This is not a fleeting sentiment but a robust trend supported by technical indicators. The Relative Strength Index (RSI) at 59.6, while still in neutral territory, shows a clear upward inclination, suggesting room for further appreciation before hitting overbought conditions. More importantly, the Moving Average Convergence Divergence (MACD) indicator, despite showing negative momentum on the 1-hour chart, remains above its signal line on the daily timeframe, hinting at underlying strength. The Stochastic indicator, with %K at 65.56 and %D at 47.74, also supports a bullish outlook, crossing over and signaling potential further upside. The Average Directional Index (ADX) at 31.64 reinforces the presence of a strong trend, indicating that the current upward movement has significant staying power.
However, the immediate picture presents a more nuanced scenario. While the daily trend is bullish, the 1-hour timeframe reveals a more neutral stance, with the trend strength at 50%. This suggests a potential pause or consolidation phase is underway. The RSI on the 1-hour chart is at 61.63, nearing overbought levels, and the MACD histogram shows negative momentum. This divergence between the longer-term daily trend and the shorter-term 1-hour signals is crucial. It indicates that while the overall direction remains upward, the pace might slow down, and a period of consolidation or a minor pullback could occur before the trend reasserts itself. The ADX at 23.14 on the 1-hour chart also points to a weakening trend in the very short term, which aligns with the idea of a consolidation before the next leg higher.
Navigating the Dollar's Strength: Cross-Market Correlations
The strength of the DXY has profound implications across global markets. When the dollar strengthens, it typically exerts downward pressure on commodities priced in dollars, such as gold and oil, and can make emerging market currencies more expensive to service for dollar-denominated debt holders. Currently, XAUUSD is trading at $4434.64, showing a significant daily gain of 1.29%, which might seem counterintuitive to a strong dollar narrative. However, the market context reveals that gold's recent surge is primarily driven by its safe-haven appeal amidst escalating geopolitical risks, temporarily overshadowing the dollar's strength. This demonstrates how distinct macro drivers can sometimes lead to unusual correlations.
Similarly, Brent crude is trading at $104.75, also showing a daily increase. This rise in oil prices, exacerbated by geopolitical tensions and potential supply disruptions in the Middle East, adds another layer of complexity. Higher oil prices can fuel inflation expectations, which, in turn, could influence central bank policy and potentially support the dollar. However, the immediate effect is often a drag on global growth and a reduction in risk appetite, further bolstering demand for the dollar as a safe asset. The WTI crude is trading at $93.98, also reflecting upward pressure.
The correlation between the DXY and major currency pairs like EURUSD and USDJPY is also instructive. EURUSD is currently at 1.15391, showing a modest daily gain. However, the 4-hour and 1-day charts present a bearish signal for the pair, with ADX at 33.86 indicating a strong downtrend, suggesting that the dollar's strength is likely to weigh on the Euro over time. Conversely, USDJPY is trading at 159.627, pushing towards the critical 160.00 level. The Yen's persistent weakness, driven by the Bank of Japan's ultra-loose monetary policy and widening interest rate differentials, is creating a strong tailwind for this pair, even as the dollar itself strengthens on safe-haven flows. This highlights how currency-specific factors can sometimes amplify or counteract broader dollar trends.
Federal Reserve Policy and the Dollar's Trajectory
While geopolitical events are currently dominating the narrative, the Federal Reserve's monetary policy stance remains a crucial undercurrent supporting the dollar. Although recent economic data, such as the USD [Economic Calendar Event] actual reading of 52.4 against a forecast of 51.5, suggests some resilience in the US economy, the Fed's path forward is still a subject of intense speculation. Market participants are closely watching for any signals that might indicate a shift in interest rate policy. While the immediate focus is on risk aversion, any indication of a more hawkish stance from the Fed - or indeed, any hint that rates will remain higher for longer due to persistent inflation concerns - would further bolster the DXY.
The interest rate differentials between the US and other major economies continue to provide a structural advantage for the dollar. While other central banks grapple with inflation and growth concerns, the Fed's relative hawkishness, or at least its commitment to price stability, provides a yield advantage that attracts capital. This dynamic is particularly evident when considering emerging market currencies, which often face higher borrowing costs and greater volatility. The carry trade, which seeks to profit from interest rate differentials, becomes more attractive when the funding currency, like the USD, offers a higher yield and perceived stability.
The Geopolitical Imperative: Why Risk Aversion Favors the Dollar
The current surge in global risk aversion is perhaps the most significant driver for the DXY's recent performance. Escalating geopolitical tensions in the Persian Gulf, as highlighted by news reports of potential oil price spikes to $200 per barrel and economic impacts on nations like Iraq due to the Strait of Hormuz blockade, create a palpable sense of uncertainty. This uncertainty naturally drives investors towards assets perceived as safe havens. The US dollar, backed by the world's largest economy and deepest financial markets, remains the preeminent safe-haven currency.
Furthermore, concerns over the fragility of critical infrastructure, such as the US power grid, add another layer of systemic risk. While seemingly a domestic issue, such vulnerabilities can have far-reaching economic consequences, impacting everything from industrial production to consumer confidence. In such an environment, the dollar's role as a store of value and a medium of exchange becomes even more critical. Cryptocurrencies like Bitcoin and Ethereum, which have recently experienced significant downturns, are seen as high-risk assets, further reinforcing the appeal of traditional safe havens like the dollar and gold.
Technical Outlook: Levels to Watch
From a technical perspective, the DXY is at a critical juncture. On the 1-hour chart, the price is hovering around $99.64, with immediate resistance at $99.76. A decisive break above this level, supported by strong volume and sustained momentum, could signal the next leg higher. The key support level to watch on this timeframe is $99.47. A failure to hold this level could lead to a deeper correction, potentially testing the 4-hour support levels.
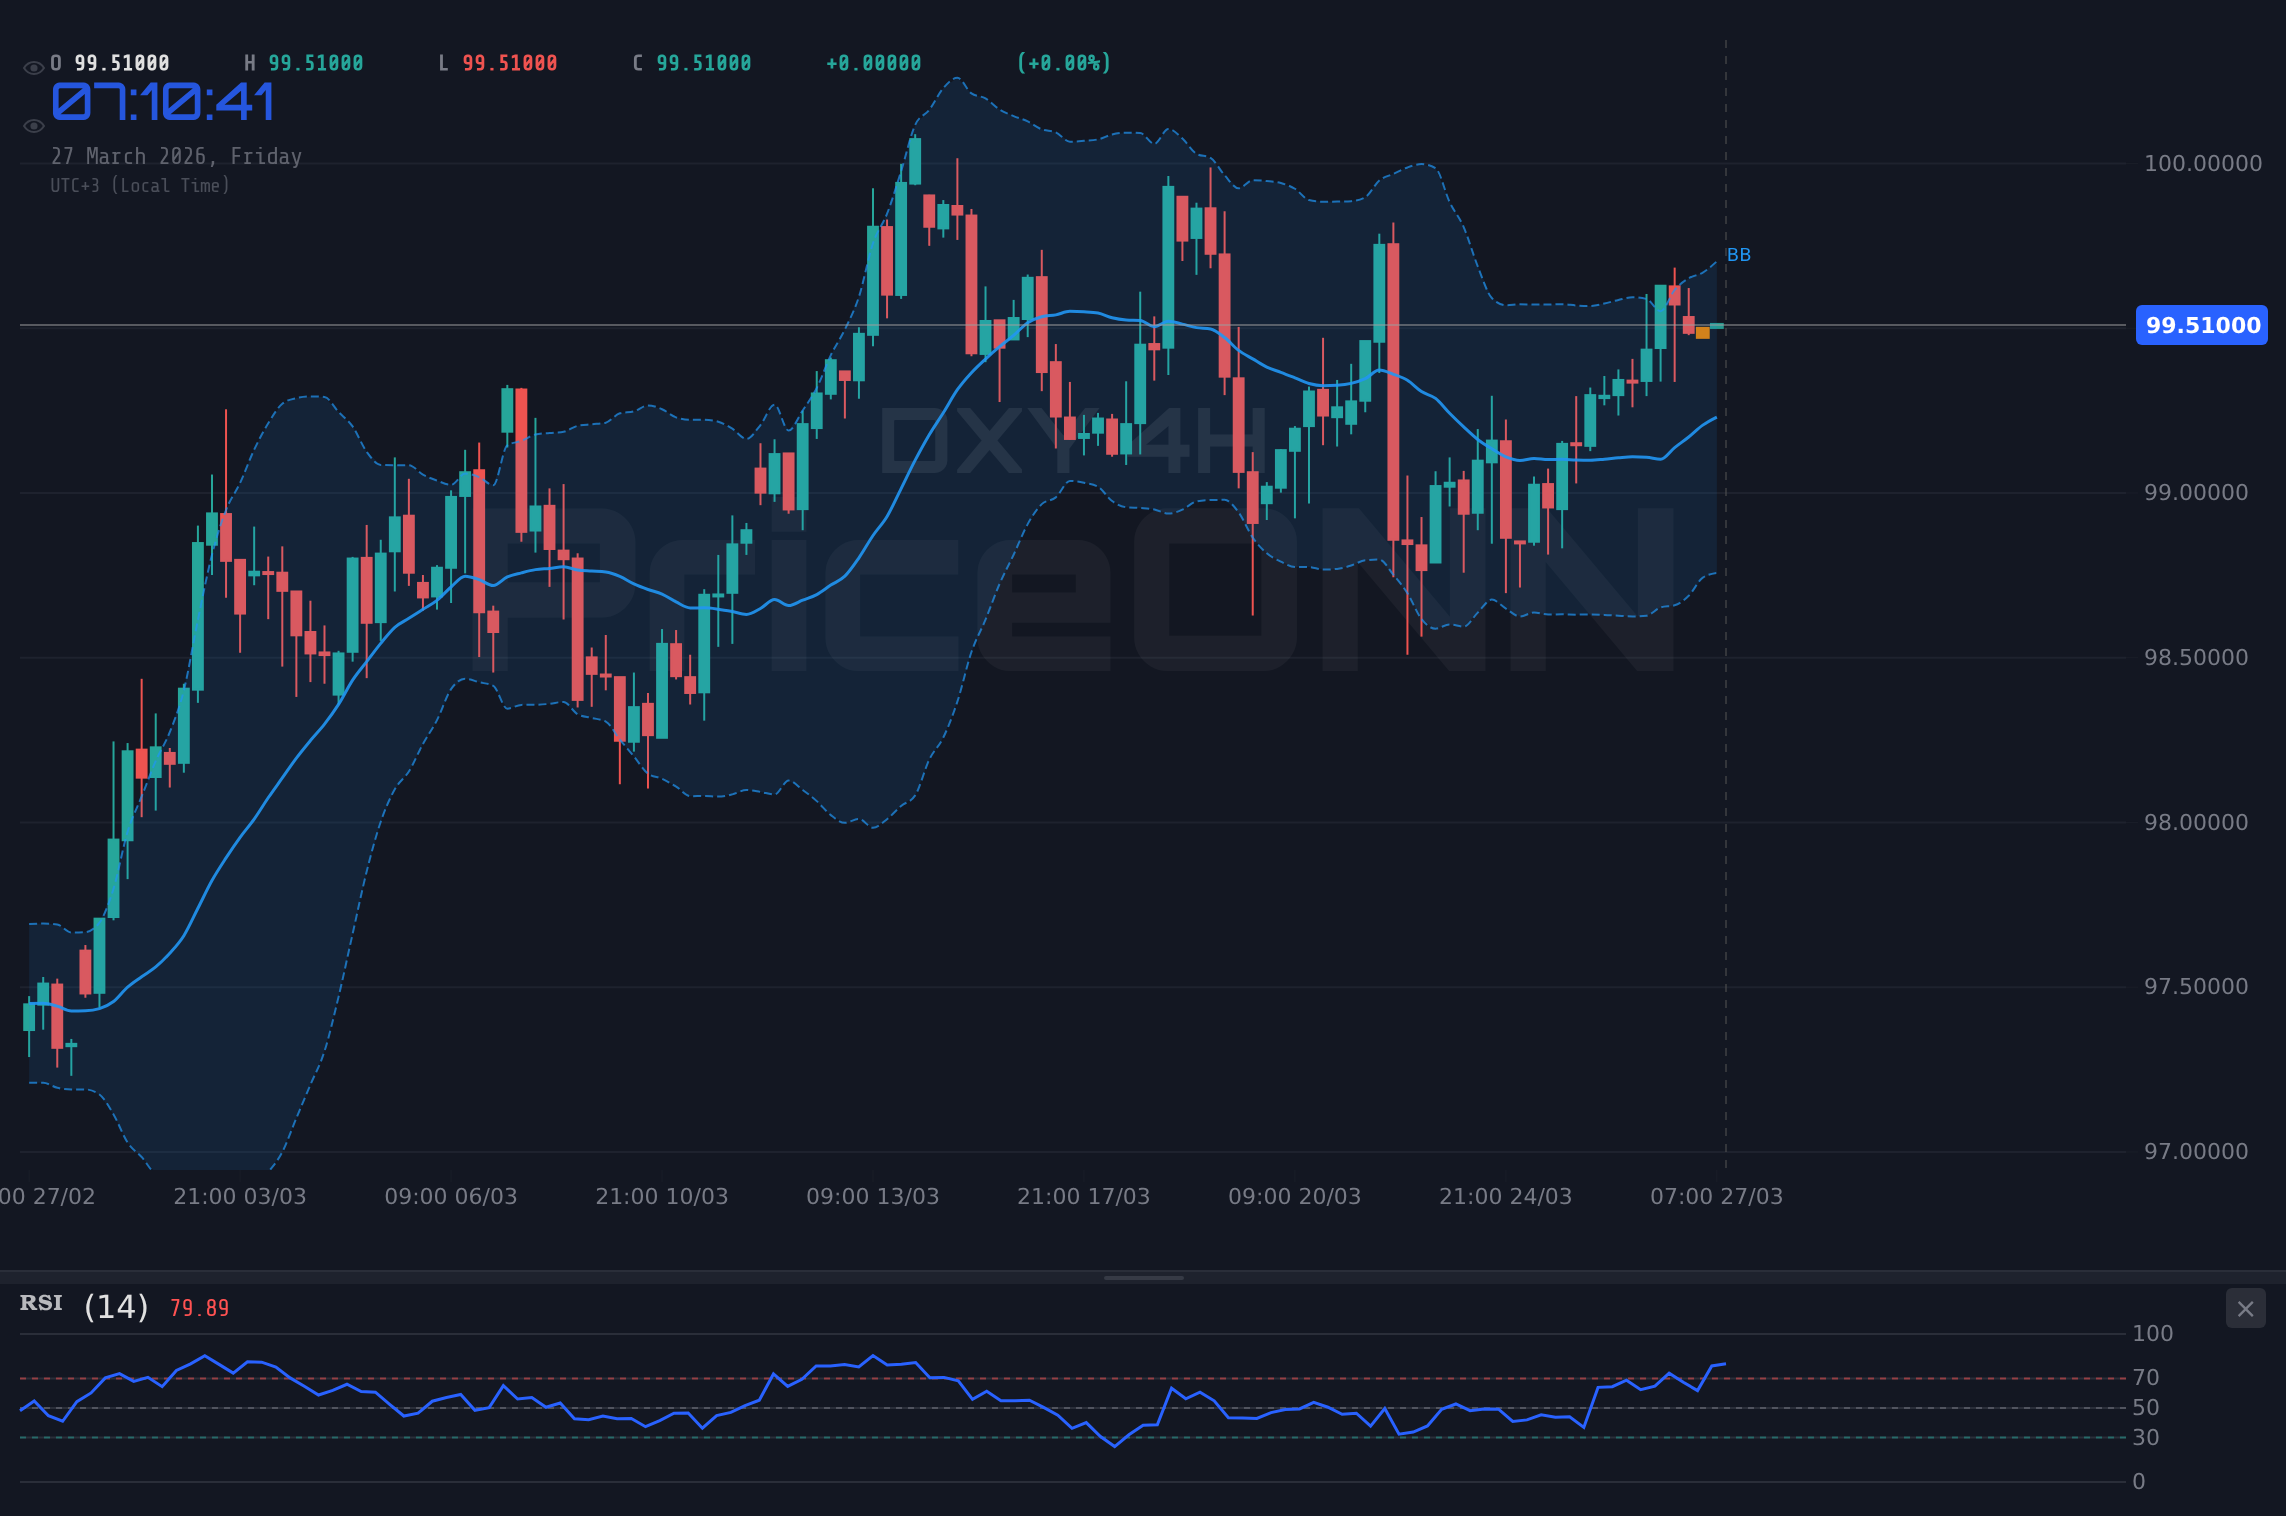
The 4-hour chart presents a more consolidated picture, with the trend strength at 50%. Resistance is seen at $99.73, and a break above it could target $99.88 and $100.07. Support is found at $99.38, $99.18, and $99.03. The ADX at 15.25 on this timeframe indicates a weak trend, suggesting that the market might be coiling for a larger move. The stochastic indicator is in the overbought zone, which, combined with the weak ADX, hints at a potential for a pullback or range-bound trading in the short to medium term before a clear direction emerges.
On the daily chart, the bullish trend remains intact, but the ADX at 31.64 signifies a strong trend that might be approaching exhaustion or a period of consolidation. The immediate resistance is at $99.76, followed by $99.95 and $100.21. Key support levels are located at $99.31, $99.05, and $98.86. The RSI at 59.6 is healthy, but the MACD's negative momentum on the 1-hour chart warrants attention. The overall technical picture suggests that while the underlying trend is bullish, the short-term indicators are flashing mixed signals, pointing towards a possible consolidation phase around the current $99.64 levels.
Trade Scenarios: A Path Forward
Given the current technical and fundamental backdrop, several scenarios could unfold for the DXY. The prevailing bullish sentiment, supported by global risk aversion and Fed policy considerations, suggests that upside potential remains. However, the mixed signals on shorter timeframes indicate that the path forward might not be a straight line.
Bearish Reversal: Consolidation and Pullback
25% ProbabilityRange-Bound Consolidation
45% ProbabilityBullish Continuation: Breaking Higher
30% ProbabilityThe current setup for the DXY is characterized by a strong underlying trend facing short-term headwinds and mixed signals. While the daily trend remains bullish, the 1-hour and 4-hour charts suggest a period of consolidation or a potential minor pullback before the next significant move. Traders should pay close attention to the $99.31 support and $99.76 resistance levels. A confirmed break above $99.76, especially on the daily chart, would reinforce the bullish continuation scenario, potentially targeting $99.95 and $100.21. Conversely, a decisive close below $99.31 would invalidate the immediate bullish outlook and open the door for a deeper correction towards $99.05 and $98.86. The neutral scenario, involving range-bound trading between $99.31 and $99.76, also holds a significant probability given the conflicting short-term signals.
The key takeaway for traders is to remain patient and wait for confirmation. The strong underlying bullish trend on the daily chart, fueled by safe-haven demand and potential Fed hawkishness, suggests that dips might be buying opportunities. However, the short-term consolidation phase means that aggressive entries are not advisable. Waiting for a clear break above $99.76 or a confirmed hold of support at $99.31 would provide a much clearer entry signal with a better risk-reward profile. The market is currently at a crossroads, and the next few trading sessions will be crucial in determining whether the DXY can push higher or if a period of consolidation is due.
Frequently Asked Questions: DXY Analysis
What happens if DXY breaks above the $99.76 resistance level?
A sustained daily close above $99.76 would reinforce the bullish continuation scenario, likely triggering further upside momentum. This could see the DXY testing the psychological $99.95 level, followed by the significant daily resistance at $100.21, especially if risk aversion intensifies.
Is RSI at 59.6 a buy signal for DXY right now?
An RSI of 59.6 on the daily chart indicates bullish momentum but is not yet in overbought territory. While it supports the bullish trend, it doesn't represent an immediate buy signal on its own. Confirmation through a break above resistance or a successful retest of support would be more prudent for entry.
How will escalating Middle East tensions affect DXY's trend?
Escalating Middle East tensions are a significant catalyst for safe-haven demand, which directly benefits the DXY. If these tensions worsen, it would likely accelerate the dollar's upward trend, pushing it towards higher resistance levels as investors seek perceived safety.
Should traders wait for a DXY pullback to $99.31 before considering a long position?
Waiting for a potential pullback to the $99.31 support level could offer a more favorable risk-reward entry point for long positions, especially if this level holds firm. However, a break above $99.76 is also a valid bullish trigger, offering a different entry strategy based on momentum.
Track markets in real-time
AI-powered analysis, technical indicators and real-time price data.
Join Our Telegram Channel
Breaking market news, AI analysis and trading signals instantly.
Join Channel