BRENT Eyes $65.73 as PMI Data Fuels Bullish OPEC Production Cut Impact
BRENT is trading around $65.73, driven by positive PMI data and speculation about further OPEC production cuts. Will bulls sustain the momentum?
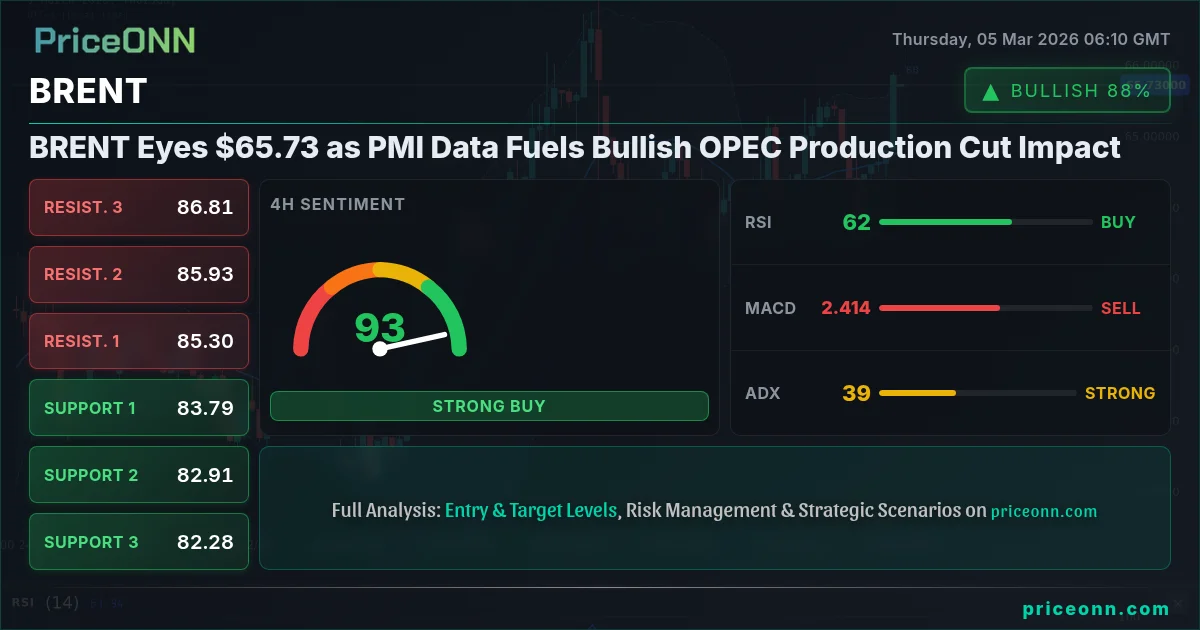
The oil market is currently witnessing a tug-of-war between bullish and bearish forces, with BRENT crude hovering around $65.73. Optimism surrounding potential OPEC production cuts and positive PMI data are fueling the bullish narrative, while concerns about global demand and rising inventories are keeping the bears in check. The "opec production cut impact on brent" is a key factor traders are watching.
- RSI at 71.16 on the 1H chart signals overbought conditions, potentially leading to a short-term pullback.
- Critical resistance sits at $65.42 on the daily chart, a level that needs to be breached for sustained bullish momentum.
- MACD histogram on the 4H chart shows positive momentum, supporting the bullish case in the medium term.
- DXY strength at 98.84 is creating a headwind for BRENT, as a stronger dollar typically weighs on commodity prices.
The Bullish Case for BRENT: Production Cuts and Economic Optimism
The primary driver behind the bullish sentiment is the expectation of further production cuts by OPEC and its allies. With global demand still recovering from the pandemic-induced slump, these cuts are seen as necessary to rebalance the market and support prices. News regarding the potential US-Japan nuclear energy project could influence the energy market, so it is important to stay up-to-date. The anticipation of these cuts is already priced into the market to some extent, but any confirmation or expansion of the cuts could provide a further boost to BRENT prices. Traders are also keenly watching the impact of Middle East tensions on energy markets, particularly in light of recent Iraqi oil output shutdowns as reported by Reuters.
Adding to the bullish case is the recent positive PMI data from major economies, suggesting a rebound in manufacturing activity and increased demand for oil. A stronger-than-expected PMI reading often translates into higher energy consumption, as factories ramp up production and transportation activity increases. The positive PMI data is also boosting risk appetite in the broader market, which tends to be supportive of commodity prices. WTI is showing a strong performance, so traders may be looking at what could influence BRENT. Scalpers might look at the hourly chart, noting the overbought RSI of 71.16, and consider a short position targeting $65.50. Swing traders are more likely to focus on the daily chart and the $65.42 resistance, waiting for a breakout to initiate a long position.
The Bearish Counter-Argument: Demand Concerns and Inventory Build-Up
Despite the bullish factors, there are also several headwinds that could limit BRENT's upside potential. One of the primary concerns is the uncertainty surrounding global demand, particularly in light of the ongoing trade tensions and the potential for a slowdown in economic growth. A prolonged trade war between the US and China, for example, could significantly dampen demand for oil, as businesses cut back on investment and consumers reduce spending. Furthermore, rising inventories in major consuming countries are also weighing on prices, as they suggest that supply is outpacing demand. The aluminum situation and soaring prices due to supply fears can be a glimpse into what could happen with BRENT. A strong dollar, with the DXY at 98.84, adds to the bearish pressures, as it makes oil more expensive for buyers using other currencies.
The daily chart reveals a stochastic reading (%K: 54.52, %D: 58.52) indicating a potential downturn, further bolstering the bearish argument. The ADX is currently at 28.64, signalling a strong uptrend, but a break below key support levels could negate this strength. The recent decline in the SP500 and Nasdaq indexes reflects a risk-off sentiment in the market, potentially driving investors towards safe-haven assets and away from riskier commodities like oil. Long-term investors need to consider the bigger picture, including geopolitical risks and the potential for a supply glut if OPEC fails to maintain production discipline.
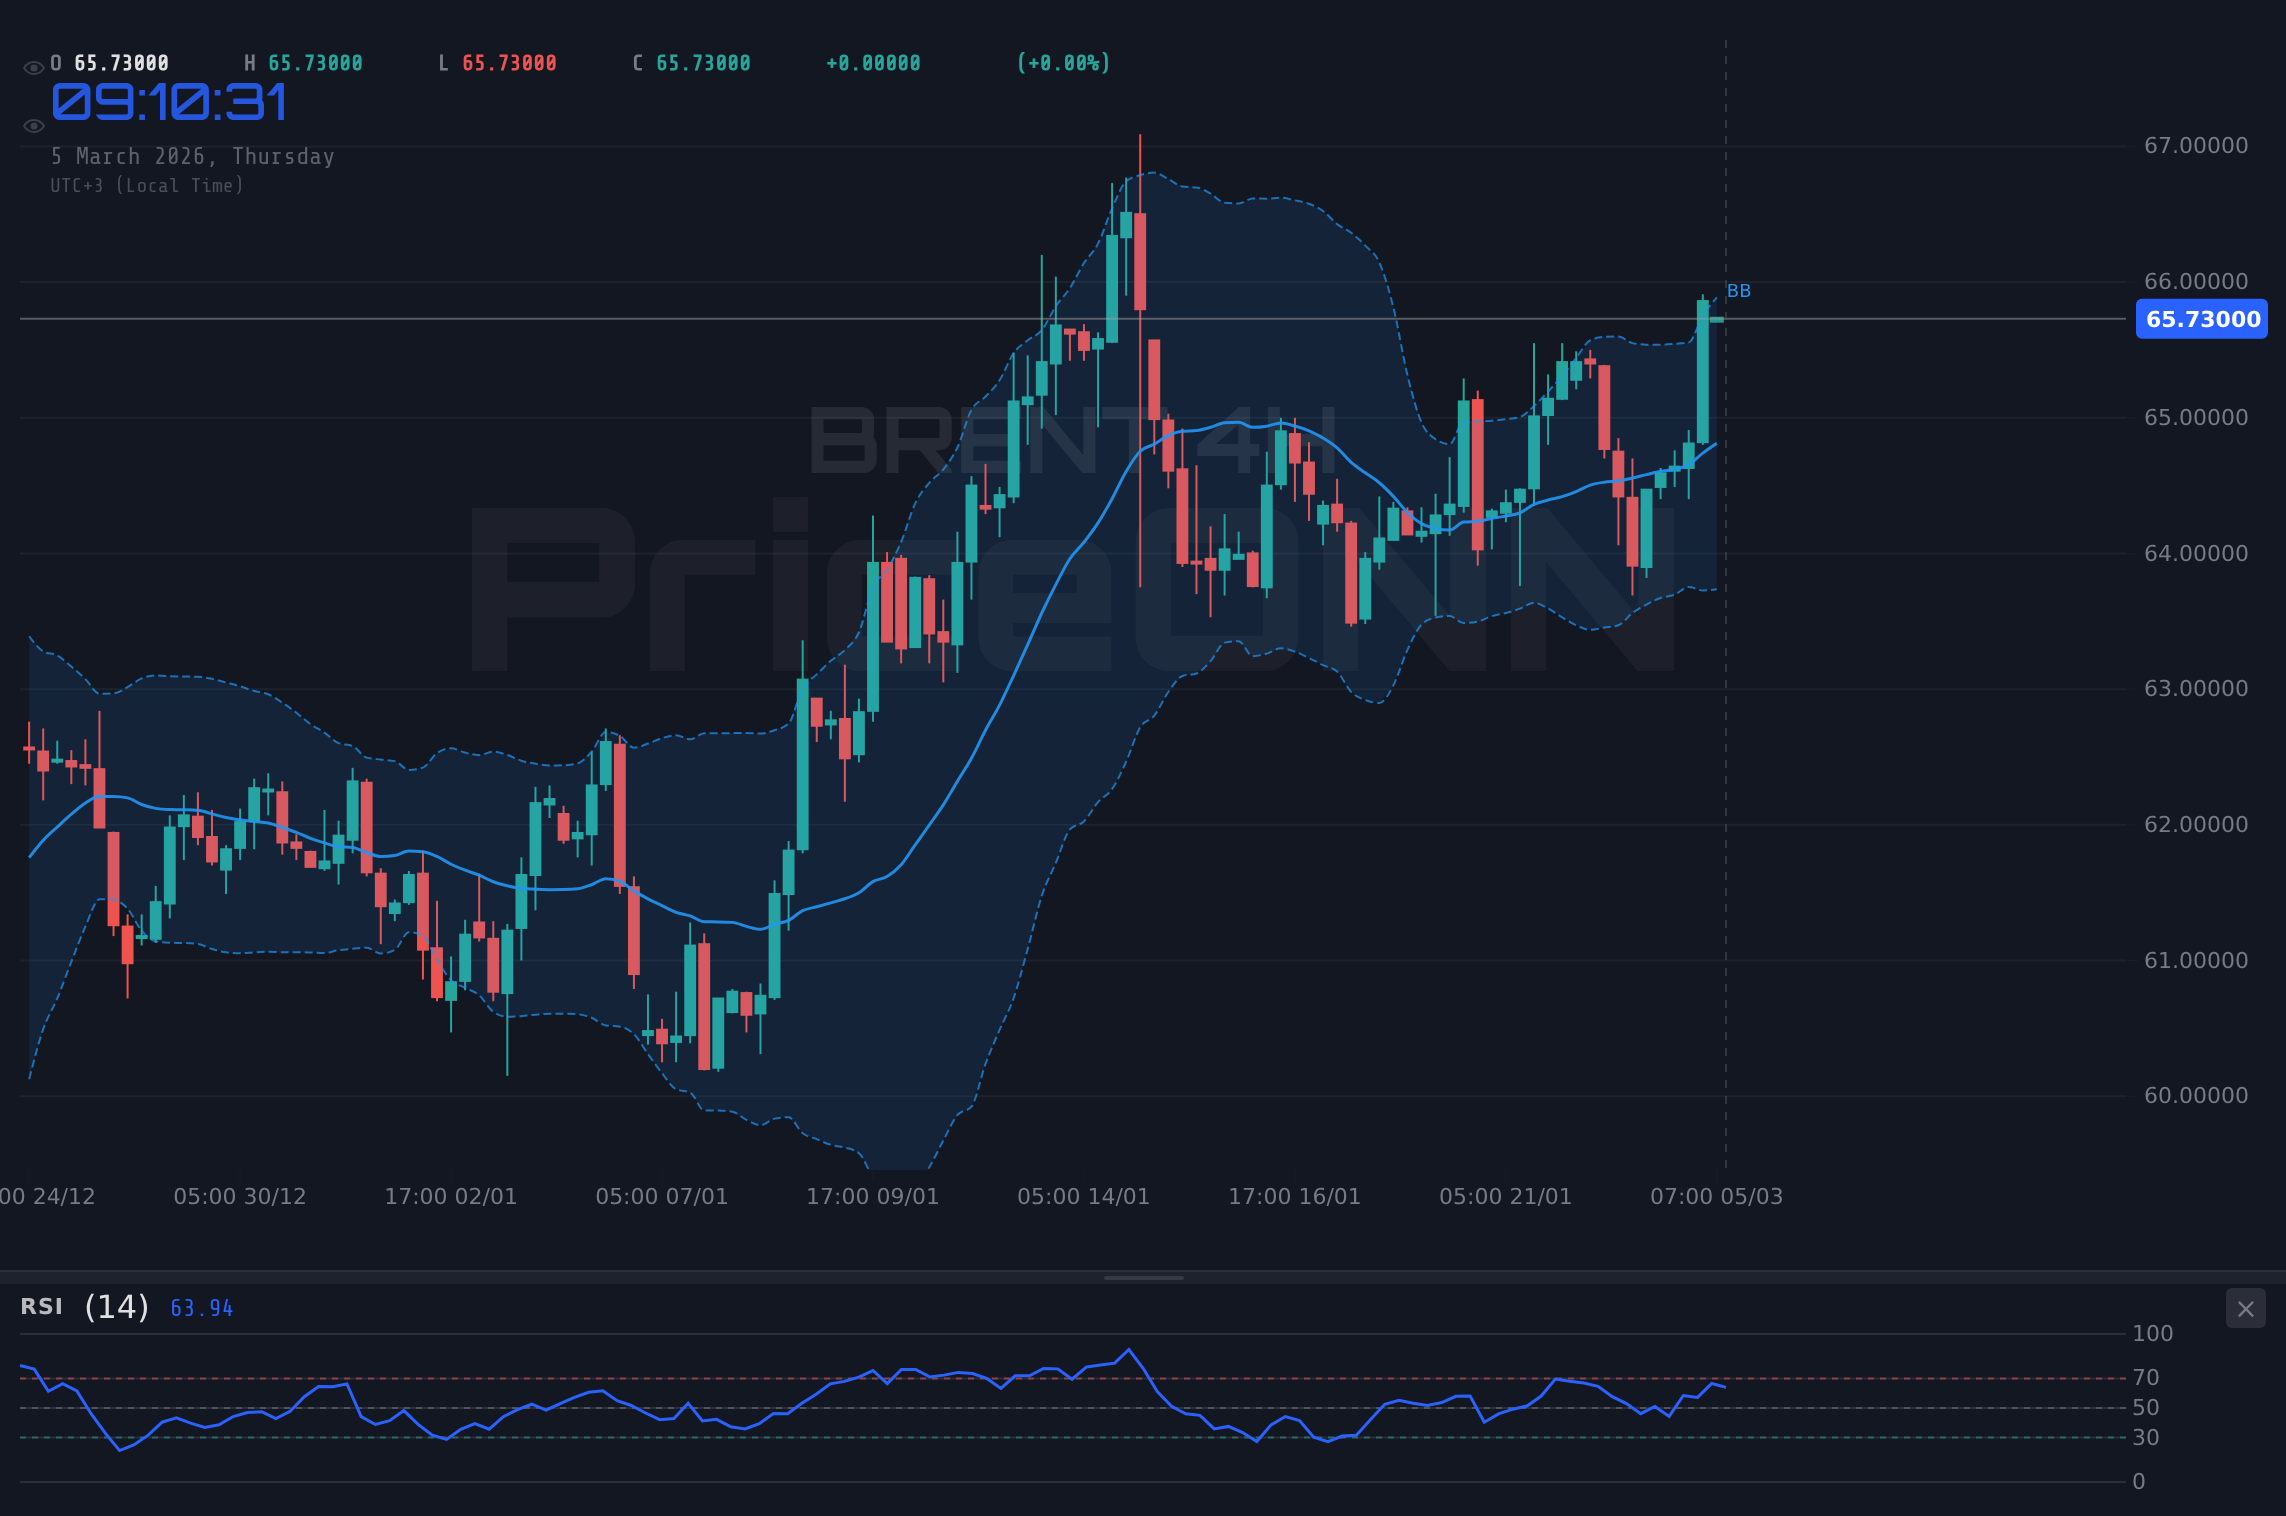
Technicals as the Tiebreaker: Navigating Conflicting Signals
The technical picture for BRENT presents a mixed bag of signals, making it difficult to determine the short-term direction with certainty. On the one hand, the 4-hour chart shows positive MACD momentum, suggesting that the bullish trend is still intact. The RSI on the 4-hour chart, at 62.33, indicates that there is still room for further upside before BRENT becomes overbought. On the other hand, the 1-hour chart shows an overbought RSI and a potential for a short-term pullback. The price action is currently hovering near the middle band of the Bollinger Bands on the daily chart, indicating a lack of clear directional bias. The 1H chart shows an ADX of 19.03, showing a weak uptrend, but this could be negated. The market sentiment surrounding BRENT is another important factor to consider. News headlines and analyst reports can often sway investor sentiment and drive short-term price movements.
A key level to watch is the $65.42 resistance on the daily chart. A sustained break above this level would likely pave the way for further gains, potentially targeting the $66.36 level. Conversely, a failure to break above $65.42 could lead to a pullback towards the $63.61 support level. It's important to note that the current technical picture is based on a snapshot in time and can change rapidly as new information becomes available. Traders should always use multiple indicators and timeframes to confirm their trading decisions and manage their risk accordingly. The USD is a factor, as EUR/USD has been stabilizing. The DXY increasing is likely to put pressure on BRENT.
BRENT Outlook: Watch Zone as Market Awaits Confirmation
Given the conflicting technical signals and the uncertainty surrounding fundamental factors, a neutral stance on BRENT is warranted. The market is currently in a watch zone, awaiting further confirmation from economic data, OPEC decisions, and geopolitical developments. A daily close above $65.42 would open the door for a potential rally towards $66.36, while a break below $63.61 would signal a potential decline towards $62.74. The 1H chart has a Stochastic reading of %K: 90.49 and %D: 81.87, indicating it is overbought. As such, any upside is likely to be limited.
The recent energy market turmoil, as geopolitical tensions in the Middle East disrupt oil output, could provide support for BRENT prices. However, the potential for a renewed trade war between the US and Japan, as reported by Reuters, could dampen demand and limit the upside potential. Traders should also pay close attention to the DXY, as a stronger dollar could put downward pressure on BRENT prices. The recent USD strength is likely to put pressure on BRENT, so it is important to take this into consideration. The 4H chart is signaling a potential move upwards, so this could be a good time to buy if it reaches $65.42. The 1D chart is showing a strong uptrend, so any downside is likely to be limited.
Correlation Analysis: DXY, Equities, and Beyond
Understanding the correlations between BRENT and other asset classes is crucial for making informed trading decisions. The inverse relationship between BRENT and the DXY (Dollar Index) is particularly important to consider. A stronger dollar typically weighs on BRENT prices, as it makes oil more expensive for buyers using other currencies. With the DXY currently at 98.84, BRENT is facing some headwinds. The correlation between BRENT and equities is more complex, as it can vary depending on the prevailing market conditions. In general, a risk-on environment tends to be supportive of both equities and oil, while a risk-off environment can lead to a flight to safety and a decline in both asset classes. The recent decline in the SP500 and Nasdaq indexes reflects a risk-off sentiment, which could put downward pressure on BRENT prices. BRENT is showing a positive change, so traders might look to buy the asset.
Bond yields also play a role in influencing BRENT prices. Rising bond yields can signal expectations of higher inflation, which can be supportive of commodity prices. However, rising yields can also lead to higher borrowing costs for businesses and consumers, which can dampen economic growth and reduce demand for oil. The interplay between these factors can make it difficult to predict the precise impact of bond yields on BRENT prices. The futures market is pricing in some uncertainty, so traders might look to buy BRENT. The 1D chart is showing a strong uptrend, so this could be a good time to buy. However, the stochastic reading on the 1D chart is showing a potential downturn, so it is important to be cautious.
Frequently Asked Questions: BRENT Analysis
Is BRENT a good buy right now?
BRENT is in a watch zone around $65.73. A daily close above $65.42 could signal a buying opportunity, while a break below $63.61 could lead to further declines. It is important to be cautious due to the conflicting technical signals and the uncertainty surrounding fundamental factors.
What is the BRENT price forecast for this week?
The BRENT price forecast for this week is mixed. A sustained break above $65.42 could lead to a rally towards $66.36 (60% probability), while a failure to break above this level could result in a pullback towards $63.61 (40% probability).
What are the key support and resistance levels for BRENT?
Key support levels for BRENT are $63.61, $62.74, and $61.80. Key resistance levels are $65.42, $66.36, and $67.23. These levels are based on the daily chart and should be used in conjunction with other technical indicators.
Why is BRENT moving today?
BRENT is moving today due to a combination of factors, including speculation about further OPEC production cuts, positive PMI data, and concerns about global demand. The strength of the USD, with the DXY at 98.84, is also putting downward pressure on BRENT prices.
Volatility creates opportunity - those prepared will be rewarded. With disciplined risk management, these choppy waters can be navigated safely.
Track markets in real-time
AI-powered analysis, technical indicators and real-time price data.
Join Our Telegram Channel
Breaking market news, AI analysis and trading signals instantly.
Join Channel