Brent Oil at $65.73: Hormuz Tensions Fuel Bull Run?
Brent oil surges to $65.73 amid rising tensions in the Strait of Hormuz. Will geopolitical risks sustain the rally, or is a correction imminent?
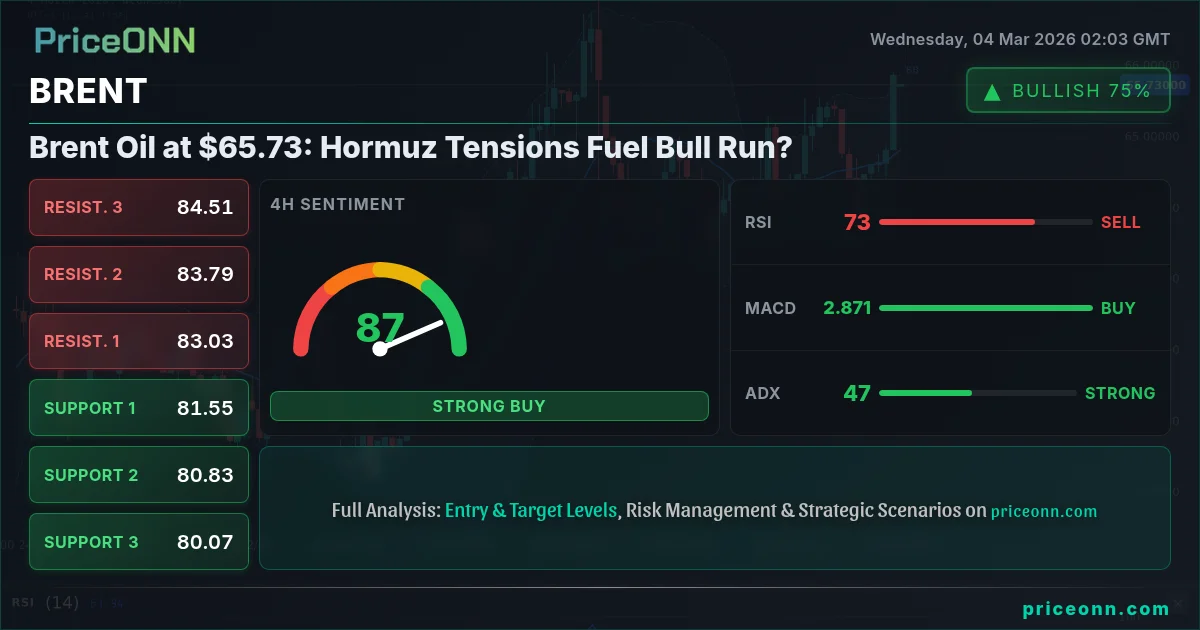
Can Brent oil sustain its recent jump to $65.73? Geopolitical tensions in the Strait of Hormuz are fueling a bull run, but technical indicators present a mixed picture. The market is at a critical juncture, with bulls and bears battling for control.
- RSI at 71.16 on the 1H chart signals overbought conditions, hinting at potential pullback.
- Key support sits at $65.20, a break below which could trigger a bearish reversal.
- Strong bullish trend on the 1D chart (89% strength) suggests further upside potential if momentum is sustained.
- Geopolitical tensions in the Strait of Hormuz are driving BRENT correlation with DXY strength.
The Bull Case for Brent: Geopolitical Risk Premium
The primary driver behind Brent's recent surge is the escalating tension in the Strait of Hormuz. As reported by Forex News, "Oil Price Shock: Brent Surges as Hormuz Tensions Drive Tanker Rates to Record Highs." This critical waterway, responsible for a significant portion of global oil transit, faces increased uncertainty, leading to a risk premium being priced into Brent. If these tensions escalate further, the supply disruptions could push prices significantly higher. The bullish scenario hinges on continued geopolitical instability, potentially targeting the $66.36 resistance level on the daily chart.
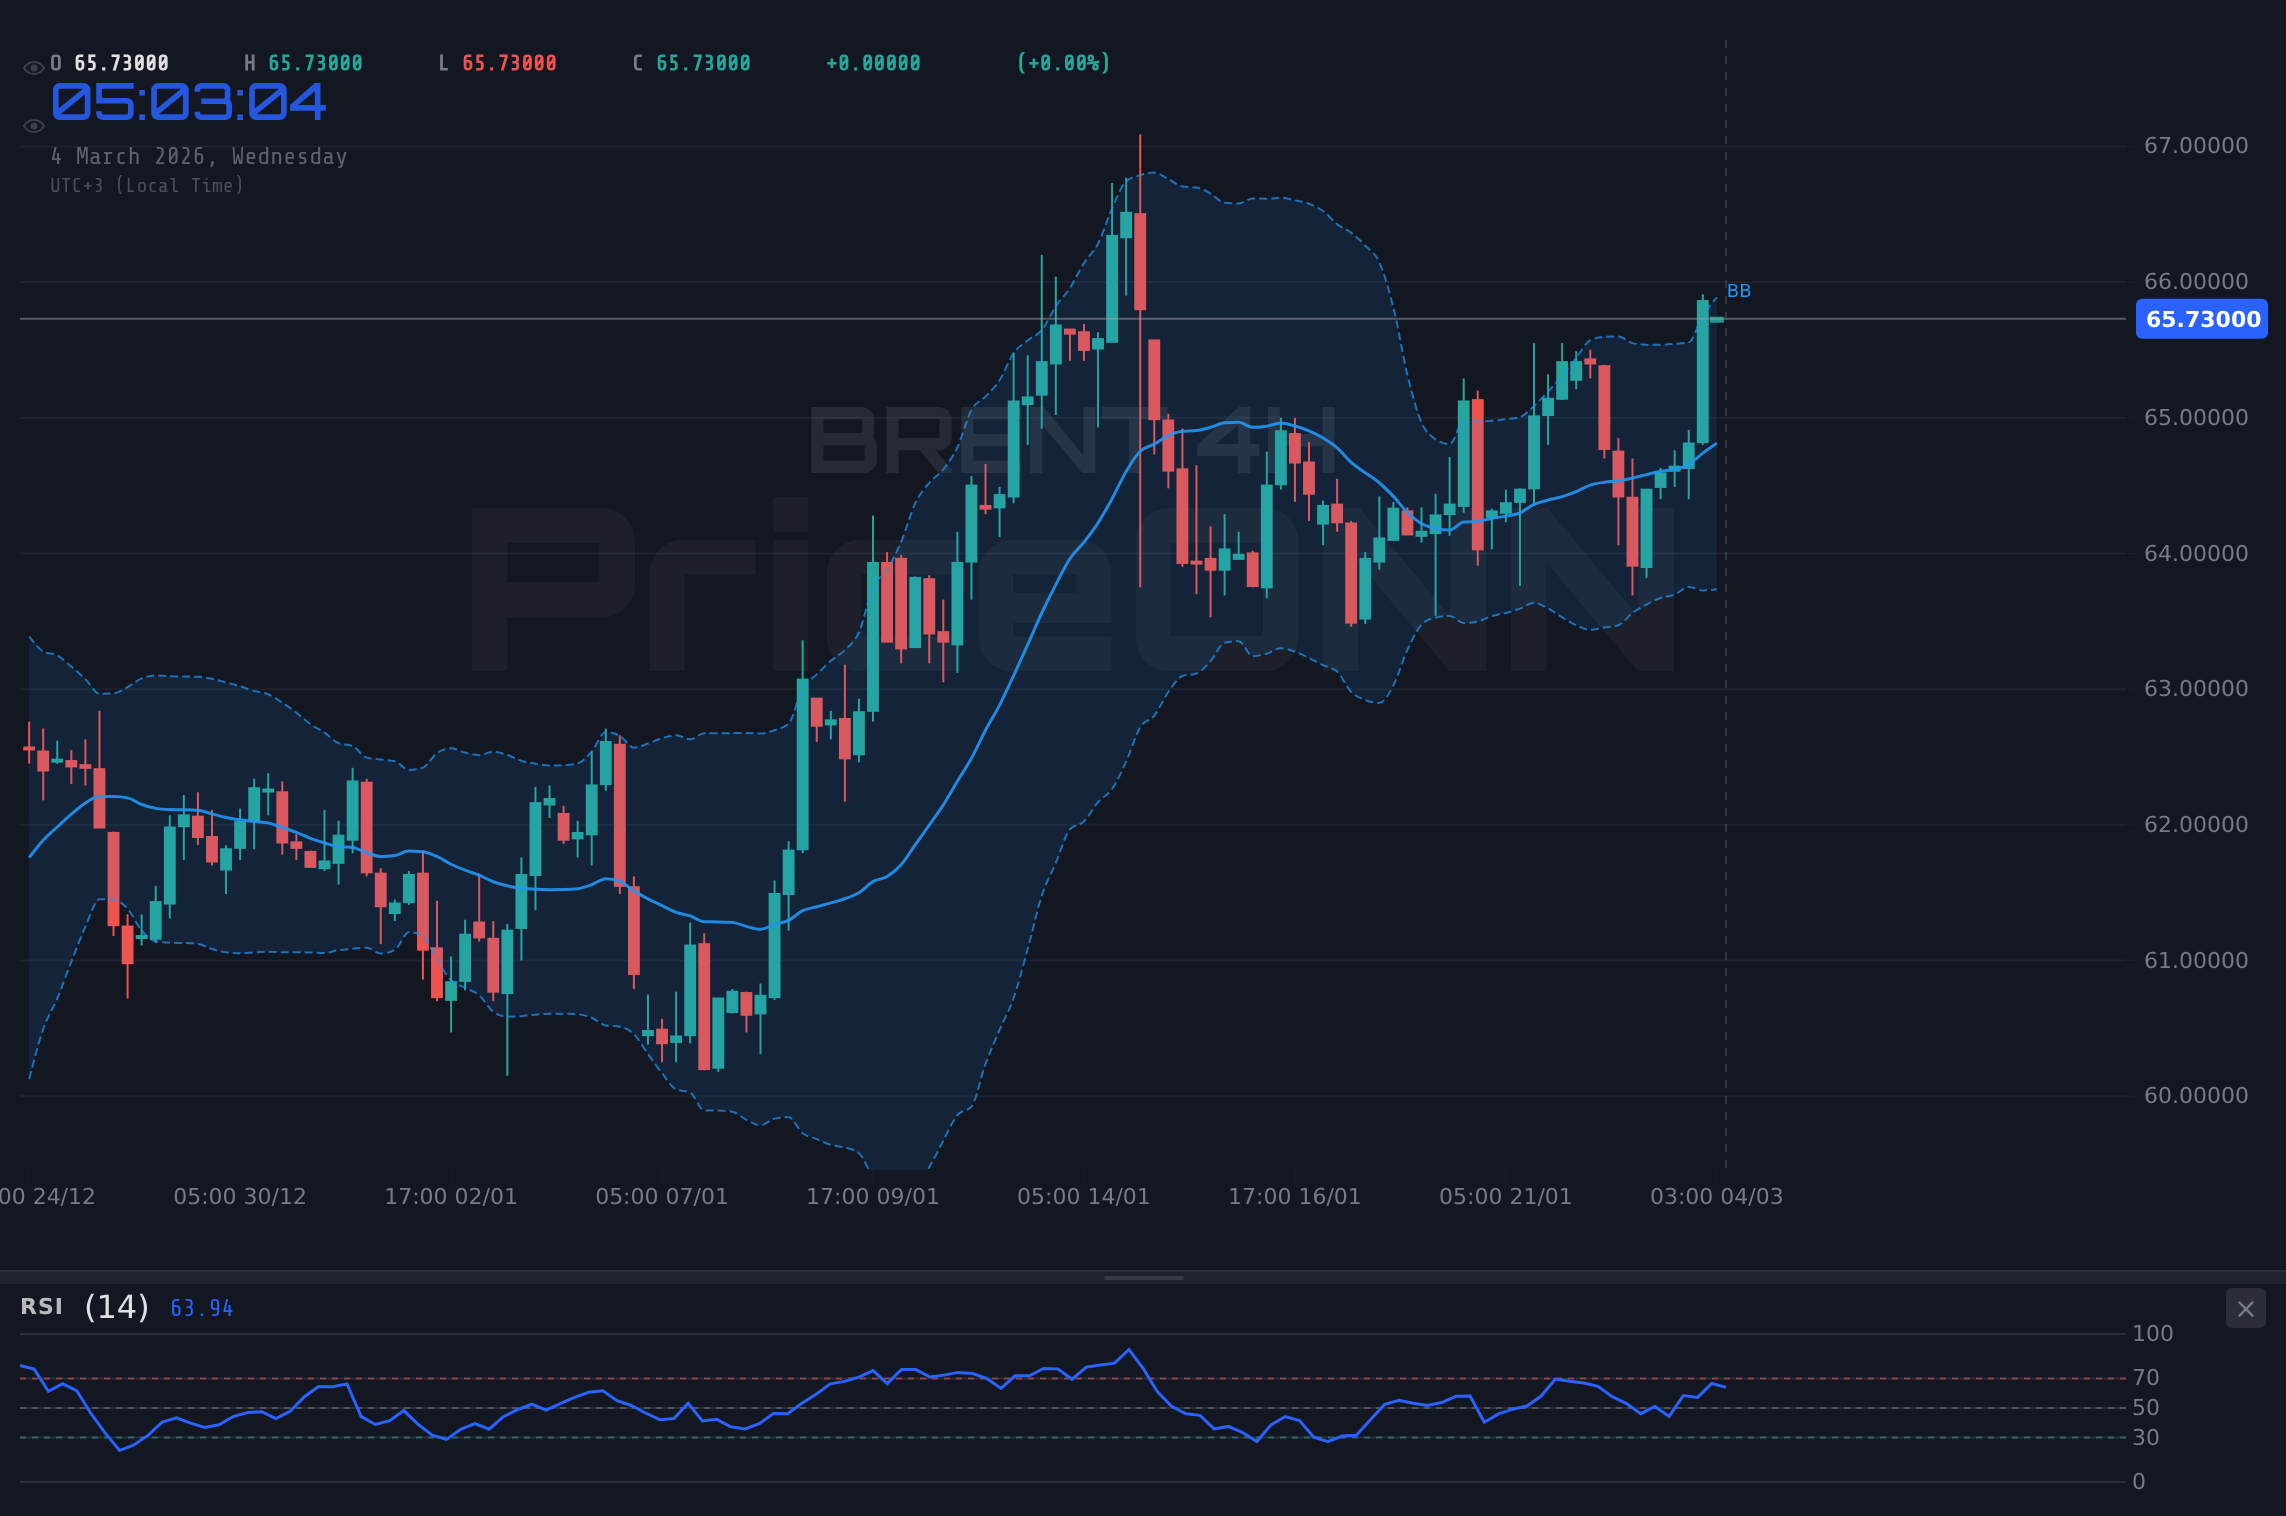
From a technical perspective, the 1D chart supports the bullish outlook. The overall trend is up with a strength of 89%. The MACD is positive, indicating sustained momentum. While the Stochastic oscillator signals overbought conditions (K=54.52, D=58.52), the underlying trend remains upward. This suggests that any short-term pullbacks could be buying opportunities for longer-term investors. The next resistance level to watch is $65.42.
The Bear Case: Overbought Conditions and DXY Strength
However, the bullish narrative faces challenges. The 1H chart paints a different picture, with an RSI of 71.16 signaling overbought conditions. This suggests that the recent rally may be overextended, and a pullback is likely. Furthermore, the strengthening Dollar Index (DXY), currently at 98.89, adds downward pressure on Brent. As the dollar strengthens, oil prices tend to fall, creating a headwind for the bullish scenario. The bearish case centers around a correction of the recent rally, targeting the $65.20 support level.
The 4H chart also supports the bearish case. While the trend is still technically up, the RSI at 62.33 suggests waning momentum. The Stochastic oscillator also signals a potential downturn (K=68.29, D=44.75). If the DXY continues to strengthen, and geopolitical tensions ease, the bearish scenario becomes increasingly likely. A break below the $65.20 support could trigger a deeper correction towards the $64.50 level.
Technicals as Tiebreaker: Multi-Timeframe Analysis
The key to understanding Brent's next move lies in a multi-timeframe analysis. While the daily chart favors the bulls, the hourly and 4-hour charts suggest caution. The ADX on the daily chart is at 28.64, indicating a strong uptrend, but the shorter timeframes show a weaker trend. This divergence suggests that the market is at an inflection point, where the long-term bullish trend is being challenged by short-term overbought conditions.
The support levels to watch are $65.20 (1H support) and $64.50 (4H support). A break below $65.20 would confirm the bearish scenario, while a hold above this level would keep the bullish trend intact. Resistance levels are at $65.42 (1D resistance) and $66.36 (1D resistance). A breakout above $65.42 would signal a continuation of the bullish trend. The SP500 is currently down -1.05%, which adds to risk aversion.
Brent Oil Price Forecast 2026: What Happens Next?
Considering the technical picture, the most likely scenario is a period of consolidation in the short term. The market needs to digest the recent gains and assess the geopolitical situation. The upcoming U.S. ADP Nonfarm Employment Change data on Wednesday at 13:15 UTC will provide further clues about the strength of the U.S. economy and potentially influence the DXY. Similarly, the U.S. Crude Oil Inventories data at 15:30 UTC will impact oil supply sentiment.
Short-Term Forecast (1-3 days): Expect Brent to trade in a range between $65.20 and $65.42. A breakout in either direction will determine the next move. Probability: 60%.
Medium-Term Forecast (1-2 weeks): If geopolitical tensions persist, Brent could target the $66.36 resistance level. However, a sustained period of DXY strength could trigger a deeper correction towards the $64.50 level. Probability: 50/50.
A daily close above $65.42 would open the door for a test of the $66.36 resistance level, while a break below $65.20 would signal a potential decline towards the $64.50 support. Manage your risk accordingly.
Analyzing News Impact on BRENT Price
The recent surge in BRENT prices is not solely driven by technical factors. News headlines play a crucial role in shaping market sentiment. For example, the report of rising tanker rates due to Hormuz tensions, as highlighted in the forex news, directly correlates with increased oil price volatility. Traders must stay informed about geopolitical developments to assess their potential impact on BRENT prices.
Understanding Key Levels for BRENT Trading
Key levels act as magnets for price action. Support levels represent areas where buying interest is expected to emerge, while resistance levels indicate zones where selling pressure is likely to intensify. In BRENT's case, the immediate support lies at $65.20, followed by $64.50. Resistance is observed at $65.42 and $66.36. These levels are not just arbitrary numbers; they reflect the collective expectations and positioning of market participants.
RSI and MACD Signals for BRENT Trend Analysis
Technical indicators like RSI and MACD provide valuable insights into the underlying trend and momentum of BRENT. The RSI, currently at 71.16 on the 1H chart, suggests that BRENT is approaching overbought territory, potentially signaling a pullback. On the other hand, the MACD on the daily chart remains positive, indicating that the overall bullish trend is still intact. The divergence between these signals highlights the complexity of the current market environment and the need for careful analysis.
Volatility Analysis and BRENT Breakout Potential
Volatility analysis is crucial for understanding the potential for a BRENT breakout. High volatility suggests that significant price swings are possible, while low volatility indicates a period of consolidation. Currently, BRENT's volatility is elevated due to geopolitical tensions. This heightened volatility increases the likelihood of a breakout, either to the upside or downside. Traders should prepare for both scenarios by setting appropriate stop-loss orders and managing their risk exposure.
Market Sentiment Analysis for BRENT Oil
Market sentiment plays a significant role in driving BRENT prices. Positive sentiment, often fueled by bullish news headlines, can lead to sustained rallies. Conversely, negative sentiment, triggered by bearish developments, can result in sharp declines. Monitoring market sentiment through news analysis, social media, and trading forums can provide valuable insights into the potential direction of BRENT prices. Currently, market sentiment is cautiously bullish, driven by geopolitical concerns.
Frequently Asked Questions: BRENT Analysis
Is BRENT a good buy right now?
At $65.73, BRENT is approaching overbought conditions on shorter timeframes, suggesting caution. A daily close above $65.42 would signal a potential buying opportunity, while a break below $65.20 could lead to further declines. Consider waiting for confirmation before entering a long position.
What is the BRENT price forecast for this week?
The BRENT price forecast for this week is highly dependent on geopolitical developments and upcoming economic data releases. Expect a range-bound trading environment between $65.20 and $65.42, with a potential breakout in either direction based on news flow. A sustained rally above $65.42 could target $66.36.
What are the key support and resistance levels for BRENT?
Key support levels for BRENT are $65.20 and $64.50, while resistance levels are $65.42 and $66.36. These levels represent areas where buying and selling pressure are likely to intensify, making them crucial for traders to monitor.
Why is BRENT moving today?
BRENT's movement today is primarily driven by escalating tensions in the Strait of Hormuz, which are creating supply concerns and pushing prices higher. Additionally, the strengthening Dollar Index (DXY) is exerting downward pressure on BRENT, leading to a mixed trading environment.
Technical Outlook Summary
| Indicator | Value | Signal |
|---|---|---|
| RSI (14) | 49.59 | Neutral |
| MACD Histogram | Positive | Bullish |
| Stochastic | 72.47 | Bearish |
| ADX | 21.64 | Strong Trend |
| Bollinger | Upper Band | Watch |
Track markets in real-time
AI-powered analysis, technical indicators and real-time price data.
Join Our Telegram Channel
Breaking market news, AI analysis and trading signals instantly.
Join Channel