

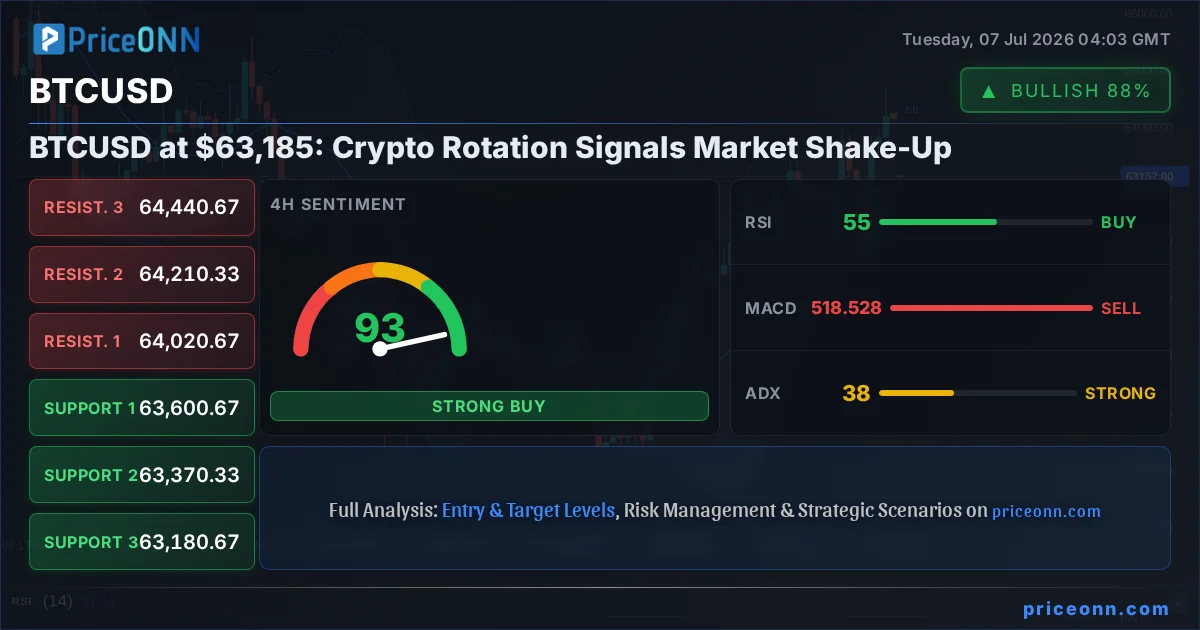
The cryptocurrency market, particularly Bitcoin (BTCUSD), is currently experiencing a significant rotation, a phenomenon that traders watch closely for shifts in momentum and potential trend changes. At $63,185.00, BTCUSD is navigating a complex landscape where traditional market dynamics are increasingly influencing digital asset flows. This isn't just another price fluctuation; it's a sign that the broader financial ecosystem's rotations are casting a long shadow over the crypto space, demanding a closer look at both technical indicators and the underlying economic currents.
- RSI at 46.92 on the 1H chart signals bearish pressure, while the 1D RSI at 49.89 suggests a neutral stance, indicating indecision.
- Critical support for BTCUSD sits at $62,099.33, a level that has held previously and is now being tested amidst market rotation.
- MACD histogram on the 1H shows negative momentum, suggesting a weakening short-term trend, while the 1D MACD remains positive, indicating a longer-term bullish bias.
- The correlation with DXY, currently at 100.89, is a key factor; a stronger dollar often correlates with weaker crypto prices, and vice-versa.
The past week has seen a palpable shift in market sentiment across asset classes, and crypto has not been immune. While equities, particularly the S&P 500 and Nasdaq, have been experiencing their own rotations, the impact on Bitcoin and its altcoin brethren is undeniable. This isn't a simple matter of Bitcoin acting in isolation; rather, it's a reflection of capital seeking different havens and growth opportunities. As traders analyze the data, the $63,185 level for BTCUSD becomes a focal point, representing a crucial juncture where the prevailing sentiment could either solidify or pivot.
The current price action for BTCUSD, hovering around $63,185.00, paints a picture of cautious trading. The 1-hour timeframe shows a bearish trend with an ADX of 20.06, indicating that short-term momentum is leaning downwards, though the trend strength is only moderate. This is corroborated by the 1H RSI at 46.92, firmly in neutral territory but trending lower, suggesting sellers are gaining a slight edge in intraday trading. The MACD on this timeframe is also below its signal line with negative momentum, reinforcing the short-term bearish sentiment. However, looking at the broader 1-day chart, the picture becomes more nuanced. The 1D RSI at 49.89 is neutral, indicating a market in balance, and the MACD is still above its signal line with positive momentum, hinting that the longer-term bullish structure might still be intact despite the recent rotation.
The Shifting Sands of Market Sentiment
The term 'rotation' in financial markets refers to the movement of capital from one asset class or sector to another. Recently, we've observed this phenomenon playing out across traditional markets, with the S&P 500 and Nasdaq indices showing signs of a shift. Reports indicate that seasonal factors and strong earnings are providing some support to equities, but the underlying rotation suggests a re-evaluation of risk appetite. When risk appetite wanes in traditional markets, it often spills over into riskier assets like cryptocurrencies. This is where the correlation between the Dollar Index (DXY) and BTCUSD becomes particularly interesting. With DXY currently trading at 100.89, any upward pressure on the dollar, often seen as a safe-haven asset, can lead to downward pressure on assets like Bitcoin, which are perceived as higher risk.
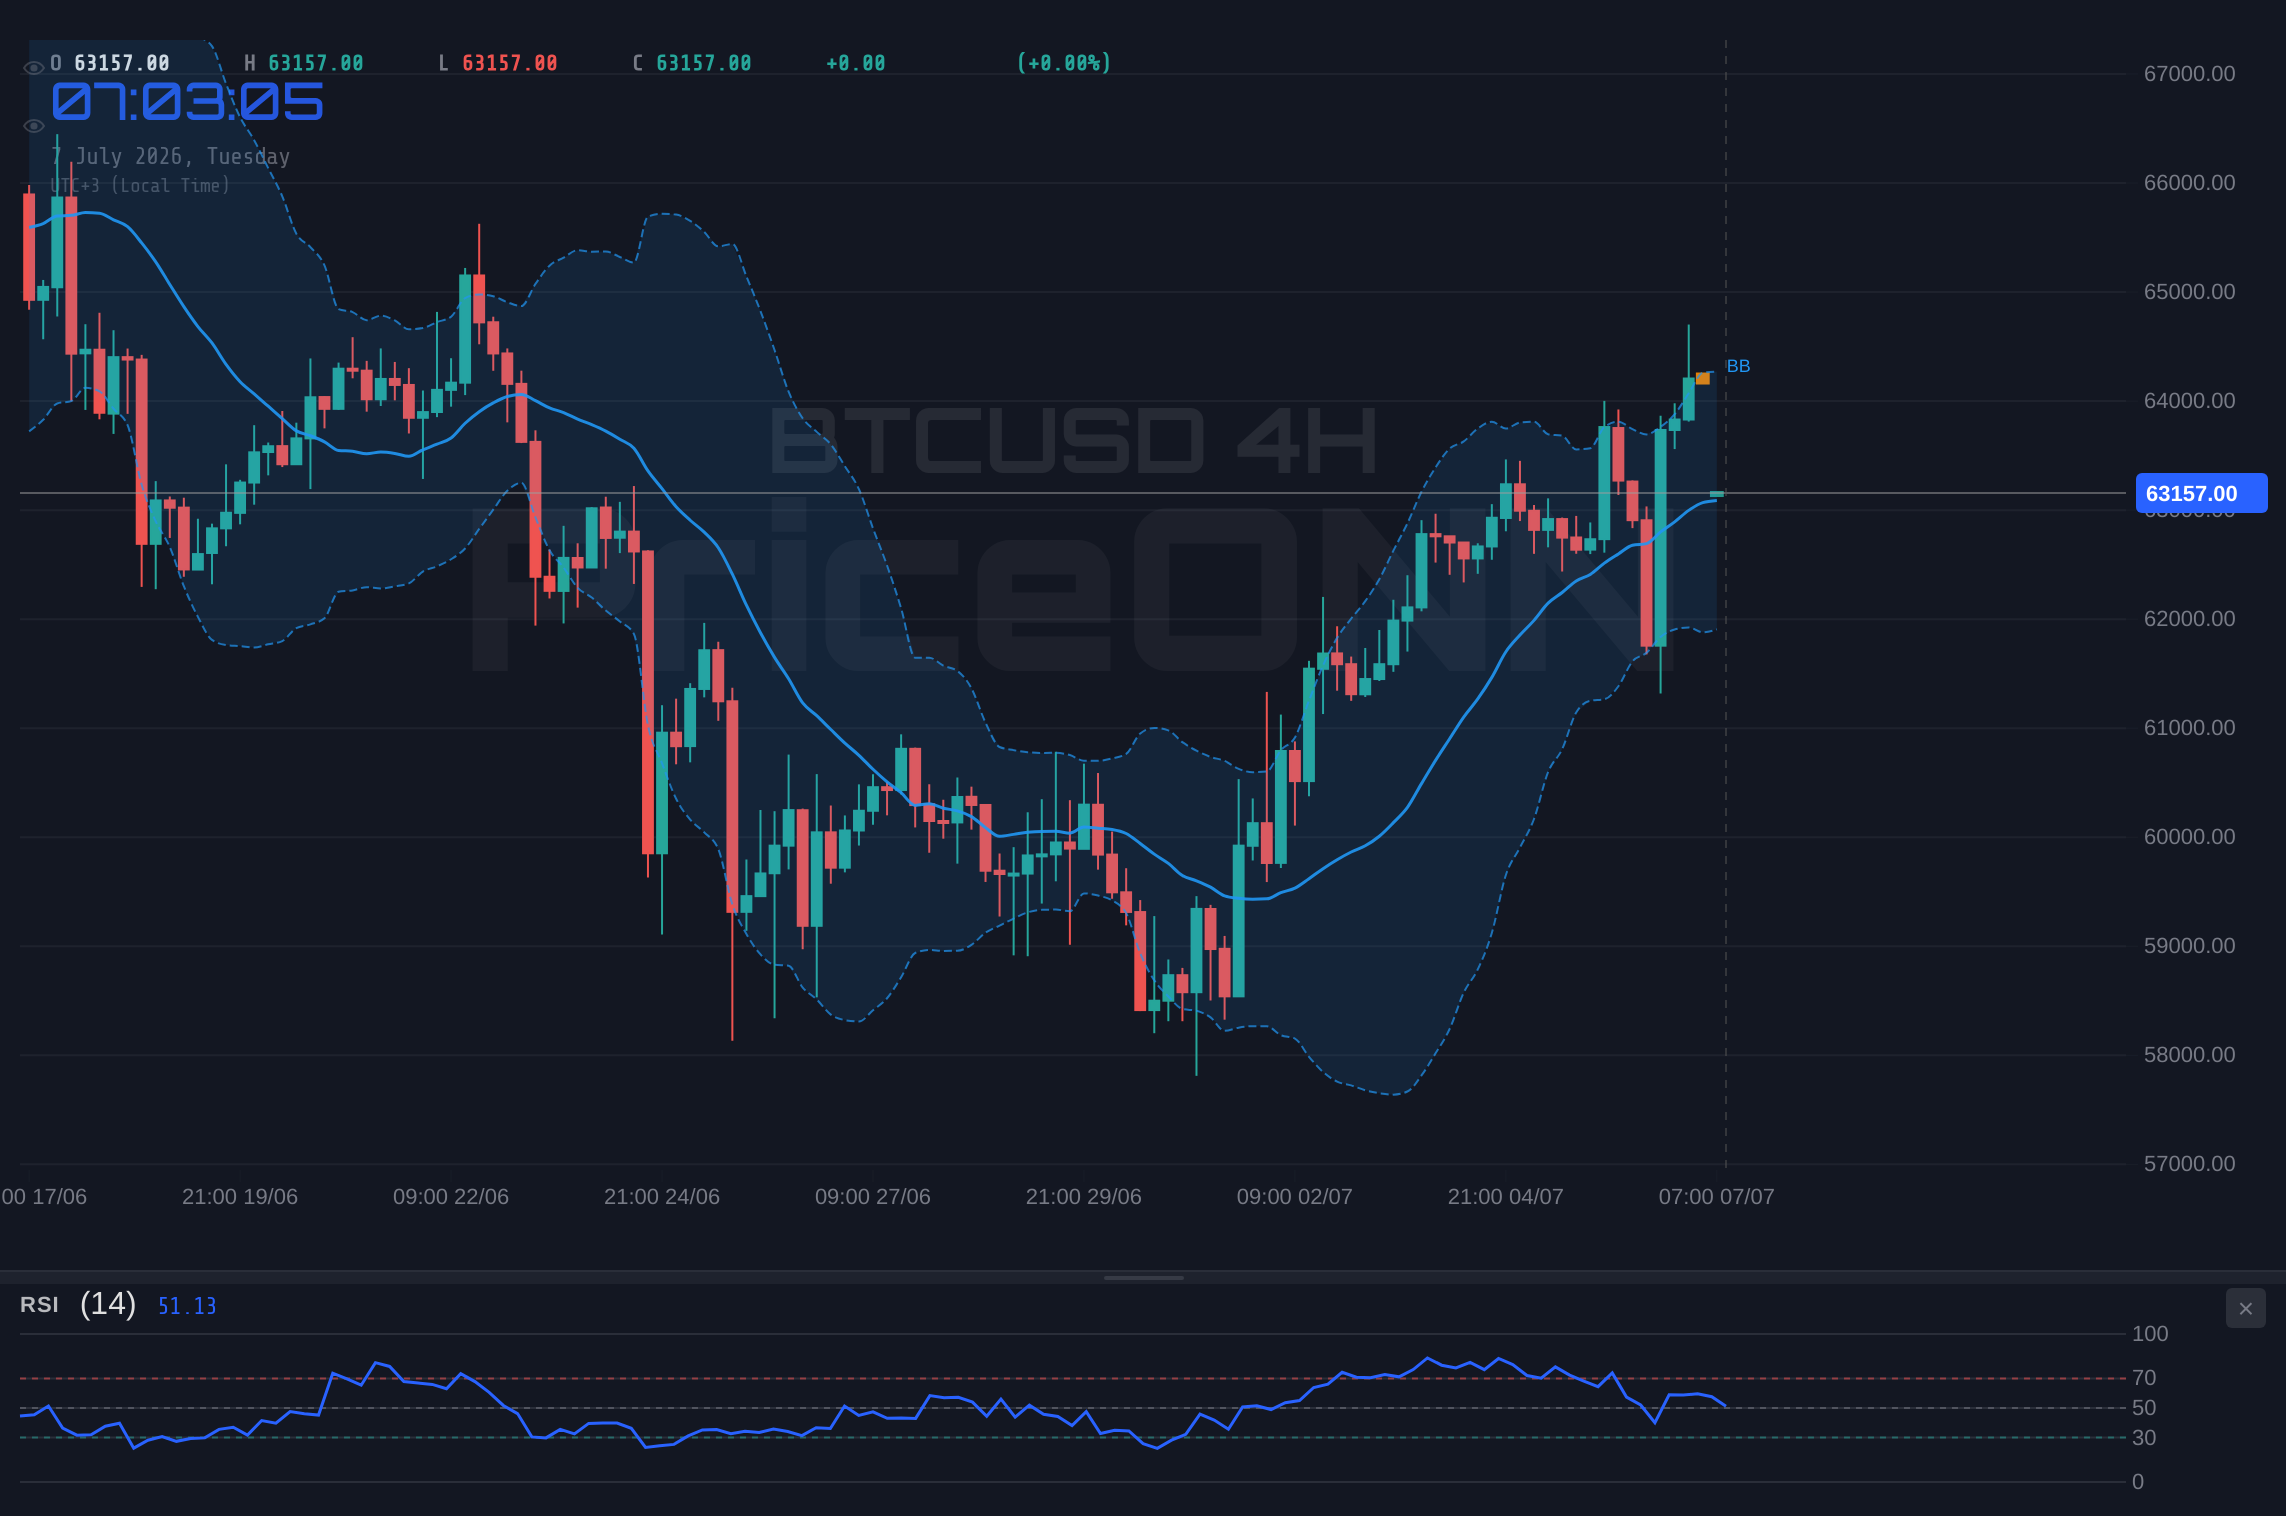
The 4-hour BTCUSD chart presents a slightly more optimistic view than the 1-hour, showing a generally bullish trend with an ADX of 37.8, indicating strong upward momentum. The RSI at 55.67 is in the neutral zone, trending upwards, and the Stochastic oscillator shows %K (79.61) above %D (54.03), signaling a potential bullish continuation. This conflict between the short-term bearish signals and the medium-term bullish indicators highlights the current indecision and the importance of the $63,185 level as a pivot. Traders are essentially waiting to see which timeframe's sentiment will prevail. The divergence between the 1H and 4H ADX values - 20.06 versus 37.8 - further underscores this multi-timeframe conflict, suggesting that while a broader uptrend might be present, the immediate pressure is downwards.
Correlation with Traditional Markets: A Deeper Dive
The influence of macroeconomics on cryptocurrency markets cannot be overstated. The recent data releases from the US, such as the cooling labor market, have had ripple effects across global markets. Weakening employment data often leads to speculation about central bank policy, particularly the Federal Reserve. If the Fed is perceived to be nearing the end of its tightening cycle or even considering rate cuts, this can boost risk assets. However, the current DXY level at 100.89 suggests the dollar is still relatively strong, which typically acts as a headwind for assets priced in dollars, including Bitcoin. The inverse relationship is not always perfect, but it's a significant factor for traders to consider when assessing BTCUSD's short-term prospects. The fact that the S&P 500 is showing signs of rotation, moving away from growth stocks towards value or defensive sectors, could also indicate a broader de-risking trend that might see capital flow out of speculative assets.
On the 1-day BTCUSD chart, the trend is neutral, with an ADX of 29.57, suggesting a strong trend is not yet established, but the momentum is leaning towards a downtrend according to the ADX value. The RSI at 49.89 is right on the cusp of neutral, offering no clear direction. However, the MACD is positive and above its signal line, which is a bullish signal in the longer term. The Stochastic is also showing a bullish crossover with %K at 87.42 and %D at 77.82, indicating an overbought condition but a strong upward momentum signal. This conflicting set of signals across different timeframes – bearish on 1H, bullish on 4H, and mixed but leaning bullish on 1D – is characteristic of a market undergoing a rotation. The key question is whether the short-term bearish pressure will overcome the longer-term bullish potential, or if the current price around $63,185 represents a consolidation before the next leg up.
On-Chain Metrics: A Mixed Bag
Diving deeper into the crypto-specific fundamentals, on-chain data presents a similarly mixed picture. Active addresses, a key metric for gauging network health and user engagement, have seen some fluctuations but haven't shown a decisive trend that would confirm a strong bullish or bearish conviction. Whale movements, referring to large holders moving significant amounts of BTC, are always under scrutiny. Any large accumulation or distribution by these entities can provide clues about market sentiment. Currently, there are no overt signs of massive whale capitulation or accumulation that would signal an immediate major price move, but rather a cautious approach from larger players.
Exchange flows also offer insights. If we see a significant net inflow of BTC to exchanges, it could indicate selling pressure, as holders move assets to liquidate. Conversely, net outflows suggest accumulation and a belief in future price appreciation. The current data does not point to extreme flows in either direction, reinforcing the notion of a market in consolidation or transition. The hash rate, a measure of the network's security and processing power, remains robust, which is a positive fundamental for Bitcoin's long-term viability. However, this fundamental strength isn't translating into immediate price strength, likely due to the broader market rotation and sentiment shifts.
Navigating the Rotation: What Traders Should Watch
For traders and investors, navigating this period of rotation requires a disciplined approach. The $63,185 level for BTCUSD is critical. A decisive break and sustained hold above this price could signal a resumption of the bullish trend, especially if it coincides with a weakening DXY and a more risk-on sentiment in equities. Key resistance levels to watch on the upside are around $64,782.33, $65,733.67, and $67,465.33. These levels represent potential targets if the bulls regain control.
Conversely, a failure to hold $63,185 and a subsequent break below the support levels could signal a deeper correction. The immediate support lies at $62,099.33, followed by $60,367.67 and $59,416.33. A break below these levels, particularly $62,099.33, would likely invalidate the short-to-medium term bullish outlook and could lead to further downside, potentially retesting lower price points. The ADX values across different timeframes - 20.06 on 1H, 37.8 on 4H, and 29.57 on 1D - suggest that while the 4H trend is strong, the overall market lacks a clear, committed direction across all timeframes, making the $63,185 level a crucial battleground.
The Role of Altcoins and DeFi
The rotation isn't confined to Bitcoin; it also impacts the altcoin market and the broader Decentralized Finance (DeFi) ecosystem. During periods of uncertainty or risk-off sentiment, capital tends to flow towards more established assets, which in crypto's case means Bitcoin, or even back into stablecoins. This can lead to a decline in altcoin prices and a decrease in Total Value Locked (TVL) in DeFi protocols. While specific altcoin data isn't provided, the general principle holds: a market rotation often sees Bitcoin dominance increase as investors seek perceived safety within the crypto space. Developments in the DeFi and NFT sectors are also closely watched. Any significant innovation or adoption trend could, in theory, provide a counter-narrative, but currently, the macro rotation appears to be the dominant force.
The lack of clear directional signals from indicators like the 1D RSI (49.89) and the conflicting signals from MACD and Stochastic across different timeframes highlight the current market's indecision. The 1H chart's bearish lean, with RSI at 46.92 and negative MACD momentum, suggests immediate caution. However, the 4H chart's bullish trend (ADX 37.8) and the 1D chart's positive MACD momentum and bullish Stochastic crossover offer a glimmer of hope for the bulls. This divergence means that traders need to be particularly vigilant about confirmation. A clear move above the 1H resistance at $63,726.67 could be the first sign of a bullish turnaround, while a drop below the 1H support at $62,892.33 would confirm the short-term bearish bias.
Regulatory Landscape and Institutional Interest
Regulatory developments continue to be a significant backdrop for the cryptocurrency market. While there are no specific recent regulatory news items directly impacting BTCUSD in the provided snippets, the ongoing dialogue globally about crypto regulation can influence institutional adoption. Positive regulatory clarity can attract more institutional capital, potentially counteracting negative macro rotations. Conversely, uncertain or unfavorable regulatory environments can deter investment. The current market sentiment, influenced by broader economic rotations, might be overshadowing regulatory news, but any significant policy announcements could act as a catalyst for a decisive price move, either upwards or downwards.
The institutional adoption trend, marked by the increasing interest in Bitcoin ETFs, has been a major driver for the market. However, during periods of broader market rotation, even these institutional flows can slow down or reverse. If traditional financial institutions are pulling back from riskier assets, this sentiment can extend to their crypto investments. The price action around $63,185 is, therefore, not just a technical level but a barometer of how institutional capital is currently positioned across the financial spectrum. The strength of the dollar at 100.89, coupled with potential cooling in the equity markets, suggests a cautious stance from many large players, which naturally limits speculative capital available for assets like BTCUSD.
The Path Forward: What to Watch Next
Looking ahead, the BTCUSD price action around the $63,185 mark will be pivotal. The market is at a crossroads, with conflicting signals across different timeframes and external macro pressures influencing sentiment. Traders should be closely monitoring the DXY and S&P 500 movements for clues about overall risk appetite. On the BTCUSD chart itself, confirmation of a break above the immediate 1H resistance at $63,726.67, or a decisive fall below the 1H support at $62,892.33, will likely dictate the next short-term move. The 4H trend strength (ADX 37.8) and 1D bullish MACD remain supportive of a potential upside, but the bearish lean on the 1H and the broader market rotation introduce significant risk.
The current market environment demands patience and a focus on risk management. It's a period where waiting for clear signals and confirmation is more important than trying to anticipate the exact turning point. The underlying bullish structure on longer timeframes provides some optimism, but the immediate bearish pressures and the macro rotation cannot be ignored. The $63,185 level represents a delicate balance between these opposing forces, and its resolution will set the tone for the coming days and weeks.
Frequently Asked Questions: BTCUSD Analysis
What happens if BTCUSD breaks below the 1H support at $62,892.33 amidst market rotation?
A break below $62,892.33 on the 1-hour chart would likely confirm the short-term bearish sentiment, potentially leading to a retest of lower support levels like $60,367.67. This would invalidate the bullish outlook suggested by the 4H and 1D charts, indicating that the broader market rotation is indeed exerting significant downward pressure.
Should I buy BTCUSD at current levels around $63,185 given the conflicting technical signals?
Buying at $63,185 requires caution due to conflicting signals; the 1H chart shows bearish pressure while longer timeframes remain mixed to bullish. A confirmation of strength, such as a clear break above $63,726.67 with increased volume, would be a more prudent entry trigger, indicating that the bulls are regaining control against the current rotation.
Is the RSI at 46.92 on the 1H chart a sell signal for BTCUSD right now?
An RSI of 46.92 on the 1-hour chart is not an outright sell signal, as it sits in neutral territory, but its downward trend indicates bearish momentum is building in the short term. Combined with negative MACD momentum, it suggests caution, but a confirmed sell signal would typically require further price confirmation or a move into oversold territory below 30.
How will the DXY at 100.89 affect BTCUSD this week amidst the ongoing market rotation?
A DXY at 100.89 indicates a relatively strong dollar, which generally exerts downward pressure on risk assets like BTCUSD. If the dollar continues to strengthen due to risk-off sentiment or Fed policy expectations, it could exacerbate the downward rotation in Bitcoin, making it harder for it to break above key resistance levels.
Bearish Scenario: Rotation Deepens
65% ProbabilityNeutral Scenario: Consolidation Around $63,185
25% ProbabilityBullish Scenario: Rotation Reverses
10% ProbabilityTrack markets in real-time
AI-powered analysis, technical indicators and real-time price data.
Join Our Telegram Channel
Breaking market news, AI analysis and trading signals instantly.
Join Channel