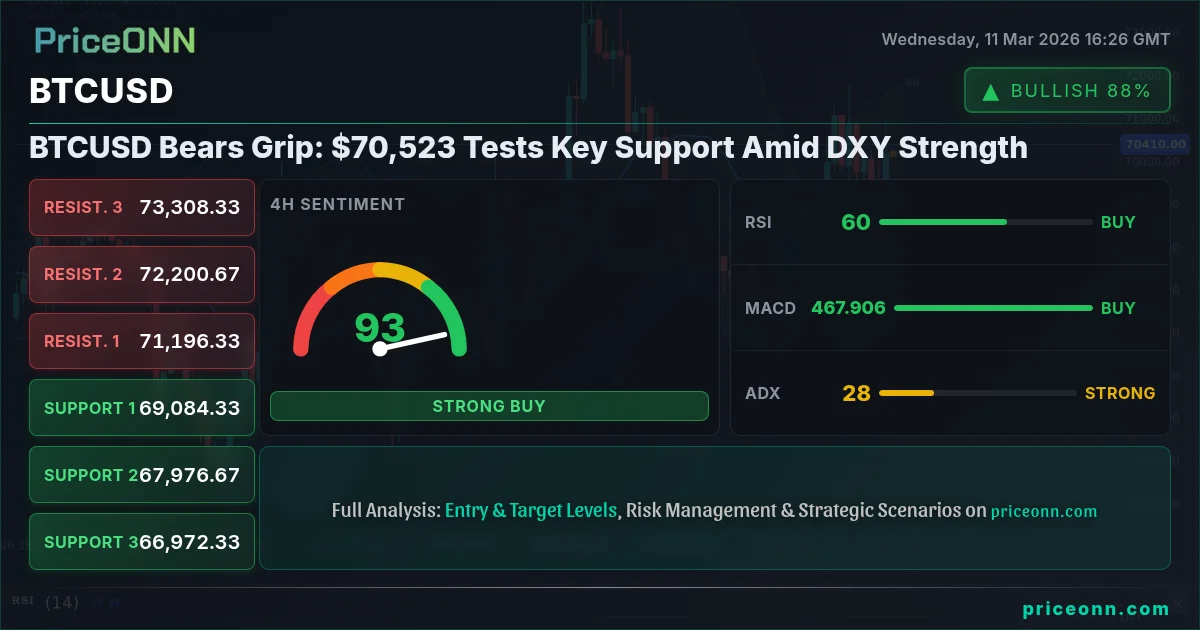
Bitcoin is under pressure today, testing the crucial $70,523 level as a strengthening dollar index (DXY) adds to bearish sentiment. Bulls and bears are locked in a fierce battle at this pivotal point, with the near-term direction of BTCUSD hanging in the balance. The question now is whether the bulls can defend this critical support, or if the bears will succeed in pushing the price lower.
- RSI at 57.5 on the 1-hour chart suggests neutral momentum, with potential for further downside.
- Critical support lies at $70,042.33; a break below could trigger a deeper correction.
- The MACD on the 4-hour chart remains positive, but a bearish crossover would signal weakness.
- DXY strength is weighing on BTCUSD; watch for a potential decoupling if risk appetite returns.
The Bull Case for BTCUSD
Despite the current selling pressure, there are several reasons to remain optimistic about Bitcoin's prospects. The fundamental backdrop remains supportive, with increasing institutional adoption and growing acceptance of Bitcoin as a store of value. From a technical perspective, while the 1-hour and 4-hour charts show some weakness, the daily chart suggests a potential bottom is forming. The RSI on the daily chart sits at 51.81, indicating neutral conditions with room for upside. Furthermore, the Stochastic oscillator on the daily timeframe is showing a bullish crossover (K=51.14, D=50.23), suggesting a potential trend reversal. Scalpers might look for quick long opportunities above minor support, while swing traders may wait for confirmation of a daily higher low before committing.
The positive MACD on the 1-day timeframe, though with negative momentum, suggests that the overall bullish trend may still be intact despite the current pullback. Long-term investors might view this dip as a buying opportunity, provided that key support levels hold. It is important to consider that Bitcoin has shown remarkable resilience in the past, bouncing back from significant corrections to reach new all-time highs. The overall market sentiment remains positive, with many analysts predicting further upside for Bitcoin in the long term. The upcoming halving event is also a potential catalyst for further price appreciation. The key for the bulls is to defend the $70,042.33 level to prevent a deeper correction. If this level holds, we could see a bounce back towards the $71,051.33 resistance level.
The Bear Case for BTCUSD
On the other hand, there are compelling reasons to believe that Bitcoin could face further downside in the near term. The strengthening dollar index (DXY), currently at 98.98, is putting significant pressure on BTCUSD. Historically, a strong dollar has often coincided with weaker Bitcoin prices, as Bitcoin is often seen as an alternative to the dollar. The stronger dollar makes Bitcoin relatively more expensive for investors holding other currencies. The overall risk-off sentiment in the market is also weighing on Bitcoin, with the SP500 down 0.48% today. Investors are becoming increasingly cautious due to concerns about inflation and potential interest rate hikes by the Federal Reserve.
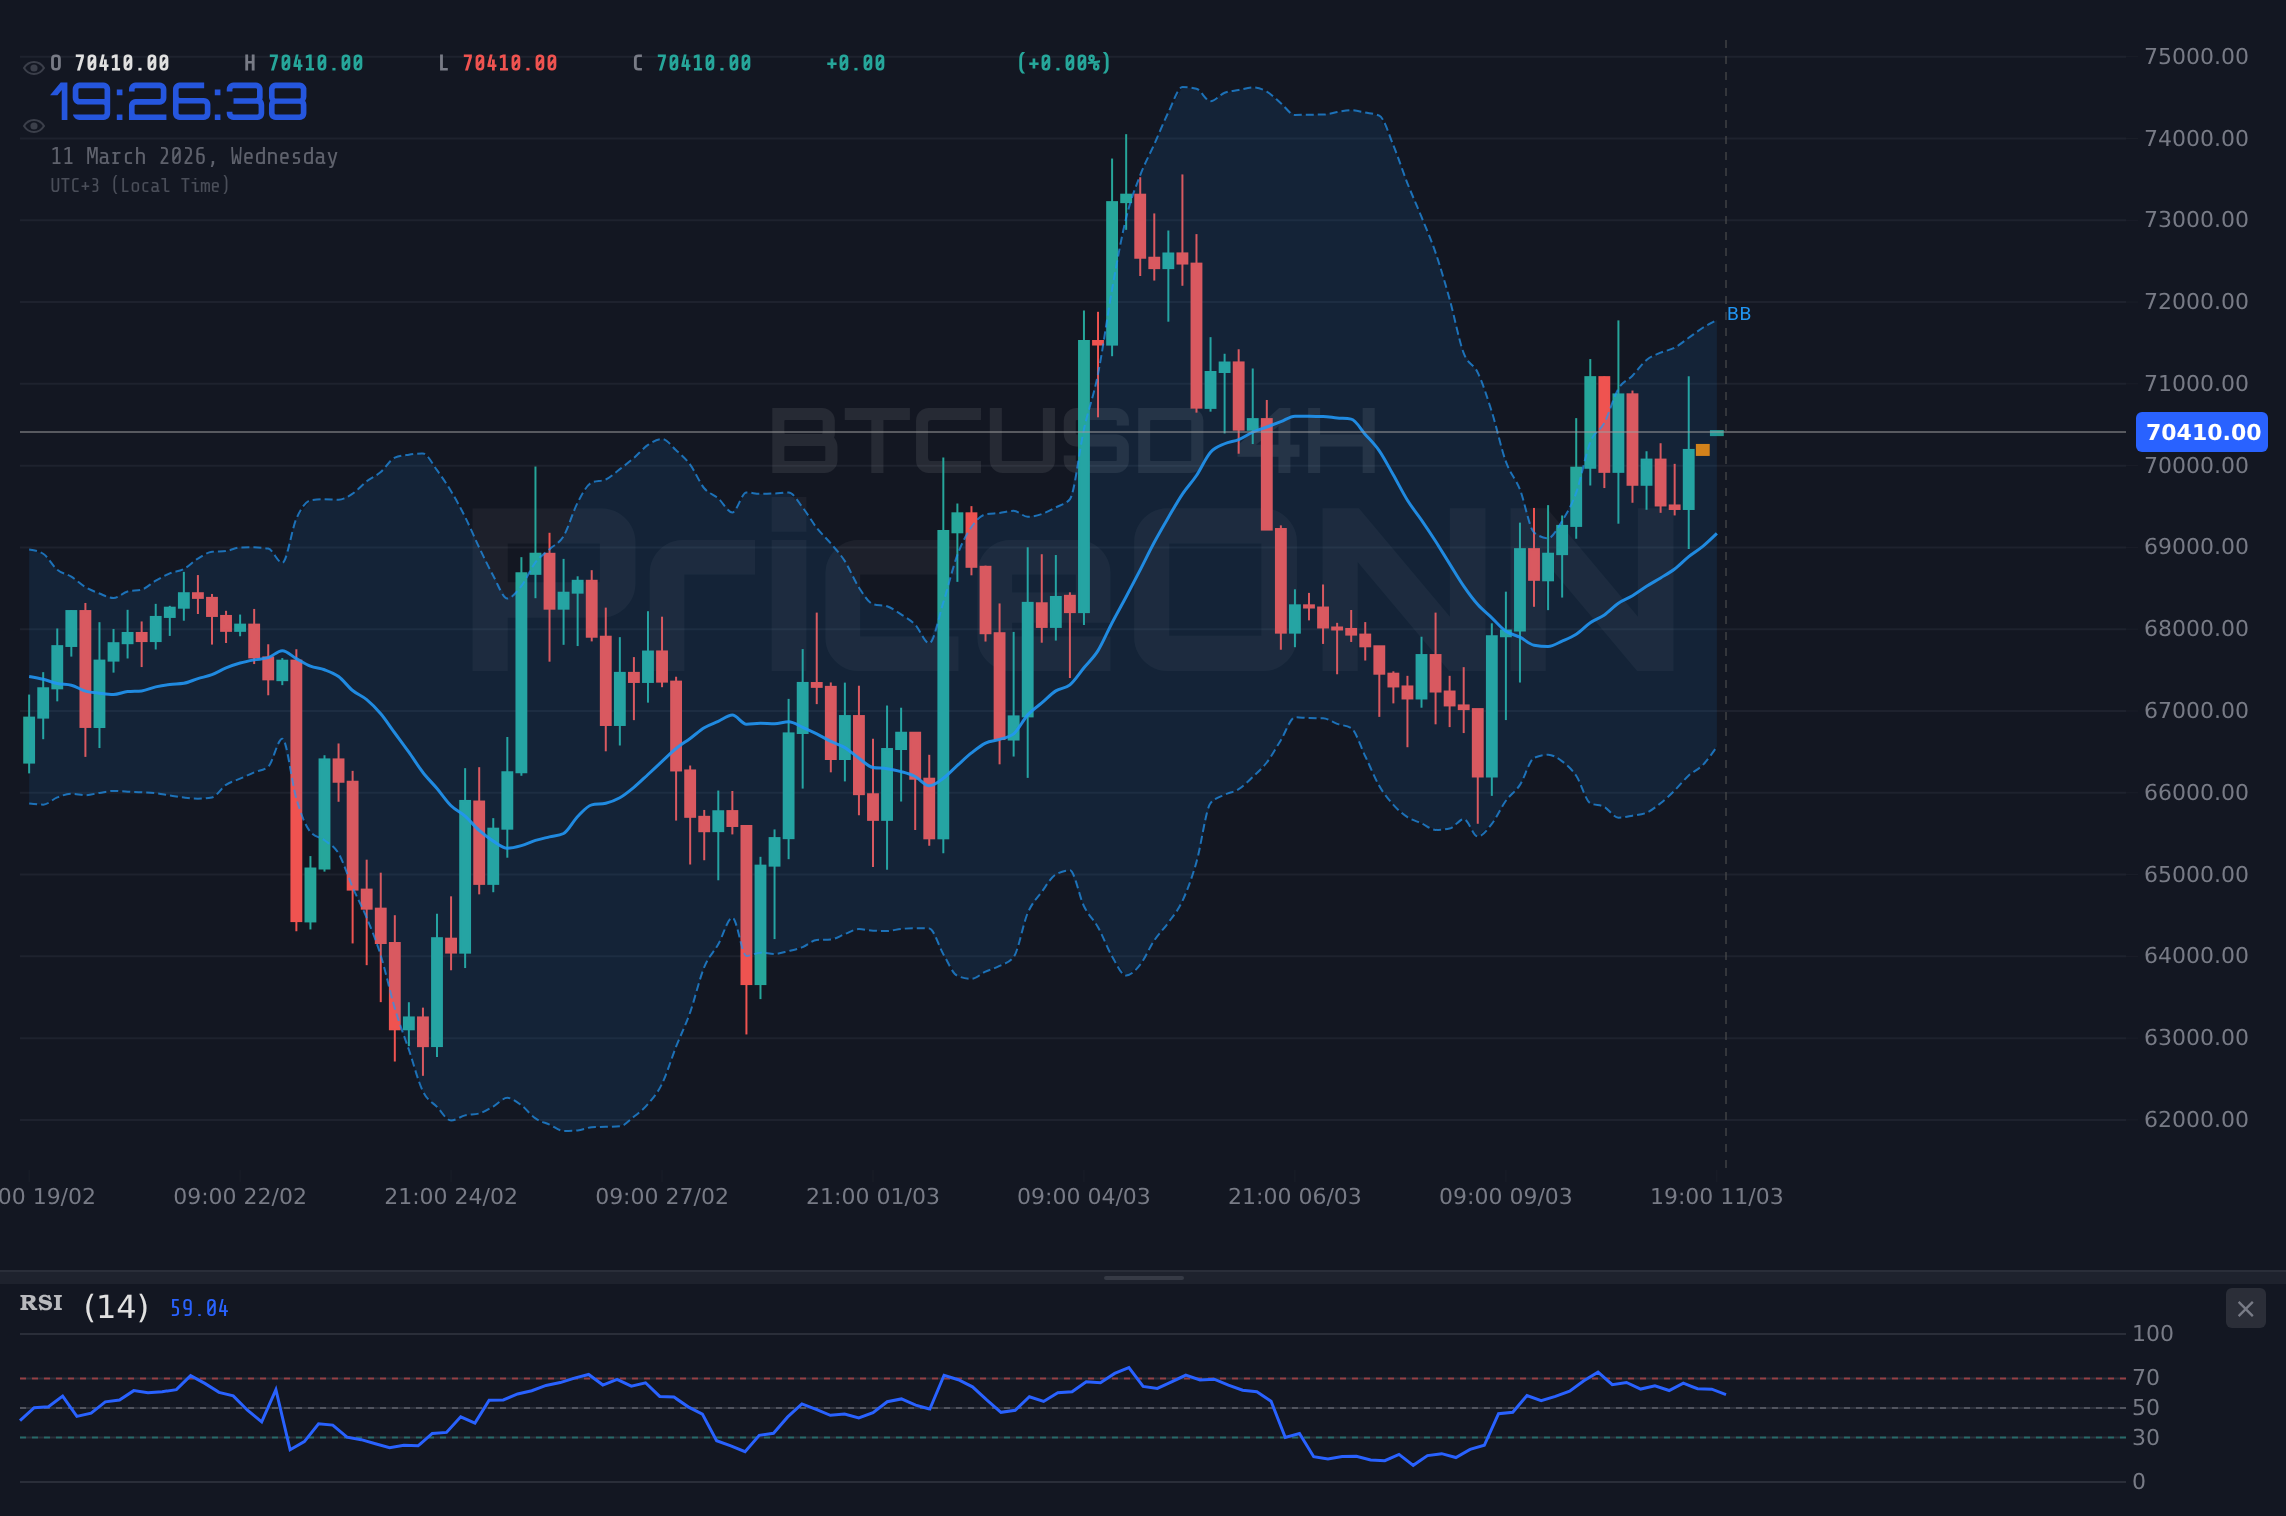
From a technical perspective, the 1-hour chart is showing significant weakness, with the price trading below the middle band of the Bollinger Bands. The RSI on the 1-hour chart is at 42.7, indicating neutral momentum with a bearish bias. Scalpers will likely be shorting rallies toward the 1 hour resistance at $71,051.33. Swing traders might look for shorting opportunities below the $70,042.33 support level, targeting lower levels. The ADX on the 1-hour chart is at a weak 16.05, which suggests consolidation is more likely than a breakdown. The critical level to watch is $70,042.33; a break below this level could trigger a sharp sell-off towards the next support level at $69,503.67. The recent news that EUR/USD is eyeing 1.1700 as USD/JPY consolidates below 159.00 suggests broader dollar strength, which could continue to weigh on BTCUSD.
Technicals as a Tiebreaker: Multi-Timeframe Analysis
To gain a clearer picture of the likely direction of BTCUSD, it is essential to consider multiple timeframes. As mentioned earlier, the 1-hour chart is showing bearish signals, while the daily chart suggests a potential bottom is forming. The 4-hour chart presents a mixed picture. The RSI on the 4-hour chart is at 58.05, indicating neutral momentum with a bullish bias, however, ADX on the 4-hour chart is at 26.51 indicating a strong uptrend. The MACD on the 4-hour chart remains positive, but a bearish crossover would signal weakness. The Stochastic oscillator on the 4-hour chart is showing a bearish crossover (K=41.08, D=57.56), suggesting a potential trend reversal. The key is to watch for confirmation of these signals across multiple timeframes. If the 1-hour chart continues to show weakness and the 4-hour MACD crosses bearishly, it would increase the likelihood of a deeper correction towards the $69,503.67 level. The overall signal is bullish but with caution.
The 1-day chart, however, is a different story. The 1-day chart displays a strong uptrend with an ADX of 28.25, and RSI of 51.81 indicating neutral conditions with room for upside. This means that the long-term trend of BTCUSD remains bullish, and that any short-term corrections should be viewed as buying opportunities. Long-term investors should focus on the 1-day chart for their investment decisions, rather than the 1-hour or 4-hour charts. It is also important to consider the impact of upcoming economic data releases on BTCUSD. The US PPI is coming out today and will have an impact on the price. If the PPI number is higher than expected, it could lead to further dollar strength and weigh on BTCUSD. Conversely, if the PPI number is lower than expected, it could weaken the dollar and support BTCUSD.
Correlation Analysis: DXY, SP500, and Oil
Understanding the correlations between BTCUSD and other asset classes is crucial for making informed trading decisions. As mentioned earlier, BTCUSD has a strong inverse correlation with the dollar index (DXY). A rising DXY typically puts pressure on BTCUSD, while a falling DXY tends to support BTCUSD. The DXY is currently at 98.98, up 0.45% on the day, which is contributing to the current selling pressure on BTCUSD. It's important to remember that these correlations can break down during periods of extreme market volatility or unexpected news events.
BTCUSD also tends to be correlated with risk appetite in the broader market. When the SP500 is rising, it typically indicates that investors are feeling optimistic and are more willing to take on risk, which can support BTCUSD. However, when the SP500 is falling, it suggests that investors are becoming more risk-averse, which can weigh on BTCUSD. The SP500 is currently down 0.48% on the day, which is also contributing to the current selling pressure on BTCUSD. Finally, oil prices can also have an impact on BTCUSD, as they are often seen as a barometer of global economic growth. Rising oil prices can lead to higher inflation expectations, which can weigh on risk assets like Bitcoin. WTI crude is currently trading at $87.97, up 1.94% on the day, which could add to the bearish sentiment surrounding BTCUSD.
The Verdict: Caution Warranted, But Long-Term Bullish Trend Remains
Given the conflicting signals from multiple timeframes and the influence of external factors like the DXY and SP500, caution is warranted in the near term. The immediate pressure point for Bitcoin is at $70,523. A decisive break below $70,042.33 would open the door for a test of $69,503.67, while a sustained move above $71,051.33 could pave the way for a retest of recent highs. The current technical picture is mixed, but the long-term bullish trend remains intact. Patient investors should wait for confirmation of a bottom before adding to their positions. It is also important to manage risk carefully, using stop-loss orders to protect against potential downside. The key to success in this market is to remain flexible and adapt to changing conditions. The recent news that gold trades cautiously near $5,190 as US inflation data looms indicates that investors are seeking safe havens, which could benefit Bitcoin in the long run.
Frequently Asked Questions: BTCUSD Analysis
What happens if BTCUSD breaks below $70,042.33 support?
A break below $70,042.33 support would likely trigger a further sell-off, potentially leading to a test of the next support level at $69,503.67. This scenario would be confirmed by a bearish crossover on the 4-hour MACD.
Should I buy BTCUSD at current levels of $70,523 given the DXY strength?
Given the current DXY strength, caution is warranted. While long-term investors might consider accumulating at these levels, short-term traders should wait for a pullback or a break above $71,051.33 resistance before entering long positions.
Is RSI at 57.5 on the 1-hour chart a sell signal for BTCUSD?
An RSI of 57.5 on the 1-hour chart is not necessarily a sell signal, but it suggests that bullish momentum is waning. Traders should watch for confirmation of a bearish trend reversal before considering short positions.
How will the US PPI data affect BTCUSD this week?
If the US PPI data is higher than expected, it could lead to further dollar strength and weigh on BTCUSD. Conversely, if the PPI data is lower than expected, it could weaken the dollar and support BTCUSD. The market will be closely watching this data release for clues about the future direction of monetary policy.
Technical Outlook Summary
| Indicator | Value | Signal |
|---|---|---|
| RSI (14) | 57.5 | Neutral |
| MACD Histogram | Positive | Bullish |
| Stochastic | 68.7 | Bullish |
| ADX | 16.05 | Weak |
| Bollinger | Middle Band | Watch |
Key Levels
Support Levels
Resistance Levels
Track markets in real-time
AI-powered analysis, technical indicators and real-time price data.
Join Our Telegram Channel
Breaking market news, AI analysis and trading signals instantly.
Join Channel