BRENT Surges to $90.61: Is the Overbought RSI a Warning Sign?
BRENT crude hits $90.61, but the RSI at 82.2 flashes an overbought signal. Is a correction imminent, or will bullish momentum prevail?
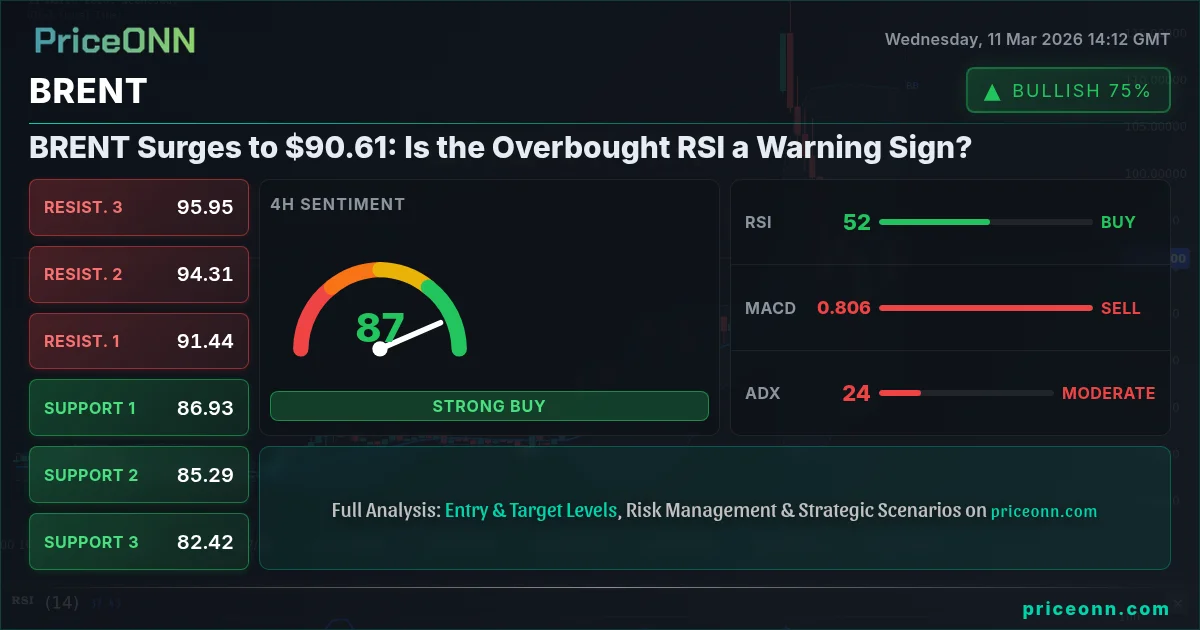
BRENT crude is currently trading at $90.61, a level that has attracted both bullish enthusiasm and bearish skepticism. The fundamental backdrop remains supportive, with geopolitical tensions and supply concerns lingering, yet the technical picture is becoming increasingly complex. The 1D RSI, with a reading of 82.2, is flashing a clear overbought signal, but the underlying trend remains undeniably upward. This sets the stage for a classic bull versus bear debate, with the outcome likely to determine BRENT's trajectory in the coming weeks.
- BRENT's RSI at 82.2 signals overbought conditions, potentially indicating a pullback.
- Key support lies at $83.41, a level that must hold to maintain the bullish structure.
- The MACD remains positive, but the histogram is starting to flatten, suggesting waning bullish momentum.
- Geopolitical risks in the Middle East are a key driver of BRENT's correlation with DXY.
The Bull Case for BRENT
The bullish argument for BRENT centers around several key factors. First and foremost, geopolitical risks remain elevated, particularly in the Middle East. The news that the Strait of Hormuz faces a potential mining threat, as reported earlier today, immediately injected a risk premium into oil prices. Any disruption to supply through this critical chokepoint would have significant consequences for global oil markets, bolstering the bull case. Furthermore, OPEC+ production cuts continue to provide a floor under prices. While some analysts have questioned the group's ability to maintain discipline, the market consensus remains that OPEC+ will act to prevent a significant price decline. The 1D MACD remains positive, supporting the bullish bias. The Stochastic oscillator shows a K value of 85.9 and a D value of 86.27, which, while both are in overbought territory, the K value is slightly below the D value, indicating some potential for continued upward momentum in the very short term.
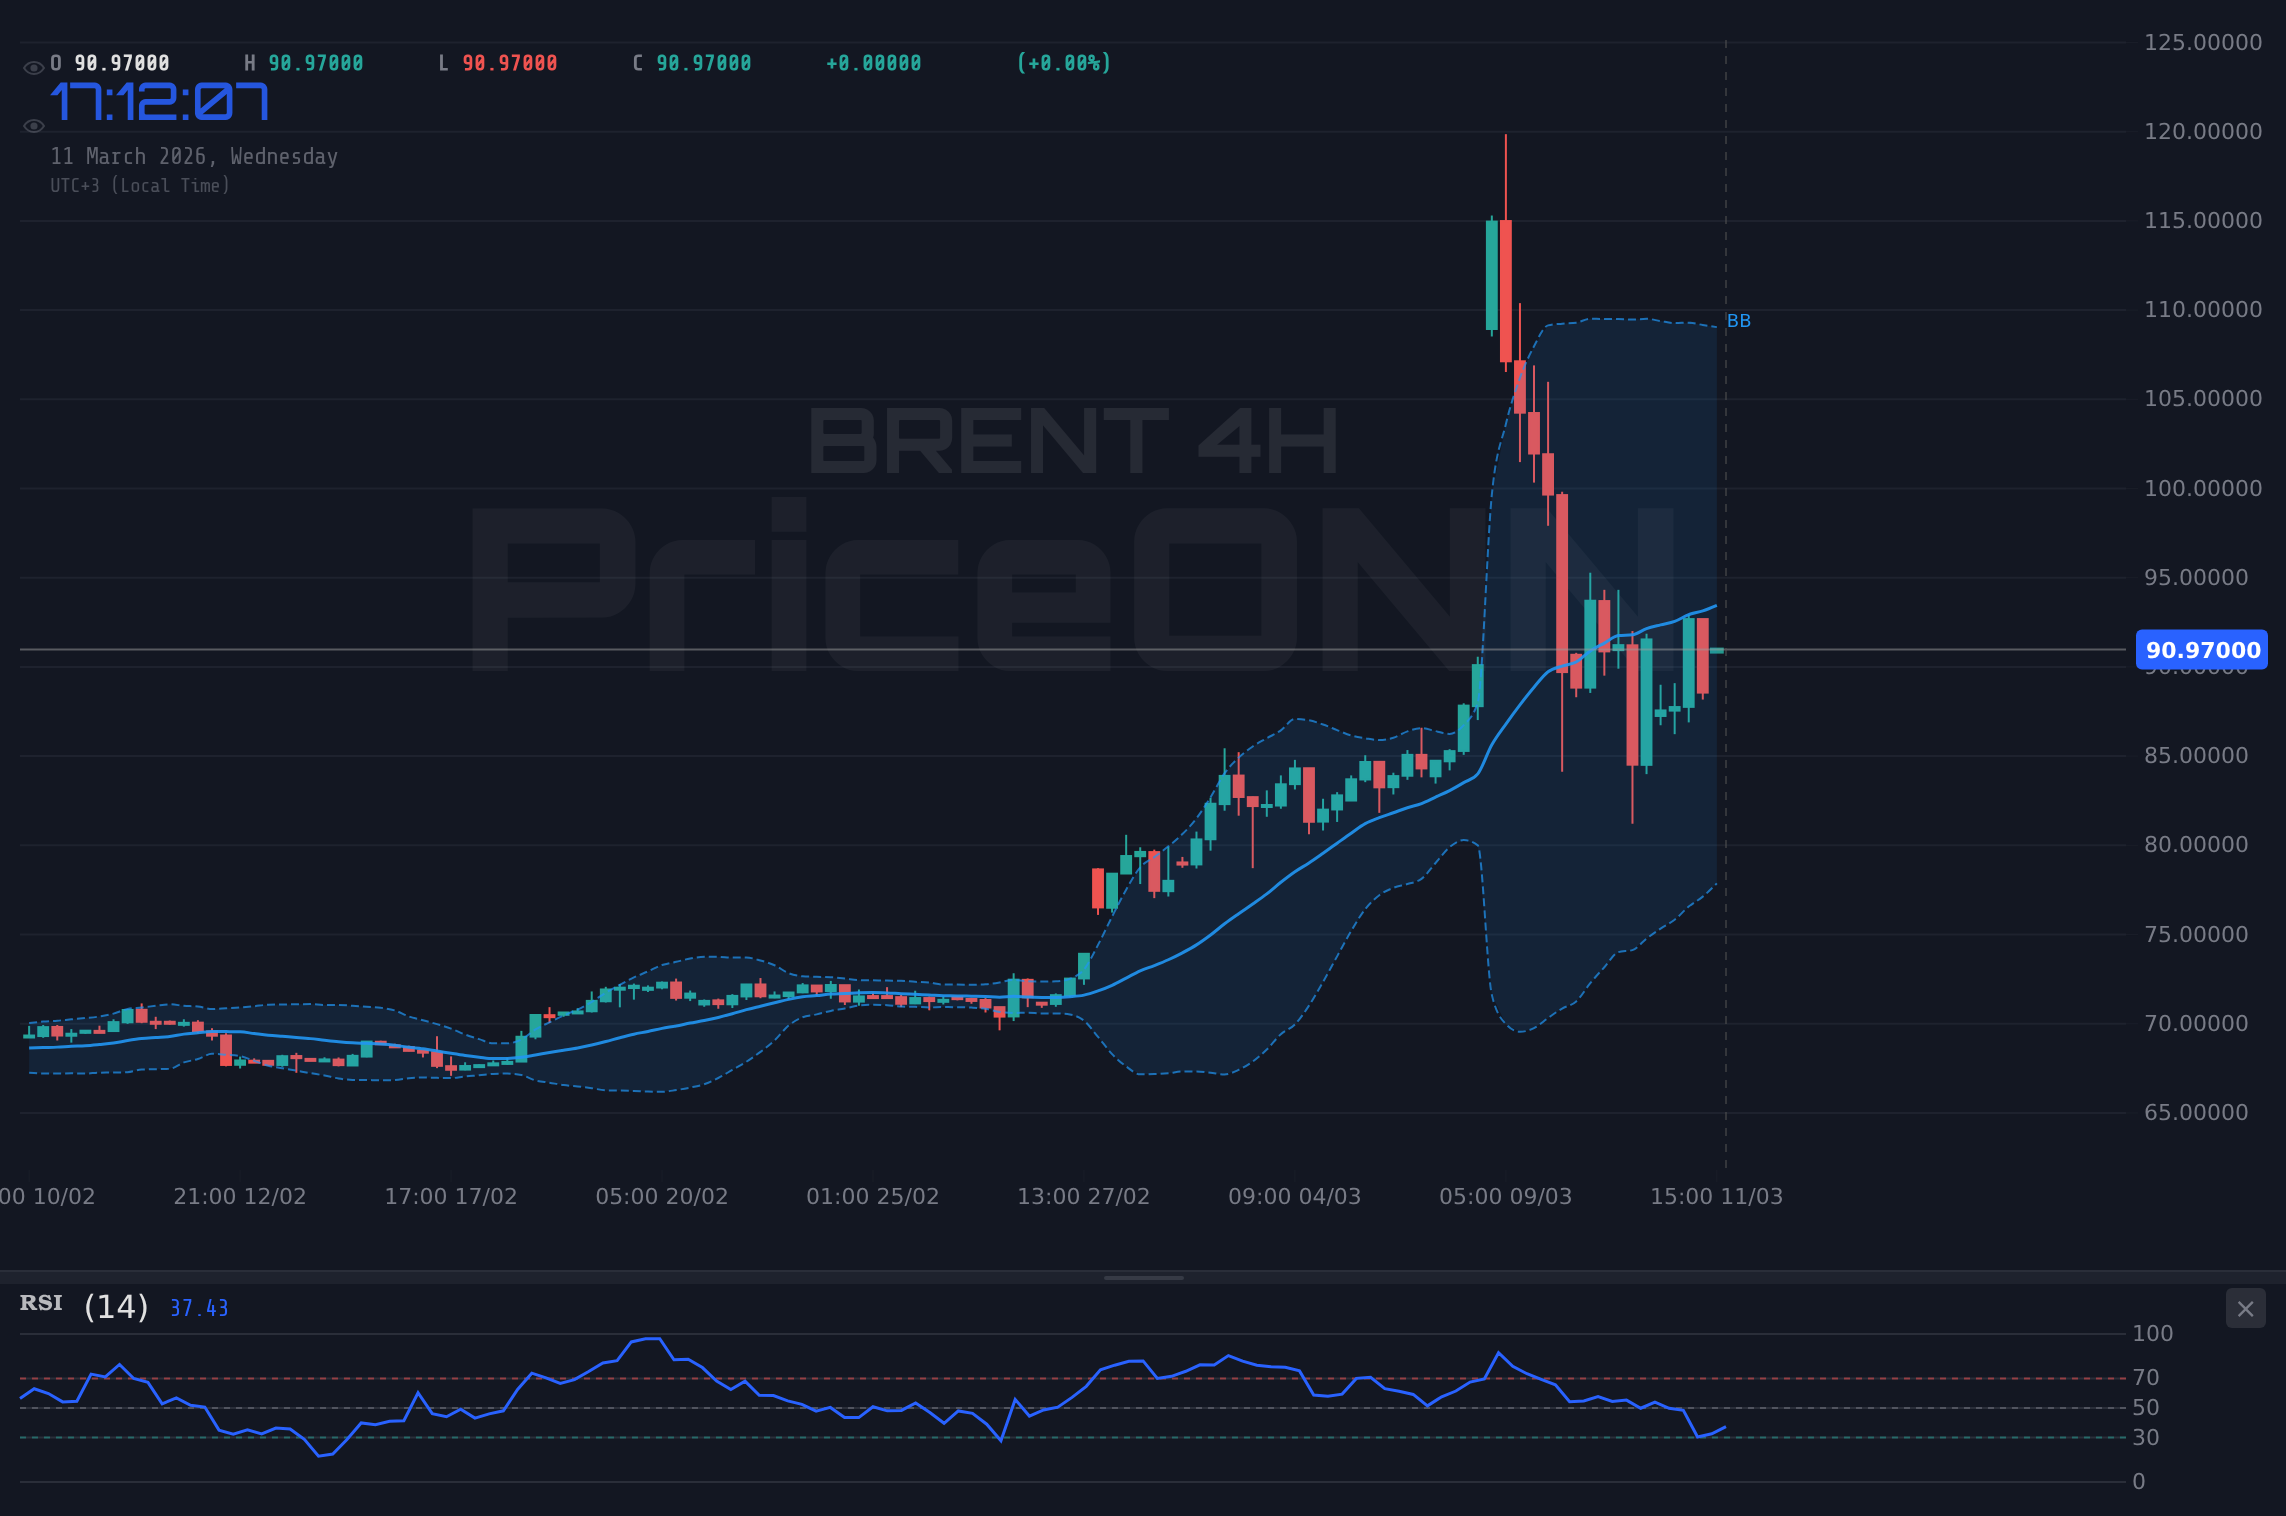
The daily chart shows a strong uptrend, confirmed by the ADX reading of 46.54, indicating a powerful trend. The price has been consistently making higher highs and higher lows. Swing traders will be closely watching the $92.85 resistance level, a break above which could trigger another leg higher. Long-term investors will likely see any pullback as a buying opportunity, given the favorable fundamental backdrop. Scalpers, on the other hand, may look to fade the overbought RSI, targeting a quick profit from a short-term correction. The USD/CAD pair faces pressure near 1.3500 as oil price drop offsets dollar weakness, this news adds to the possibility of a breakout, as a weaker USD will lead to a potential rise in the price of oil.
The Bear Case for BRENT
Despite the bullish tailwinds, the bear case for BRENT is equally compelling. The most immediate concern is the overbought RSI, currently at 82.2 on the daily chart. Historically, such high RSI readings have often preceded a correction. The bears argue that the market has become too complacent, ignoring potential downside risks such as a slowdown in global economic growth or a resolution to geopolitical tensions. The IEA's proposal for a record release of oil reserves, exceeding the 2022 release, also weighs on sentiment. The 1H RSI is at 50.12, indicating the potential for a small bounce, but the 4H RSI is at 51.02, which is still very neutral.
Technically, the inability of BRENT to sustain a break above the $92.92 daily high is also a cause for concern. The bears point to the potential for a double top formation, which could trigger a sharp selloff. The nearest support is at $83.41, which will be a critical level to watch. A break below this level would confirm the bearish thesis and open the door for a move towards the $75.27 level. The daily Stochastic oscillator shows a K value of 85.9 and a D value of 86.27, which is in overbought territory, further supporting the bearish argument. Scalpers may look to short BRENT at the $90.61 level, targeting a quick profit from a short-term correction. Swing traders will be closely watching the $83.41 support level, a break below which could trigger another leg lower. Long-term investors will likely see this as a sign that the market is overheated, and a correction is imminent.
Technical Analysis as Tiebreaker
The technical picture presents a mixed bag, with both bullish and bearish signals vying for dominance. The 1H chart shows a neutral trend, but the 4H chart shows a strong uptrend. The daily chart also shows a strong uptrend, but the RSI is flashing an overbought signal. The MACD histogram is positive on the 1H and 4H charts, but is starting to flatten on the daily chart, suggesting waning bullish momentum. The ADX is strong on the daily chart, confirming the bullish trend, but is weak on the 1H and 4H charts, indicating a potential slowdown in momentum. The Bollinger Bands are wide on all three timeframes, indicating high volatility. The price is currently trading above the middle band on the 1H, 4H, and daily charts, which is a bullish sign.
Looking at the support and resistance levels, the nearest support is at $90.60 on the 1H chart, $88.74 on the 4H chart, and $83.41 on the daily chart. The nearest resistance is at $92.30 on the 1H chart, $94.77 on the 4H chart, and $97.48 on the daily chart. The USD/JPY Eyes 159.00 as BoJ Uncertainty Fuels Yen Weakness, the news adds to the possibility of a breakout, as a weaker Yen will lead to a potential rise in the price of oil. BRENT is influenced by the DXY, the dollar index, and the SP500. The DXY is currently showing a strong uptrend, which could put pressure on BRENT. The SP500 is also showing an uptrend, which could support BRENT. The correlation between BRENT and the SP500 is strong, but the correlation between BRENT and the DXY is weak. It is also important to consider the USD/CAD, as the pair faces pressure near 1.3500 as oil price drop offsets dollar weakness.
The Verdict
Given the conflicting signals, the most prudent approach is to remain neutral in the short term. The overbought RSI warrants caution, but the underlying trend remains bullish. A break below $83.41 would be a clear sign that the bears are in control, while a sustained break above $92.92 would signal a continuation of the uptrend. Traders should closely monitor the upcoming economic data releases, particularly the US CPI data, which could significantly impact market sentiment. Until there is more clarity, patience and disciplined risk management are paramount.
Scalpers should be cautious of the overbought conditions and look for short-term opportunities to fade the rally. Swing traders should wait for a clear break of either support or resistance before committing to a position. Long-term investors should remain bullish, but consider hedging their positions to protect against a potential correction. The key is to remain flexible and adapt to the evolving market dynamics. The report that Oil Prices Brace for Impact as Strait of Hormuz Faces Mining Threat injects additional volatility, which could lead to a sharp correction or a continuation of the uptrend.
Frequently Asked Questions: BRENT Analysis
What happens if BRENT breaks above $97.48 resistance?
If BRENT decisively breaks above the $97.48 resistance level, it would signal a continuation of the uptrend and open the door for a move towards the $103.41 level. This scenario would likely be driven by a combination of factors, including geopolitical tensions, strong demand, and continued OPEC+ production cuts.
Should I buy BRENT at current levels of $90.61 given RSI at 82.2?
Given the overbought RSI of 82.2, buying BRENT at current levels of $90.61 is a risky proposition. A more prudent approach would be to wait for a pullback towards the $83.41 support level before considering a long position. It is also important to monitor the upcoming economic data releases for any signs of a slowdown in global economic growth.
Is RSI at 82.2 a sell signal for BRENT right now?
An RSI of 82.2 is a strong indication of overbought conditions and warrants caution, but it is not necessarily a sell signal on its own. Traders should look for other confirming signals, such as a break below support or a negative divergence on the MACD histogram, before initiating a short position. The overbought RSI warrants caution.
How will the US CPI data affect BRENT this week?
The US CPI data is a key economic indicator that could significantly impact BRENT prices. A higher-than-expected CPI reading would likely lead to a stronger dollar, putting downward pressure on BRENT. Conversely, a lower-than-expected CPI reading would likely weaken the dollar, supporting BRENT.
Track markets in real-time
AI-powered analysis, technical indicators and real-time price data.
Join Our Telegram Channel
Breaking market news, AI analysis and trading signals instantly.
Join Channel