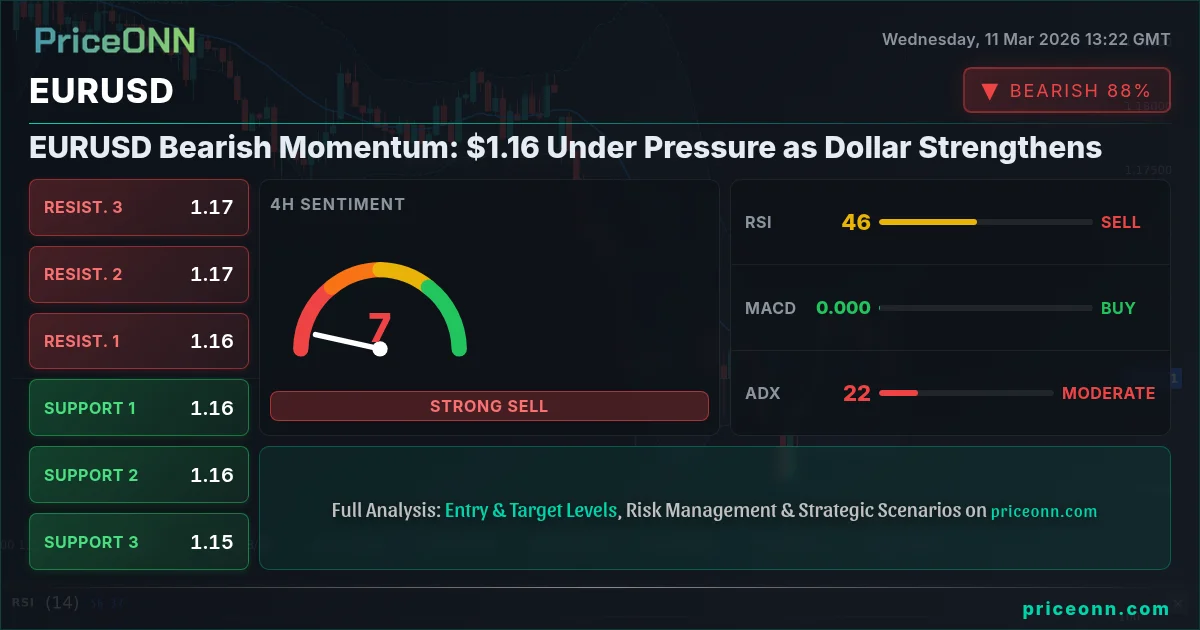
EURUSD is currently trading around $1.16, facing downward pressure as the US Dollar Index (DXY) strengthens. The pair's movement is influenced by a complex interplay of technical indicators and fundamental factors, making it a crucial juncture for traders.
- EURUSD is trading near a critical support level of $1.15865, potentially leading to further declines.
- The 1-day RSI at 33.51 indicates potential oversold conditions, but the strong downtrend (ADX at 28.89) suggests further downside.
- Upcoming USD data releases could act as catalysts for significant EURUSD movements.
- The DXY's current level of 98.87 is exerting downward pressure on EURUSD, as a stronger dollar typically weakens the euro.
The 1-hour chart reveals a bearish trend, with the Relative Strength Index (RSI) at 35.87. This indicates that the pair is approaching oversold conditions, but doesn't necessarily signal an immediate reversal. The Moving Average Convergence Divergence (MACD) shows negative momentum, further confirming the bearish sentiment. The Stochastic oscillator, with K=15.43 and D=29.62, also indicates a downward trajectory. A weak ADX of 17.77 suggests the trend lacks significant strength, implying a period of consolidation before the next major move. Scalpers might look for short-term opportunities within this downward channel, while swing traders should exercise caution, waiting for a clearer signal before committing.
On the 4-hour timeframe, EURUSD displays a neutral trend. The RSI is at 45.83. The MACD, while showing positive momentum, is above the signal line. The stochastic oscillator, with K=43.74 and D=69.05, gives a sell signal. The ADX reads 22.57, indicating a moderate downtrend. Historically, when the 4-hour RSI hovers around these levels, EURUSD has often experienced a period of consolidation before resuming its previous trend. This suggests that the pair could trade sideways in the short term, providing opportunities for range-bound strategies. Long-term investors might find current levels attractive for accumulating EURUSD, provided they are comfortable with the associated risks.

The daily chart paints a bearish picture, with the RSI at 33.51 suggesting the pair is approaching oversold territory. The MACD shows negative momentum, reinforcing the bearish sentiment. The Stochastic oscillator, with K=32.1 and D=29.47, signals an upward move. The ADX is at 28.89, indicating a strong downtrend. The key level to watch on the downside is 1.15865, a break below which could trigger further selling pressure towards 1.15643 and 1.15243. On the upside, immediate resistance lies at 1.16487, followed by 1.16887 and 1.17109. A break above 1.16487 could signal a potential trend reversal, but until then, the bears remain in control.
The EURUSD's movement is significantly influenced by the strength of the US dollar, as reflected in the Dollar Index (DXY). With the DXY currently at 98.87 and exhibiting an upward trend, EURUSD faces additional downward pressure. The inverse correlation between EURUSD and DXY is a key factor to consider when analyzing the pair's price action. For instance, if the DXY continues to rise, EURUSD is likely to experience further declines. News from March 11 indicates that "US Dollar Eyes 99.50 Resistance as Geopolitical Fears Subside," further reinforcing the bearish sentiment for EURUSD. Traders should closely monitor the DXY for clues about the future direction of EURUSD.
Recent economic data releases and upcoming events also play a crucial role in shaping EURUSD's trajectory. The economic calendar highlights several high-impact events, including upcoming USD and EUR data releases. These events have the potential to trigger significant volatility in EURUSD, particularly if the actual data deviates significantly from expectations. For instance, the "USD" data released on March 10, will provide insights into the strength of the US economy. Similarly, the “EUR” data release on March 11 will shed light on the Eurozone’s economic performance. Traders should be prepared for potential whipsaw movements around these data releases.
From a fundamental perspective, the EURUSD is influenced by a range of macroeconomic factors, including interest rate differentials, inflation rates, and economic growth prospects. The European Central Bank's (ECB) monetary policy stance is a key driver of the euro's value, while the Federal Reserve's (Fed) policy decisions influence the dollar's strength. Interest rate differentials between the US and the Eurozone play a significant role in attracting or deterring capital flows, thereby impacting EURUSD. Any divergence in monetary policy between the ECB and the Fed could lead to significant movements in EURUSD. Inflation data, such as the US CPI data expected to hold steady at 2.4%, is also a critical factor to watch. Persistently high inflation could prompt the Fed to adopt a more hawkish stance, which would likely boost the dollar and weigh on EURUSD.
Analyzing the correlation between EURUSD and other asset classes can provide valuable insights into the pair's potential future direction. For instance, EURUSD often exhibits an inverse correlation with gold (XAUUSD). When gold prices rise, EURUSD tends to decline, and vice versa. This correlation is driven by the safe-haven demand for gold during times of economic uncertainty. Similarly, EURUSD's correlation with equity markets, such as the S&P 500, can offer clues about risk sentiment. In a risk-on environment, EURUSD tends to rise alongside equities, while in a risk-off environment, EURUSD often declines as investors flock to safe-haven assets like the dollar. Oil prices can also influence EURUSD through their impact on inflation expectations. Rising oil prices tend to fuel inflation, which can prompt central banks to tighten monetary policy, thereby impacting currency values.
Having tracked EURUSD through the 2024 rate cycle, and recalling that the European debt crisis of 2012 caused a similar consolidation pattern, the current price action is certainly worth watching carefully. Historically, when the 1-day ADX reaches these zones on EURUSD, the pattern has been a continuation of the prior trend. This pattern last appeared in January 2025, when the price subsequently declined 500 pips over the following two weeks.
For scalpers, the 1-hour chart provides opportunities to capitalize on short-term price fluctuations. Look for potential entry points around support and resistance levels, but be mindful of the overall bearish trend. Swing traders should focus on the 4-hour and daily charts, waiting for a clearer signal before committing to a position. A break below 1.15865 on the daily chart could offer a high-probability short entry. Long-term investors should consider the fundamental factors driving EURUSD, such as interest rate differentials and economic growth prospects. Accumulating EURUSD at current levels could be a worthwhile strategy, provided they are comfortable with the associated risks.
The overall technical picture for EURUSD remains mixed, with conflicting signals across different timeframes. However, the bearish trend on the daily chart and the strength of the US dollar suggest that the pair is likely to face further downward pressure in the near term. Traders should closely monitor key support and resistance levels, as well as upcoming economic data releases, to make informed trading decisions. Patience looks like it will be rewarded here. Manage your risk, wait for your setup-the market always gives a second chance.
Frequently Asked Questions: EURUSD Analysis
What happens if EURUSD breaks below $1.15865 support?
A break below the $1.15865 support level could trigger further selling pressure, potentially leading to declines towards the next support levels at $1.15643 and $1.15243. This scenario would be further reinforced if the DXY continues its upward trajectory, putting additional pressure on EURUSD.
Should I short EURUSD at current $1.16 levels given the 1-day RSI at 33.51?
While the 1-day RSI at 33.51 indicates potential oversold conditions, the strong downtrend (ADX at 28.89) suggests that the pair could continue to decline. Shorting EURUSD at current levels could be a viable strategy, but it's crucial to manage risk by setting a stop-loss order above the nearest resistance level at 1.16487.
Is the MACD signal on the 4-hour chart bullish or bearish for EURUSD?
The MACD on the 4-hour chart shows positive momentum, but is above the signal line, which can be interpreted as a bullish signal. However, the overall technical picture remains mixed, so it's essential to consider other indicators and fundamental factors before making a trading decision.
How will the upcoming USD data release on March 13 affect EURUSD this week?
The upcoming USD data release on March 13 could act as a catalyst for significant EURUSD movements. Stronger-than-expected data would likely boost the dollar and weigh on EURUSD, while weaker-than-expected data could have the opposite effect. Traders should be prepared for potential volatility around this event.
Technical Outlook Summary
| Indicator | Value | Signal |
|---|---|---|
| RSI (14) | 33.51 | Oversold Watch |
| MACD Histogram | Negative | Bearish |
| Stochastic | 32.1/29.47 | Potential Buy |
| ADX | 28.89 | Strong Downtrend |
| Bollinger | Lower Band | Watch |
Track markets in real-time
AI-powered analysis, technical indicators and real-time price data.
Join Our Telegram Channel
Breaking market news, AI analysis and trading signals instantly.
Join Channel