WTI Bull Run: $82.99 Holds Despite Iran Fears
WTI crude oil maintains its bullish momentum, holding steady at $82.99 despite escalating tensions in the Middle East. Will this resilience continue amid supply concerns?
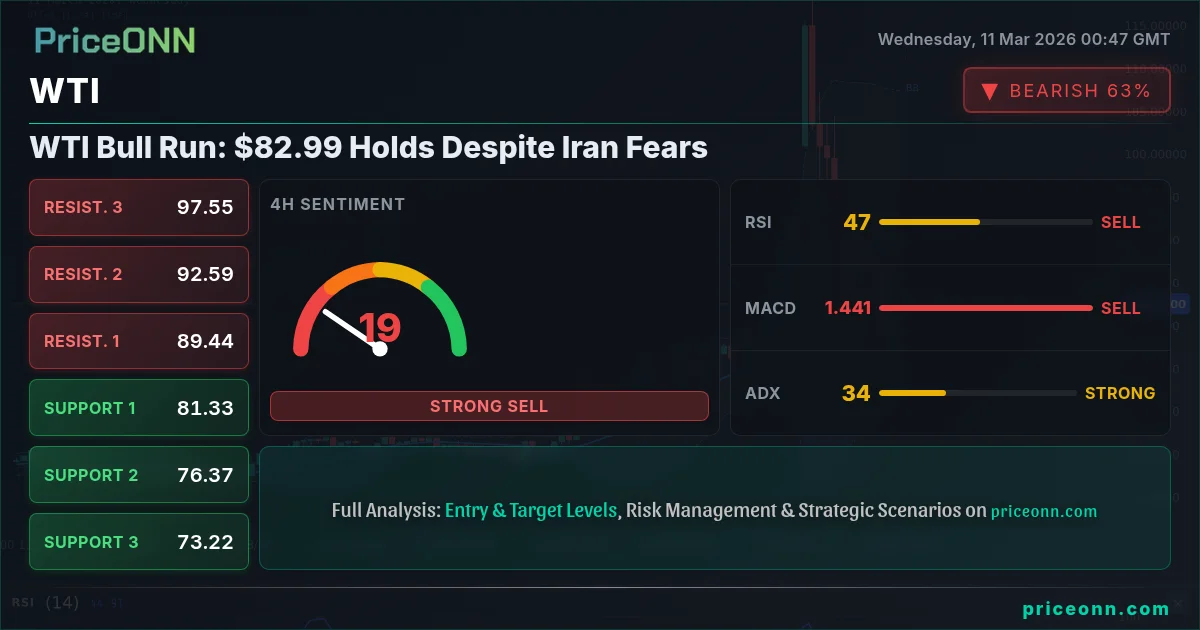
WTI crude oil is currently trading at $82.99, defying expectations of a deeper correction following recent volatility sparked by geopolitical tensions. The market's ability to hold above this key level suggests underlying strength, but the path ahead remains uncertain.
- WTI holds above $82.99 despite Iran's threat to halt Middle East oil exports.
- RSI on the 1-hour chart at 71.16 indicates potential overbought conditions.
- Strong support identified at $63.61 on the 1-day timeframe.
- Upcoming GDP data is crucial for confirming sustained economic recovery, impacting oil demand.
Geopolitical Tensions and Market Resilience
The recent spike in oil prices, briefly pushing Brent crude to nearly $120 a barrel, was driven by fears of supply disruptions stemming from escalating tensions involving Iran. According to recent news reports, Iran threatened to halt all Middle East oil exports if attacked by the U.S. and Israel, creating immediate supply concerns. However, WTI's ability to maintain its position around $82.99 despite these threats suggests that the market may be pricing in a limited impact from these geopolitical risks. This resilience could also reflect confidence in alternative supply sources or strategic reserves to offset any potential shortfalls.
Despite the initial surge, the news-driven rally has since cooled off, with prices retracing from their intraday highs. This pullback highlights the complex interplay between geopolitical factors and underlying market fundamentals. Traders are now closely monitoring developments in the Middle East to gauge the potential for further disruptions and their impact on global oil supplies.

Technical Analysis: Key Levels and Indicators
A technical overview of WTI reveals a mixed picture, with indicators providing conflicting signals across different timeframes. On the 1-hour chart, the RSI at 71.16 suggests that the market may be entering overbought territory, potentially signaling a near-term pullback. However, the MACD remains positive, indicating continued bullish momentum. The Stochastic oscillator, with K=90.49 and D=81.87, also points to overbought conditions, reinforcing the possibility of a short-term correction.
Looking at the 4-hour timeframe, the RSI stands at 62.33, still within neutral territory but trending upward. The MACD continues to show positive momentum, while the Stochastic oscillator is signaling an upward trend, with K=68.29 and D=44.75. This suggests that the underlying bullish trend remains intact, despite the potential for short-term pullbacks. Key support levels to watch are $65.20, $65.10, and $64.99 on the 1-hour chart, and $64.50, $64.20, and $63.99 on the 4-hour chart.
On the daily chart, the RSI is at 59.99, indicating a neutral stance with a slight upward bias. The MACD remains positive, and the ADX at 28.64 points to a strong uptrend, suggesting that the overall bullish trend is still in place. Key resistance levels to watch include $65.42, $66.36, and $67.23, while support is found at $63.61, $62.74, and $61.80.
Fundamental Drivers: Economic Data and Demand Outlook
In addition to geopolitical factors, fundamental drivers are also playing a crucial role in shaping WTI's price action. The global economic outlook, particularly GDP growth in major economies like the United States and China, is a key determinant of oil demand. Strong economic growth typically translates into higher demand for oil, supporting prices. Conversely, a slowdown in economic activity can lead to lower demand and downward pressure on prices.
Upcoming economic data releases, such as GDP figures, CPI reports, and employment numbers, will be closely watched by traders for clues about the strength of the global economy and its impact on oil demand. For instance, the upcoming GDP data will be critical for confirming sustained economic recovery, impacting oil demand. If the data is positive, it could reinforce the bullish sentiment in the market and push WTI prices higher. However, weaker-than-expected data could trigger a correction.
The strength of the dollar, as measured by the Dollar Index (DXY), also influences WTI prices. A rising DXY, currently at 98.6, typically puts downward pressure on oil prices, as it makes oil more expensive for buyers using other currencies. Conversely, a weaker dollar can support oil prices. Traders should monitor DXY movements closely to assess their potential impact on WTI.
Supply Dynamics: OPEC+ and Production Levels
The supply side of the equation is equally important. OPEC+ production decisions, particularly those related to output quotas, can have a significant impact on global oil supplies and prices. Any decisions by OPEC+ to increase or decrease production could trigger sharp price movements in WTI. Traders should closely follow OPEC+ meetings and announcements for clues about future supply trends.
Production levels in the United States, particularly shale oil production, also play a crucial role. An increase in U.S. oil production can offset some of the impact of OPEC+ supply cuts, limiting the upside potential for prices. Conversely, a decline in U.S. production can exacerbate supply concerns and push prices higher. The WTI price direction is currently bullish, influenced by positive momentum and strong demand indicators. The current price is hovering around $82.99, with the potential to test higher resistance levels if the positive sentiment persists. However, traders should remain cautious, considering the overbought conditions and the potential for a pullback.
Market Sentiment and Risk Management
Market sentiment is another crucial factor to consider. Positive sentiment, often driven by bullish news headlines or optimistic economic forecasts, can fuel rallies in WTI prices. Conversely, negative sentiment, triggered by concerns about economic slowdown or geopolitical risks, can lead to sharp selloffs. Traders should gauge market sentiment by monitoring news headlines, social media, and analyst reports.
Risk management is paramount in the volatile oil market. Traders should always use stop-loss orders to limit potential losses and avoid overleveraging their positions. Patience and discipline are key to navigating the ups and downs of the oil market and achieving long-term success.
Impact of Economic Events
Several economic events are scheduled for the coming days that could impact the WTI. The EUR data release on Wednesday, March 11, will provide insights into the economic health of the Eurozone, potentially affecting global risk sentiment. The USD data releases on the same day, including reports on Producer Price Index (PPI) and retail sales, could influence the dollar's strength and subsequently impact commodity prices. Additionally, the GBP data on Friday, March 13, and further USD data, including reports on industrial production and consumer sentiment, will provide a comprehensive view of the global economic landscape.
The JPY data released on Monday, March 9, may indicate broader market trends. The USD data, released on Tuesday, March 10, may also provide insights into the strength of the US economy. These events can trigger volatility and shift market sentiment, emphasizing the need for traders to stay informed and adapt their strategies accordingly.
WTI: Key Levels to Watch
Given the current technical and fundamental backdrop, here are key levels to watch for WTI:
- Resistance 1: $65.42
- Resistance 2: $66.36
- Resistance 3: $67.23
- Support 1: $63.61
- Support 2: $62.74
- Support 3: $61.80
Trading Strategy Considerations
For short-term traders, the overbought conditions signaled by the RSI and Stochastic oscillator on the 1-hour chart may present opportunities to fade the recent rally. However, it's important to wait for confirmation of a reversal before initiating short positions, such as a break below key support levels. Long-term investors may view any pullbacks as buying opportunities, given the overall bullish trend and the potential for further gains.
As WTI navigates these crosscurrents, the price is holding at $82.99, a sign of resilience. The next few days will be critical in determining if this level can be sustained. Keep a close eye on the economic calendar and geopolitical developments to stay ahead of the curve.
Frequently Asked Questions: WTI Analysis
What happens if WTI breaks above $65.42 resistance?
If WTI breaks above the $65.42 resistance level, it could signal a continuation of the bullish trend, potentially leading to further gains towards the $66.36 and $67.23 levels. This breakout would likely be driven by positive economic data or further escalation of geopolitical tensions.
Should I buy WTI at current levels of $82.99 given RSI at 71.16?
With the RSI at 71.16 on the 1-hour chart, WTI may be entering overbought territory, suggesting a potential near-term pullback. It may be prudent to wait for a correction or consolidation before initiating long positions to avoid chasing the rally.
Is the MACD signal still bullish for WTI?
While the MACD remains positive on the 4-hour and daily charts, indicating continued bullish momentum, the 1-hour chart shows negative momentum, suggesting a potential short-term pullback. Traders should monitor the MACD across different timeframes for confirmation of a sustained trend.
How will the upcoming GDP data affect WTI this week?
Upcoming GDP data releases will provide insights into the strength of the global economy, particularly in major economies like the United States and China. Stronger-than-expected GDP growth could boost oil demand and support WTI prices, while weaker data could trigger a correction.
Track markets in real-time
AI-powered analysis, technical indicators and real-time price data.
Join Our Telegram Channel
Breaking market news, AI analysis and trading signals instantly.
Join Channel