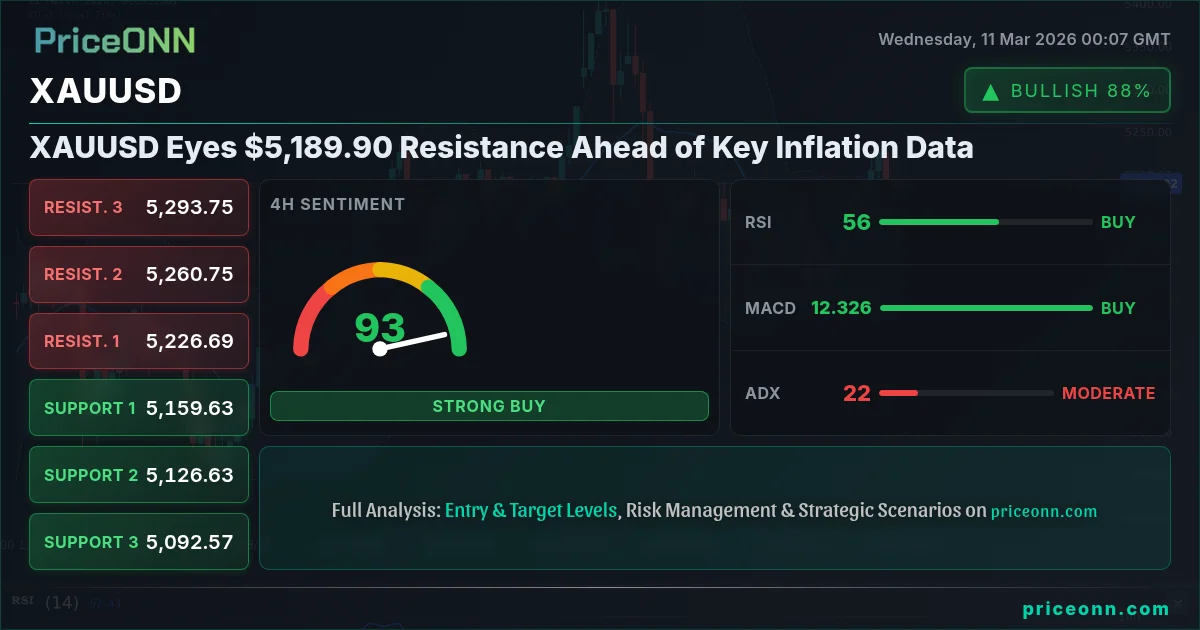
Gold's recent surge has bulls eyeing the $5,200 level, but the path ahead isn't clear. XAUUSD is currently trading at $5,189.90, and a breakout above immediate resistance hinges on upcoming economic data and geopolitical developments. The dollar index is strengthening, putting pressure on gold.
- RSI hovers at 55.73 on the daily chart, suggesting room for further upside but also increasing risk of a pullback.
- Immediate resistance lies at $5,213.97, a break above which could trigger a rally towards $5,291.37.
- The upcoming CPI data is expected to be a major catalyst, potentially driving volatility in both the dollar and gold.
- Geopolitical tensions in the Middle East continue to provide underlying support, but risk appetite could shift quickly.
Technical Overview: A Multi-Timeframe Perspective
A multi-timeframe analysis of XAUUSD reveals a mixed picture. On the 1-hour chart, the trend is neutral, with the ADX at a weak 15.03, indicating a lack of strong directional momentum. The RSI at 54.42 is also neutral, suggesting neither overbought nor oversold conditions. However, the MACD shows negative momentum, with the signal line above the MACD line, indicating potential for further downside in the short term. Scalpers should watch the $5,182.43 support level for potential shorting opportunities.
Zooming out to the 4-hour chart, the trend remains neutral. The ADX is slightly higher at 23.2, but still not indicative of a strong trend. The RSI is similar at 54.05. However, the MACD flips to positive momentum, with the signal line below the MACD line, suggesting a possible bullish reversal. The Stochastic oscillator is in overbought territory at 84.36, which could signal a pullback before further upside. Swing traders might look for a break above the $5,248.86 resistance as a signal to enter long positions.

The daily chart presents a bullish outlook. The trend is up, with a strength of 76%. The RSI is at 55.73, leaving room for further gains before reaching overbought conditions. However, the MACD shows negative momentum, mirroring the 1H chart. This divergence between the daily trend and the MACD signal warrants caution. Long-term investors should monitor the $5,037.06 support level, a break below which could invalidate the bullish outlook.
Key Levels and Breakout Potential
Key support levels to watch are $5,182.43 (1H), $5,195.69 (4H), and $5,037.06 (1D). A break below these levels could signal a deeper correction. On the upside, immediate resistance lies at $5,196.66 (1H), $5,248.86 (4H), and $5,213.97 (1D). A sustained break above these levels could open the door for a rally towards $5,291.37 and potentially $5,390.88.
The Bullish Case for Gold: Inflation and Geopolitical Risks
The bullish case for gold rests on several key factors. First, inflation remains a persistent concern, with many analysts expecting continued upward pressure on prices. Gold is often seen as a hedge against inflation, making it an attractive asset in an inflationary environment. Second, geopolitical risks continue to simmer, particularly in the Middle East. According to recent news, tensions remain high in the region, potentially supporting safe-haven demand for gold. As reported on March 10, oil prices retreated after Iran threatened an export halt amid Middle East tensions which may further add to the inflationary environment.
Furthermore, central bank buying continues to provide underlying support. While specific data on central bank purchases is not available today, the long-term trend of central bank accumulation remains intact. Central banks, particularly in Russia and China, have been steadily increasing their gold reserves in recent years, viewing it as a hedge against geopolitical uncertainty and dollar devaluation. This sustained demand from central banks acts as a floor for gold prices.
The Bearish Scenario: Dollar Strength and Rising Rates
The bearish scenario for gold centers on the potential for continued dollar strength and rising interest rates. The dollar index (DXY) is currently at 98.7, up 0.33% on the day. A stronger dollar typically puts downward pressure on gold prices, as gold is priced in dollars. Additionally, rising interest rates make holding gold less attractive, as it does not offer a yield. The market is closely watching the Federal Reserve's next move, with expectations for further rate hikes later this year. If the Fed adopts a more hawkish stance, it could weigh on gold prices.
Real interest rates are also a key factor to watch. Real interest rates are nominal interest rates minus inflation. When real interest rates are positive, it makes holding gold less attractive, as investors can earn a real return on other assets. However, when real interest rates are negative, as they have been for much of the past few years, it makes holding gold more attractive, as it offers a store of value that is not eroded by inflation. The current level of real interest rates is supportive of gold, but any significant increase could trigger a selloff.
Economic Calendar: CPI in Focus
The economic calendar is packed with key events that could impact gold prices. Today, March 11, sees the release of EUR data, followed by USD data and USD data. However, the main event of the week will be the release of CPI data. The market is expecting a slight increase in inflation, which could support gold prices. Traders should also keep an eye on USD data, as a weaker-than-expected reading could boost gold.
On March 13, GBP data will be released, followed by USD data and USD data. A strong reading could strengthen the dollar and put downward pressure on gold. Therefore, the CPI data will be closely watched by gold traders.
Correlation Analysis: DXY and Equities
Gold's price action is heavily influenced by correlations with other asset classes. The most significant is the inverse correlation with the dollar index (DXY). As the DXY rises to 98.7, XAUUSD faces pressure. The strength of the dollar reflects expectations for US interest rates and the relative strength of the US economy. A hawkish Fed stance tends to boost the dollar and weigh on gold.
Gold also exhibits a complex relationship with equities. In times of risk aversion, gold tends to rise as investors seek safe-haven assets, while equities decline. However, in risk-on environments, equities tend to outperform gold. The SP500 is currently at 6792.7, up slightly on the day. A significant decline in equities could trigger a flight to safety, benefiting gold. The Nasdaq100 is at 24994.69, up 0.27% on the day. The DowJones30 is at 47752, up 0.14% on the day.
Historical Perspective: Gold's Performance During Inflationary Periods
Historically, gold has performed well during periods of high inflation. In the 1970s, for example, gold prices soared as inflation spiraled out of control. However, gold's performance has been more mixed in recent inflationary episodes. This is partly due to the fact that central banks have become more proactive in fighting inflation, raising interest rates to cool down the economy. Additionally, the rise of cryptocurrencies has provided an alternative hedge against inflation, potentially diverting some demand away from gold. Despite these factors, gold remains a relevant asset in an inflationary environment.
Trading Strategy: Risk Management is Key
Trading gold requires careful risk management. Given the current volatility and mixed technical signals, traders should be cautious and avoid overleveraging. Stop-loss orders should be placed strategically to limit potential losses. Position sizing should be conservative, reflecting the high degree of uncertainty in the market. Patience is key. Wait for clear signals and avoid chasing breakouts. The market always provides a second chance.
Key Levels
Support Levels
Resistance Levels
Frequently Asked Questions: XAUUSD Analysis
What happens if XAUUSD breaks above $5,213.97 resistance?
A sustained break above the $5,213.97 resistance level on the daily chart could trigger a significant rally, potentially targeting the $5,291.37 and $5,390.88 levels. However, traders should be mindful of the negative MACD momentum and the overbought Stochastic oscillator on the 4-hour chart, which could signal a pullback before further upside.
Should I buy XAUUSD at current levels of $5,189.90 given the mixed signals?
Given the mixed technical signals and upcoming economic data, a cautious approach is warranted. While the daily trend is bullish, the negative MACD momentum and overbought Stochastic oscillator on the 4-hour chart suggest potential for a pullback. A conservative strategy would be to wait for a clear breakout above $5,213.97 with confirmation from the MACD before entering long positions.
Is RSI at 55.73 on the daily chart a buy signal for XAUUSD?
An RSI of 55.73 on the daily chart is not necessarily a buy signal on its own. While it indicates that there is room for further upside before reaching overbought conditions, traders should also consider other factors, such as the MACD momentum and key support and resistance levels. A more comprehensive analysis is needed before making a trading decision.
How will the upcoming CPI data affect XAUUSD this week?
The upcoming CPI data is expected to be a major catalyst for XAUUSD. A higher-than-expected reading could reinforce inflation concerns, boosting gold prices. Conversely, a weaker-than-expected reading could strengthen the dollar and put downward pressure on gold. Traders should be prepared for increased volatility around the time of the release.
Track markets in real-time
AI-powered analysis, technical indicators and real-time price data.
Join Our Telegram Channel
Breaking market news, AI analysis and trading signals instantly.
Join Channel